

Introduction
In response to global climate change, low CO2 emissions have become a focus of worldwide attention and discussion. In 2020, General Secretary Xi Jinping proposed a “dual carbon” target as an inherent requirement for China to implement the new development concept. CO2 emissions and energy-saving policy measures have also become the focus of China and its provinces and regions. Hubei Province, a populous and economically robust region in central China, boasts abundant natural and human resources, holding a significant position in the national economic landscape. Pre-epidemic data illustrates the province’s solid economic growth, with a Gross Domestic Product (GDP) exceeding 4.5 trillion yuan and a per capita GDP surpassing 100,000 yuan. Implementing energy conservation and emission reduction, as well as fostering a low-carbon economy in Hubei Province, is an inevitable choice towards achieving sustainable development. In response to climate change and to promote green development, Hubei Province has taken a series of measures: the carbon emissions trading market has been in full swing since its launch in 2014, and Hubei’s carbon market quota has exceeded 300 million tonnes, with turnover exceeding 8.3 billion yuan. Additionally, as the provincial capital Wuhan continues to advance the development of a “two-type” urban circle along with the promotion of green transportation and the implementation of ecological restoration projects, the efficiency of energy consumption has been significantly enhanced. These initiatives are pivotal in fostering a sustainable urban ecosystem that harmonizes economic growth with environmental stewardship. However, against the above background, the issue of high energy consumption and high emissions in Hubei’s economic development continues to pose challenges for further emission reductions. The Hubei carbon market covers carbon emissions from the industrial sector, which accounts for 70% of the output value of the secondary industry, indicating that this sector remains a focal point and a difficult issue for emission reduction. In terms of energy structure, Hubei’s total energy consumption has consistently been no less than 150 million tons of standard coal in recent years, with coal consumption accounting for over 50% [1]. Facing the pressure of increasing energy demand due to sustained economic growth, Hubei still confronts numerous challenges in achieving its peak carbon emission targets, particularly in high energy-consuming industries such as steel and chemical industries. To better delineate the effects of emission reduction policies, it is necessary to study the impact of CO2 emissions in Hubei and the associated transmission mechanisms. By further analyzing the factors influencing CO2 emissions in Hubei, we can identify key areas for emission reduction and potential opportunities. In conjunction with the economic development trends and energy consumption patterns of Hubei Province, more scientifically sound energy-saving and emission-reduction policies should be formulated to achieve coordinated development of the society, economy, and environment.
Scholars widely acknowledge that CO2 emissions are affected by many factors, and extensive studies have been conducted deeply into the impact factors of CO2 emissions. These studies were generally based on the Logarithmic Mean Divisia Index (LDMI) model and Vector Autoregressive (VAR) model for the decomposition of factors influencing CO2 emissions: Lin and Liu [2] used the exponential factor decomposition method to analyze the decomposition of CO2 emission factors. Wang and Wang [3] employed the grey correlation method to analyze the CO2 emission factors in all of China’s provinces. Wang et al. [4] used the logarithmic mean weight Divisia decomposition method to establish a decomposition model of the influencing factors of per capita carbon emissions in the coastal areas of Jiangsu Province. Lei [5] used the extended Stochastic Impacts by Regression on Population, Affluence, and Technology (STIRPAT) model to explore the impact of global or regional factors using multiple regression analysis emissions. Martínez-Zarzoso et al. [6] estimated a semiparametric mixed model to analyze the impact of factors influencing carbon emissions in developing countries. Almulali et al. [7] used the Fully Modified Ordinary Least Squares (FMOLS) long-term relationship between urbanization, energy consumption, and carbon emissions in seven regions, including East Asia and the Pacific. Gao et al. [8] decomposed regional per capita carbon emission changes by drawing on the LDMI factor decomposition method and made relevant recommendations from the results. Li and Yao [9] used a VAR model to analyze China’s carbon emissions factors from energy consumption. Jie et al. [10] used the Kaya-LMDI method to analyze the drivers of China’s CO2 emissions from energy consumption. For the last few years, more researchers empirically examined the relationship between CO2 emissions and various economic factors through panel modeling: Ali [11] used a fixed effects panel threshold model to explore the impact of innovation in economic factors on CO2 emissions in EU countries. Baltagi et al. [12] used a mixed panel data model with fixed and random coefficients to construct a logit model with structural breaks to estimate the relationship between CO2 emissions and GDP internationally. Xi and Niu [13] analyzed CO2 emissions factors based on international panel data. Zhang and Wang [14] analyzed the nonlinear impact of economic growth on CO2 emissions through provincial panel data.
Although scholars have utilized various statistical tests to assess the determinants of CO2 emissions, there is a notable focus on China’s national perspective. This concentration often overlooks local data analysis or fails to address the dynamic interactions and long-term synchronization among the variables adequately. On the other hand, scholars use the traditional LDMI model and VAR model to study and analyze the influencing factors of CO2 emissions in China and the region, which are relatively mature and can better overcome the influence of selecting factor variables due to subjective preferences or the difficulty of collection. But at the same time, it is often challenging to account for the temporal characteristics of the decomposition of CO2 emission factors and their interactions, given the inherent limitations of the models used. Panel modeling, conversely, tends to focus more on delineating the causal links between CO2 emissions and various economic factors, rather than better interpreting the intrinsic effects of CO2 emissions or the dynamic transmission mechanism. Although several studies have attempted to use extended correlation models to break through the limitations of traditional model analysis, such as the Mixed-Frequency Vector Autoregressive (MF-VAR) model [15], they still cannot completely portray the link between carbon emission influencing factors with dynamic transmission mechanisms.
Hubei Province is chosen as the subject of this study due to its significant role as a major economic province in central China. Since the reform and opening up, Hubei has undergone a crucial transition from rough to intensive growth. Analyzing this province can provide valuable insights into the dynamic impacts of factors affecting CO2 emissions at various stages of regional economic development. Another important reason for choosing Hubei as the target of this study is that China has taken the lead in piloting the CO2 emissions trading market in seven provinces, and Hubei is one of them [16- 18]. The European Union and the United States, among other economies, have established more mature carbon trading markets, and research surrounding these markets indicate that the emission reduction effect is significant [19, 20]. Furthermore, studies on China’s emerging pilot markets reveal that carbon emissions trading can significantly enhance regional industrial structural change [21], and the establishment of the carbon trading market appears to have a certain effect on enhancing carbon emission efficiency [22]. In contrast, Zhou et al. [23] examined the efficiency of China’s carbon trading market based on the variance ratio and found that carbon trading policy promotes green economic growth and improves environmental quality [24, 25]. The aforementioned studies suggest that China’s carbon emission trading market generally stimulates the development of low-carbon technologies and the transformation of industrial structures, thereby influencing the carbon emissions of the regions involved. However, it lacks specific and in-depth research into the differential impacts of the various pilot regions, which have varied systems and price determination mechanisms within the carbon emissions trading market. Among all the pilot provinces, Hubei Province stands out as a carbon market trading “hub” - the location of the national carbon emissions registration system. Hubei is expected to attract the rapid gathering of information, technology, talent, and capital flow by means of the “China Carbon Registration and Trading” to form a green, low-carbon, and high-tech industry chain of more than one hundred billion yuan, which makes it essential to analyze the time-varying characteristics of the factors affecting the CO2 emissions in Hubei Province, as well as the dynamic effects, relying on more sophisticated algorithms and models.
To further investigate the time-varying characteristics of CO2 emission influencing factors and their dynamic effects, this paper firstly factorizes the CO2 emission influencing factors in Hubei Province based on Kaya’s constant equation, to objectively obtain the CO2 emission influencing variables. Within the framework of Monte Carlo analysis, we use the Time-Varying Parameter Vector Autoregressive (TVP-VAR) model to analyze the dynamic transmission effect between CO2 emission influencing factors based on different time points in stages [26]. Our analysis particularly focuses on the CO2 emission influencing effect generated by the establishment of the carbon emissions trading market in Hubei Province in 2014, which marks a significant point in time.
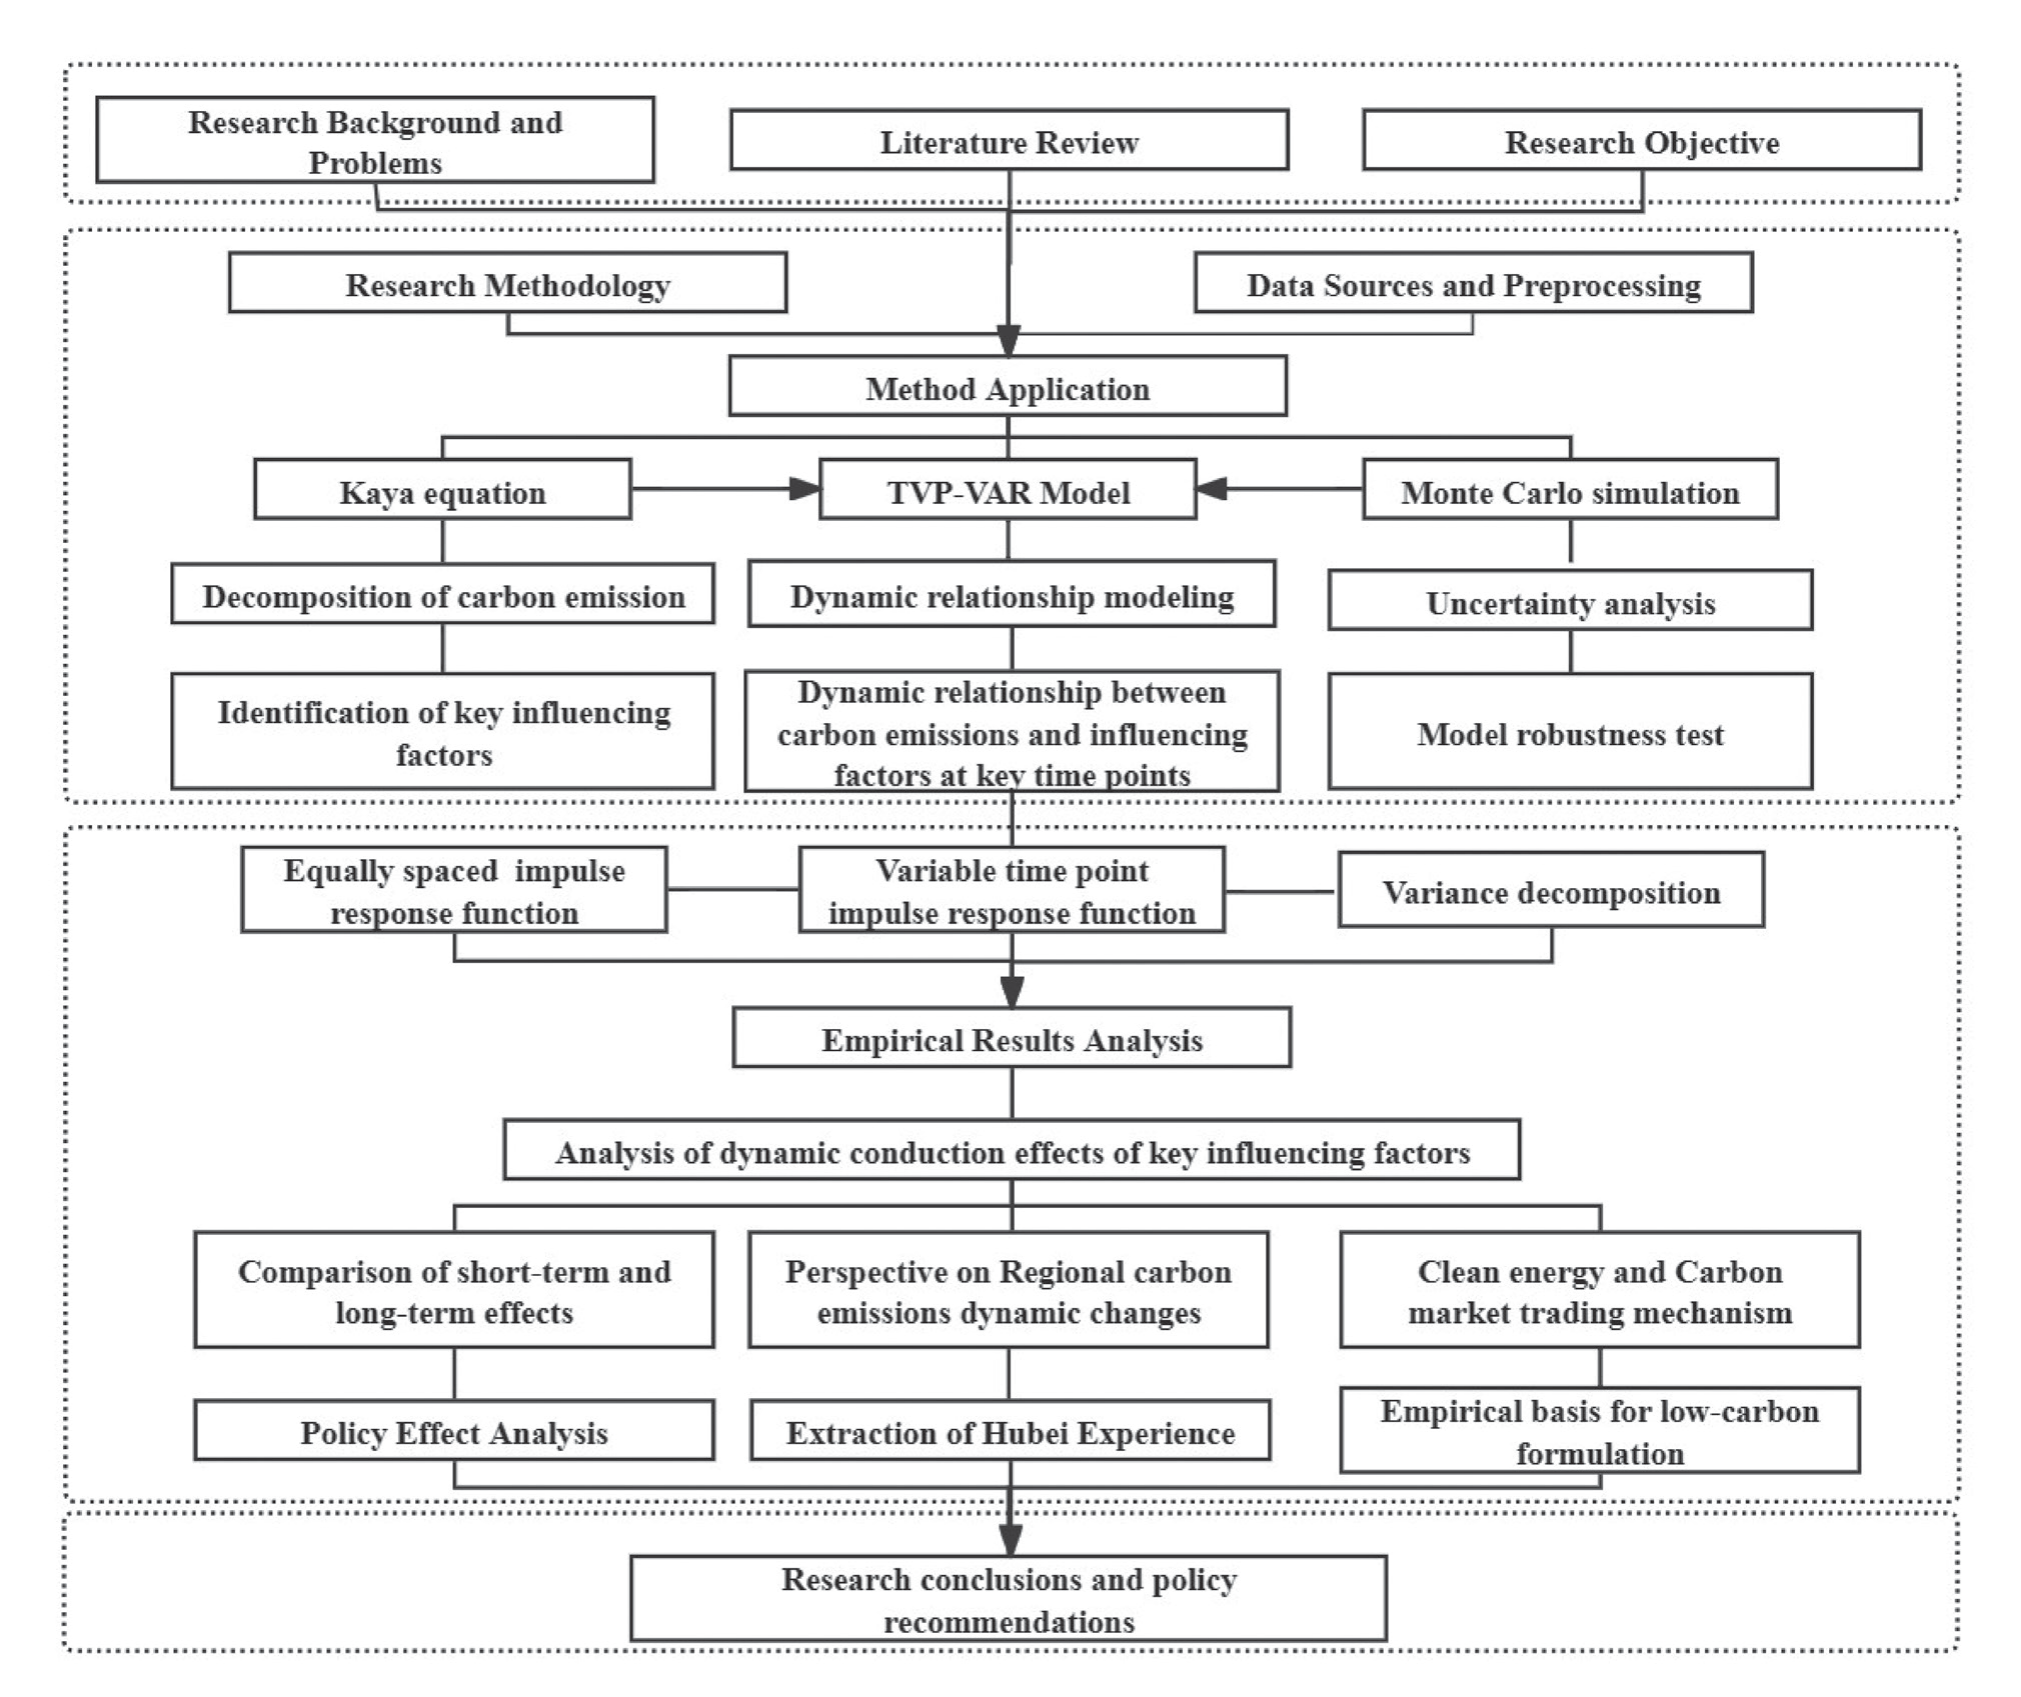
Simultaneously, to more vividly elucidate the research underpinnings and structural framework of this study, we have added the research framework diagram, as delineated in Fig. 1.
Materials and Methods
Kaya Equation
The Kaya Equation [27] is a simple mathematical formula that relates CO2 emissions from human activities to economic, policy, and demographic factors. In this paper, the Kaya carbon constancy equation is broken down into the corresponding CO2 emission influencing factors and expressed as:
Where C is CO2 emissions, Ci is the CO2 emissions of the energy source, TE is the total consumption of energy, GDP is gross domestic product GDP, and P is population size. CI stands for CO2 intensity, which is the ratio of carbon emissions to total energy. EI stands for energy intensity, which is the ratio of total energy consumption to GDP, and PGDP is per capita GDP.
From this, Equation (1) can be rewritten as:
The right side of Equation (2) divides the main CO2 emission drivers into multiplicative factors, while the left side corresponds to CO2 emissions. According to the equation and the corresponding literature analysis, CO2 emissions are mainly determined by influencing factors: population, economic development level, energy intensity, and CO2 emission intensity.
Data and Descriptive Statistics
So the following variables have been selected as the main research variables in this paper:
CO2 emissions: Since the consumption of fossil and other energy sources is the main source of CO2 emissions, the total CO2 emissions are mainly measured on the basis of three energy sources with large CO2 emissions, namely coal, oil, and natural gas; according to the measurement method provided by the IPCC, CO2 emissions = Σ consumption of energy i* carbon emission factor of energy i (i is the type of energy source), and energy consumption must be converted into standard coal in a uniform unit of heat. The CO2 emission factors for coal, oil, and natural gas are 0.7476 tC/tonne of standard coal, 0.5825 tC/tonne of standard coal, and 0.4435 tC/tonne of standard coal, respectively. CO2 emissions are recorded as CC.
CO2 emission intensity: CO2 emission intensity is the ratio of carbon emissions to total energy consumption (tC/tonne), which is referred to as CI.
Energy intensity: Energy intensity is the ratio of total energy consumption (tC/tonne) to total GDP (CNY billion) in Hubei Province, which is referred to as EI.
Population: Population size is based on the Hubei Statistical Yearbook and is expressed as the total population (per ten thousand people) at the end of each year in Hubei Province, which is referred to as P.
Economic development level: Economic development level is expressed as per capita GDP in Hubei Province, which is referred to as PGDP.
We take natural logarithms to eliminate heteroscedasticity and multicollinearity. All variables of CO2 emissions, per capita GDP, population size, energy intensity, and carbon intensity of energy were taken as lnCC, lnPGDP, lnP, lnEI, lnCI.
The data frequency is annual and the sample interval is 1985–2020. The raw data are from Hubei Provincial Statistical Yearbook and Statistical website.
Table 1 shows the main variables conform to the stable data structure. After logarithmic treatment, the statistical properties of the variables themselves differ less. where the mean values of lnCC, lnEI and lnCI are 8.6456, -0.4317, and 0.5504, respectively, and the medians are 8.3762, -0.4772, and 0.4877, respectively. The standard deviations of the three variables are 0.7835, 0.1142, and 0.8210, and these data show good results. The variables of lnP and lnPGDP also do not have large deviations. Statistical results surface data can enable the next step of empirical modeling analysis.
TVP-VAR Model
The VAR model was introduced by Sims [28] and it relies on the statistical nature of the data and constructs the model by taking each endogenous variable in the system as a function of the lagged values of all the endogenous variables. The VAR model has been widely used for predicting interrelated time-series systems and analyzing the stochastic perturbations of the system dynamic shocks.
Traditional VAR is difficult to apply for estimating non-linear time series, and cannot adequately explain the time-varying dynamic characteristics between variables. Primiceri [29] improved and developed the TVP-VAR model by introducing parameters that fluctuate over time. These time-varying parameters capture the model’s dynamic and nonlinear features, enabling a more nuanced analysis of the time-varying and nonlinear impacts on CO2 emissions.
A traditional VAR model can be expressed as:
Where yt is a k × 1 dimensional observable variable, A, F1, ..., Fs are k × k dimensional coefficient matrices, and ut is a k × 1 dimensional structural shock. Assume that ut ~ N(0,∑∑)
Model (3) is simplified to:
Where Bi = A-1Fi, i = 1, …, s . The elements of Bi are superimposed in columns to form the k2 × 1 dimensional vector β. Define xt = Is ⨂ (yt–1, …, yt–s), ⨂ as the Kronecker product. Then the model can be further simplified as:
Changing model (5) to a time-varying parametric model yields the TVP-VAR model:
The elements in AT can be further simplified:
where
The time-varying parameters are assumed to obey a random wandering process:
Where
Referring to Nakajima [30], after the model is constructed, this paper will apply Markov Monte Carlo simulation (MCMC algorithm) in a Bayesian framework for estimation, so assume that β, α, and h obey the a priori normal distribution. Mean of μβ0 = μα0 = μh0 = 0, covariance matrix ∑β0 = ∑α0 = ∑h0 = 10 × I. Also, assume that the ith diagonal element of the covariance matrix obeys the following gamma distribution:
The model was estimated using prior distribution ω = (∑β, ∑α, ∑h) for model estimation. First, initialize β, α, h, ω; then, sample the data from the high-dimensional posterior distribution of the parameters, and iterate the loop until MCMC reaches convergence.
Table 2.
ADF test.
Results and Discussion
Augmented Dickey-Fuller Stable Test of Variables
In order to prevent spurious regressions and ensure the stability of variables, the Augmented Dickey-Fuller (ADF) unit root test is typically used. The final result is that ADF statistics for lnCI, lnCC, lnPGDP, lnEI, are all greater than their critical values, indicating that they are unstable, with the exception of lnP. When differenced at first order, lnCC, lnCI, pass the test of smoothness at the 10% level of significance. When differenced at the second order, all series pass the smoothness test at the 1%, 5%, and 10% significance levels. Therefore, lnCI, lnCC, lnPGDP, lnEI, and lnP are all smooth series as shown in Table 2.
Johansen Cointegration Test Results
The Johansen test is a better method of conducting multivariate cointegration tests. The Johansen cointegration test was conducted on lnCI, lnPGDP, lnP, lnEI, and lnCC (Table 3).
The model assumptions are no constant and time trend terms. Trace Statistic and Prob both reject the original hypotheses of R = 0, R ≤ 1 and R ≤ 2 at the 5% significance level and accept the original hypotheses of R ≤ 3 and R ≤ 4. The Johansen test indicates that lnCC, lnPGDP, lnP, lnEI, and lnCI are co-integrated, a long-term equilibrium relationship between CO2 emissions and economic development level, population size, energy intensity, and CO2 emission intensity in Hubei Province.
Model Estimation under the MCMC Algorithm
The model is estimated by Markov chain Monte Carlo simulation (MCMC algorithm) based on the Bayesian framework, and the optimal lag order of the model is determined to be 2 according to the optimal lag determination criterion of the VAR model. In addition, the number of MCMC samples is set to 10,000, and the first 1,000 samples are discarded to ensure the accuracy and reliability of the sampling results.
Table 4 shows that the values of the Geweke statistic are all smaller than the 95% critical value of 1.96 for the normal distribution, so the parameters cannot reject the original hypothesis of the test, which implies that the parameters estimated b y the simulation cannot be rejected to converge to the posterior normal distribution. The Inefficiency Factors serve to identify the number of irrelevant samples generated by the simulation, the smaller the value of the factor, the greater the number of irrelevant samples. The Inefficiency Factors in the table are less than 100, indicating that the samples obtained are valid.
Table 4.
MCMC algorithm result.
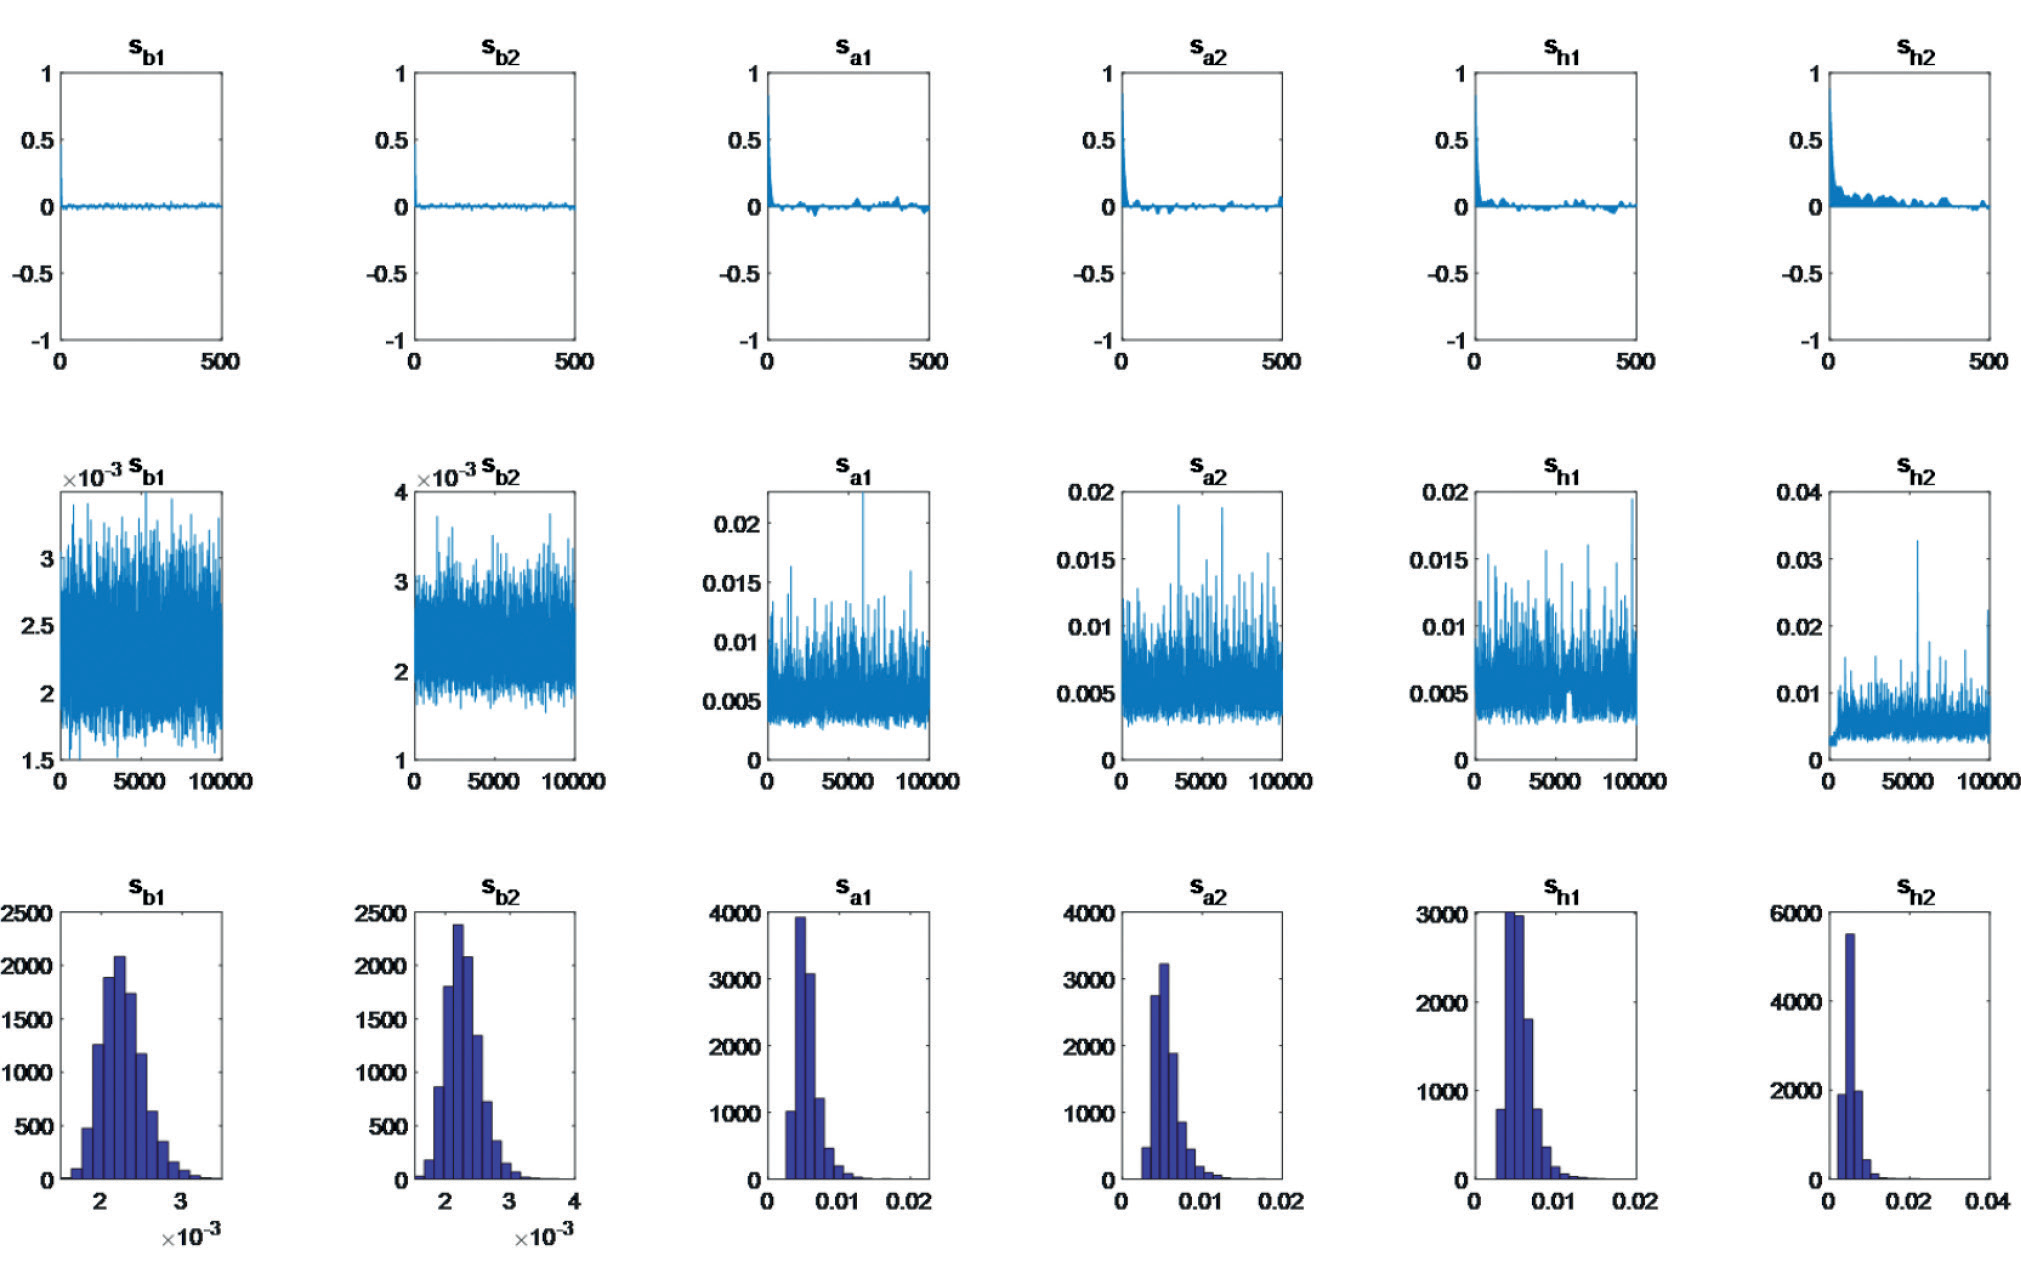
Meanwhile, Fig. 2 gives the sample autocorrelation coefficient, sample path, and density function plot of the posterior distribution. From Fig. 2, the autocorrelation coefficient of the samples is significantly reduced to the vicinity of 0, indicating that there is basically no autocorrelation in the samples sampled by Gibbs. The sample paths show strong smoothness, indicating that the simulated samples of the 10,000 times of the MCMC samples are valid correlation samples. The posterior distribution density functions of the parameters are approximately normal, which meets the requirements of constructing the TVP-VAR model. Taken together, the model appears to be adept at estimating, and we further established that the model system built by CI, CC, EI, PGDP, and P is robust and can reasonably analyze and identify the time-dependent interrelationships among the CO2 emission influencing factors in Hubei. This is particularly relevant in the context of the current global low-carbon perspective and China’s high-quality transformational development. The robustness of the system developed by the TVP-VAR model also objectively shows the superiority of using the expanded VAR model in this paper, which can be better used to study the time variability of the dynamic transmission mechanism among the carbon emission impact factors.
Equally Spaced Impulse Response Function
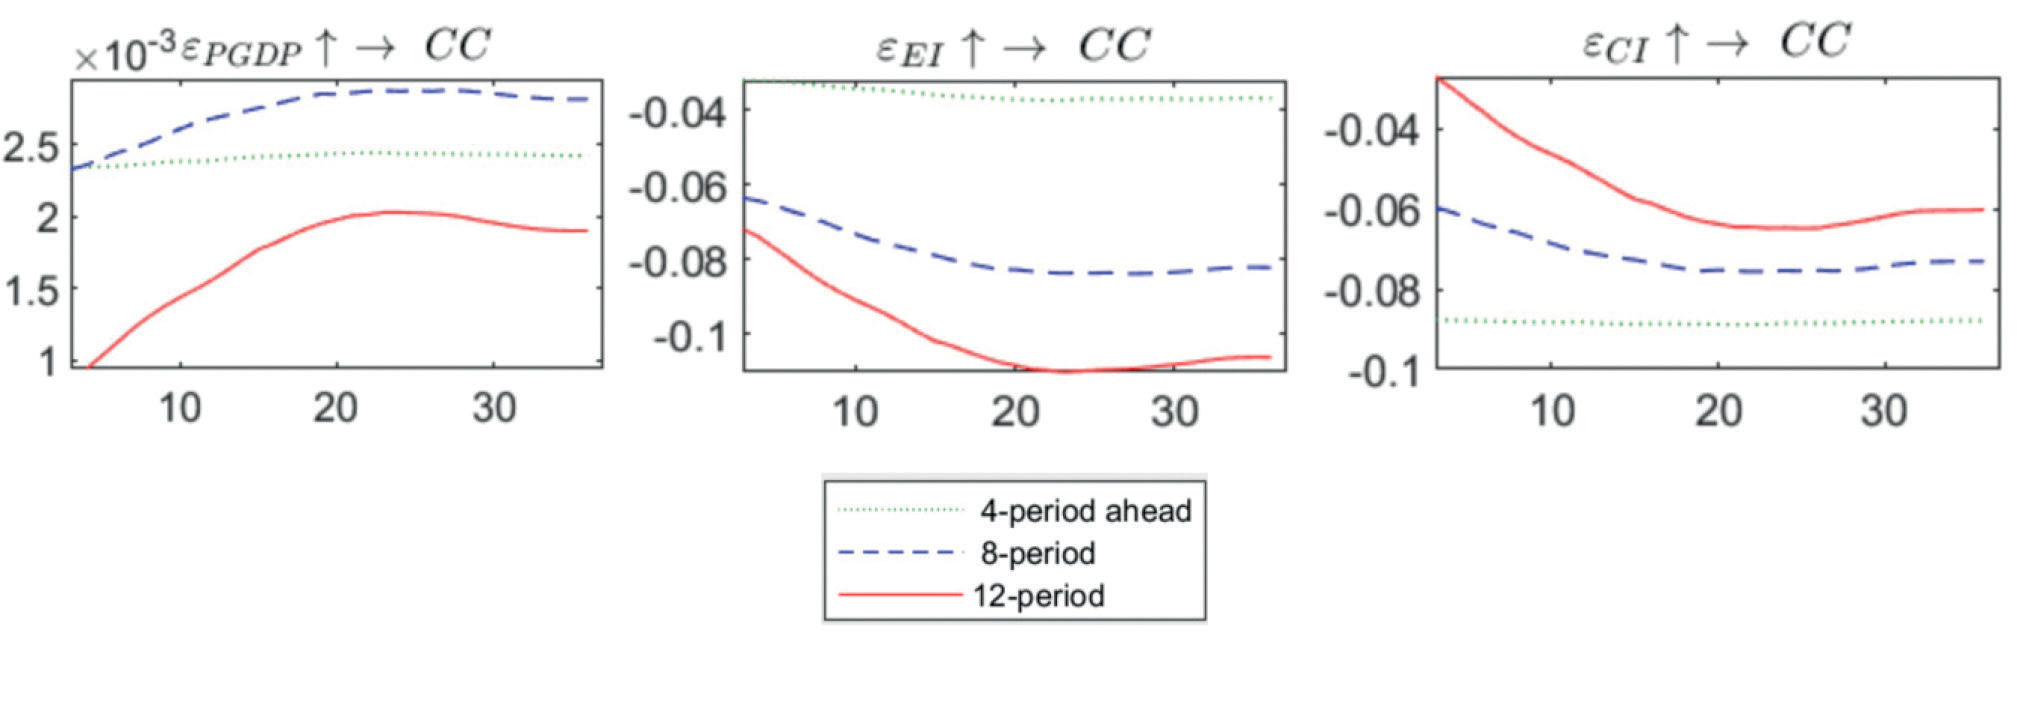
An equally spaced impulse response is the impulse response function of a variable induced by shocks of different time horizons (lags). Unlike the two-dimensional impulse response under the VAR model, the TVP-VAR model can use variable parameters to calculate the impulse response plots of each variable at all time points with different lags [31–33]. For the selection of time intervals, lag 4, lag 8 and lag 12 are chosen to measure the impacts of the factors affecting CO2 emissions in Hubei Province over the short, medium, and long terms, respectively.
Firstly, as shown in Fig. 3, the impact of the level of economic development on CO2 emissions is positive in the long term, while the short-term impact effect is significantly higher than the long-term effect, indicating that economic development will have a sustained impact on the changes in CO2 emissions. Yet, the trend of impact is slowing down as the level of the economy continues to rise. This observation is consistent with the findings of previous studies on the relationship between the level of economic development and CO2 emissions, including in India, Pakistan, and other developing countries [34, 35]. What’s more noteworthy is that CO2 emission intensity and energy intensity both have negative impacts on CO2 emissions, but energy intensity has a short-term negative impact that is smaller than the long-term impact, while CO2 emission intensity has a short-term negative impact that is larger than the long-term impact. With advancements in energy utilization technology and the gradual increase in the proportion of clean energy, the CO2 emissions per unit of energy will be reduced year by year, and the decrease in CO2 emission intensity will be larger than the decrease in energy intensity, which provides substantial evidence that the higher the efficiency of energy utilization in Hubei Province, the better the low-carbon development mode. Simultaneously, CO2 emission intensity partially reflects the control over the energy consumption structure, not only regarding total energy consumption but also the structure of energy consumption itself.
We further integrate the current developmental context of Hubei to dissect the reasons behind the short-term impact of energy intensity is smaller than the long-term impact, which can be elucidated through three key perspectives: first, the policy orientation, Hubei Province has implemented a series of long-term energy saving and emission reduction policies, such as optimizing the industrial structure, and the effects of these policies may not be immediately visible in the short term, but they can be visible in the long term. Second, Hubei Province is gradually reducing its reliance on coal within its energy structure and transitioning to clean energy sources, such as water, wind, and hydrogen. The province’s abundant wind energy resources, mainly relying on the jurisdiction of mountains and plains, along with its rich water energy resources that rely on the Yangtze River Basin, indicate significant potential for energy development. In terms of hydrogen energy, the “Several Measures to Support the Development of Hydrogen Energy Industry” has been issued, which explicitly proposes to take Wuhan, the capital city of Hubei Province, to establish a national hydrogen energy industry demonstration core area to support the rapid development of the hydrogen energy industry. The effect of many of the above structural changes on the reduction of energy intensity may not be obvious in these short term. Furthermore, in the long term, the carbon emissions trading market will lead to adjustments in market mechanisms and corporate behavior [36], thus gradually guiding enterprises to reduce energy consumption. Whereas CO2 emissions intensity with a short-term negative impact having a more significant effect than a long-term impact may often be due to the government’s introduction of stricter environmental regulatory policies, the immediate impact of such policies may lead to a significant short-term decline in CO2 emissions intensity. As one of the first pilot provinces for national carbon emissions trading, carbon trading implementation may cause enterprises to take quick measures to reduce CO2 emissions in the short term in order to adapt to the new market rules and minimize costs. From this, the combined analysis and comparison of the aforementioned reasons reveal that equally spaced impulse response results of the CO2 emission influencing factors in Hubei Province demonstrate the impact of the establishment of the carbon emissions trading market. We will continue to verify the above conclusions through experiments using the variable time point impulse response.
Variable Time Point Impulse Response Function
Variable time-point impulse response refers to the impulse response function at various specific time points, thus it can further examine the time-varying pattern of the impact of key time-point policies on CO2 emissions. Furthermore, it can also characterize the dynamic transmission mechanism between CO2 emissions but also its factors. To simplify the analysis process, we choose three typical time points to calculate the impulse response function, namely 1992, 2001, and 2014, which represent the rough development stage of the industrial economy, the beginning stage of industrial economic transformation and upgrading, and the low-carbon transformation stage of the industrial economy. Especially focusing on the key time points in 2014, this paper differs from previous literature that uses difference-in-differences carbon trading policy for assessment. Instead, this paper utilizes a complex system of carbon emission impact factors, as established by the TVP-VAR model. It examines the dynamic effect of the carbon emission trading market on CO2 emissions and the dynamic transmission mechanism generated by CO2 emissions with the impact factor shocks at variable time points.
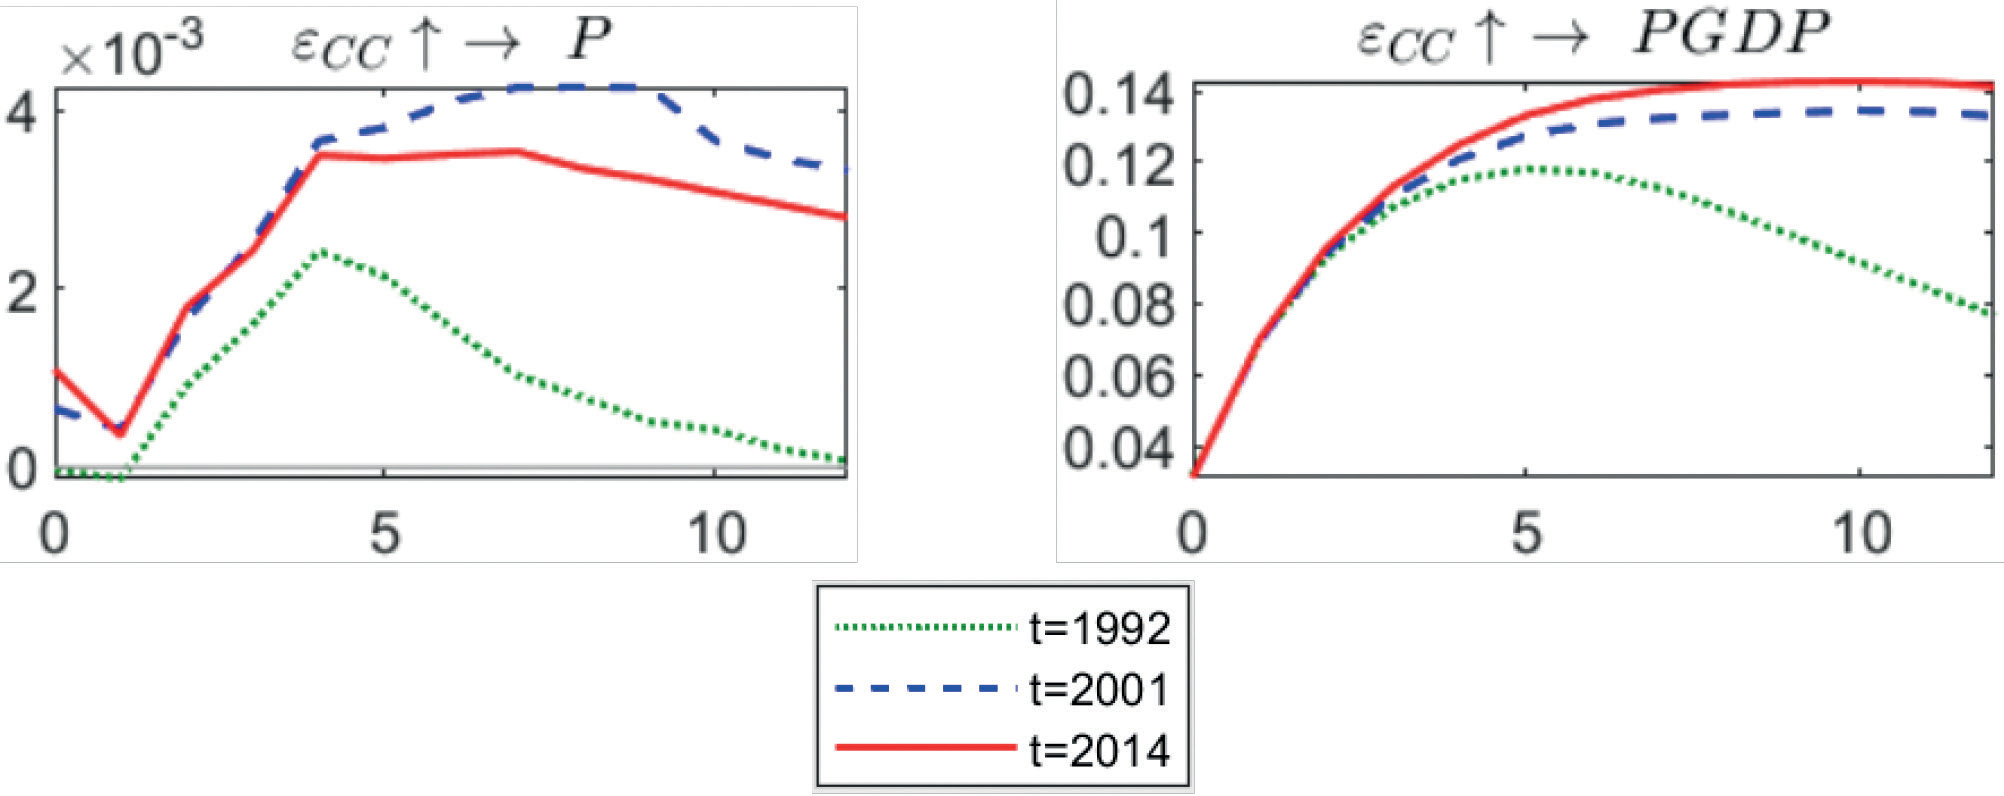
The impact of specific variable-time point shocks is specifically analyzed in conjunction with Fig. 4. Firstly, the upgrading of economic development has a continuous positive impact on CO2 emissions, with the establishment of the market economy in 1992 and China’s accession to the WTO in 2001, the level of China’s economy continues to develop. The rising economic level and the continuous development of the industrial economy will inevitably lead to a continuous increase in CO2 emissions, and this point with the passage of time, the effect of this economic development induced by an increase in CO2 emissions will still be sustained. The effect of population-induced CO2 emissions is relatively more complex. On the one hand, population growth tends to cause environmental congestion and an increase in CO2 emissions, but it may also reduce carbon emissions due to the development of the economy, the improvement of people’s quality of life, and the implementation of environmental protection policies. In Hubei, the population factor has a weak positive impact on CO2 emissions, but subsequently becomes a weak negative impact, before rising to a positive impact, which also indicates that as the population continues to grow, it will continue to increase CO2 emissions in the long term.
However, energy intensity continues to have a negative shock effect on CO2 emissions, and the negative shock effect represents a good carbon abatement effect, a dynamic abatement effect that was weak in 1992, strengthened in 2001, and still strengthened in 2014. The CO2 emission intensity is also the strongest policy shock effect in 2014, although the shock effect of energy intensity in 1992, 2001, and 2014 all reached the peak point of -0.0901 after a lag of 5 periods, and then the shock effect weakened, but the weakening effect in 2014 is relatively more gentle, and the sustained effect of the negative shock is the most obvious. The results further prove that the carbon trading market in Hubei Province has created a continuous emission reduction effect. Next, we try to further analyze and explain the dynamic emission reduction effect of the Hubei carbon emissions trading market. Carbon Trading System (CTS) is a market-based environmental policy instrument that incentivizes companies to reduce greenhouse gas emissions by creating a market for carbon credits. Structural emission reduction, technical emission reduction, and engineering emission reduction are the three main ways to achieve carbon emission reductions, and CTS is the fundamental incentive to drive enterprises to adopt structural emission reduction, technical emission reduction, and engineering emission reduction instruments in a market-based manner. By setting emission caps for enterprises, allocating emission allowances, trading allowances in the market, and providing economic incentives through various means, enterprises in Hubei Province under the carbon emissions trading market are encouraged to realize the adjustment of energy structure. They are guided to reduce reliance on traditional fossil energy sources and shift to the development and use of clean energy sources such as wind, water, and hydrogen. Additionally, the promotion of energy-efficient technologies and equipment, along with the research, development, and investment in high and new technologies, aims to reduce the demand for enterprises to purchase carbon emission allowances. The Hubei government has also endeavored to diversify its carbon emission allowances by using a broad spectrum of financial instruments. Hubei also strives to offer financial support to large-scale engineering emission reduction projects and related enterprises with diversified carbon financial innovation products such as carbon asset trusteeships and carbon pledge loans. As one of the first pilot provinces, Hubei’s carbon market leads China in both liquidity and the cumulative turnover of carbon allowances [37], which demonstrates the high degree of activity and maturity of Hubei’s carbon market. Consequently, the policy-driven dynamic emission reduction effects are prominently evident. This also further confirms that the feedback effect of positive interaction has been formed between the CO2 emission factors in Hubei Province, which realizes the effective dynamic transmission mechanism to promote the carbon emission reduction target [38–40]. Although compared with the more robust market mechanisms for auctioning allowances formed in mature carbon trading markets such as in Europe and the United States, China’s carbon emissions trading market is in the exploration and improvement stage of the initial allocation of allowances. However, by integrating the mature experiences from Europe and the United States, China is forging a differentiated carbon market emission reduction path that is tailored to its own national conditions. This paper takes Hubei, a typical pilot province, as a case study, and its experimental results have proved the dynamic emission reduction effect of China’s active carbon emissions trading policy, and provide effective experiences for the improvement of the national carbon emissions trading market.
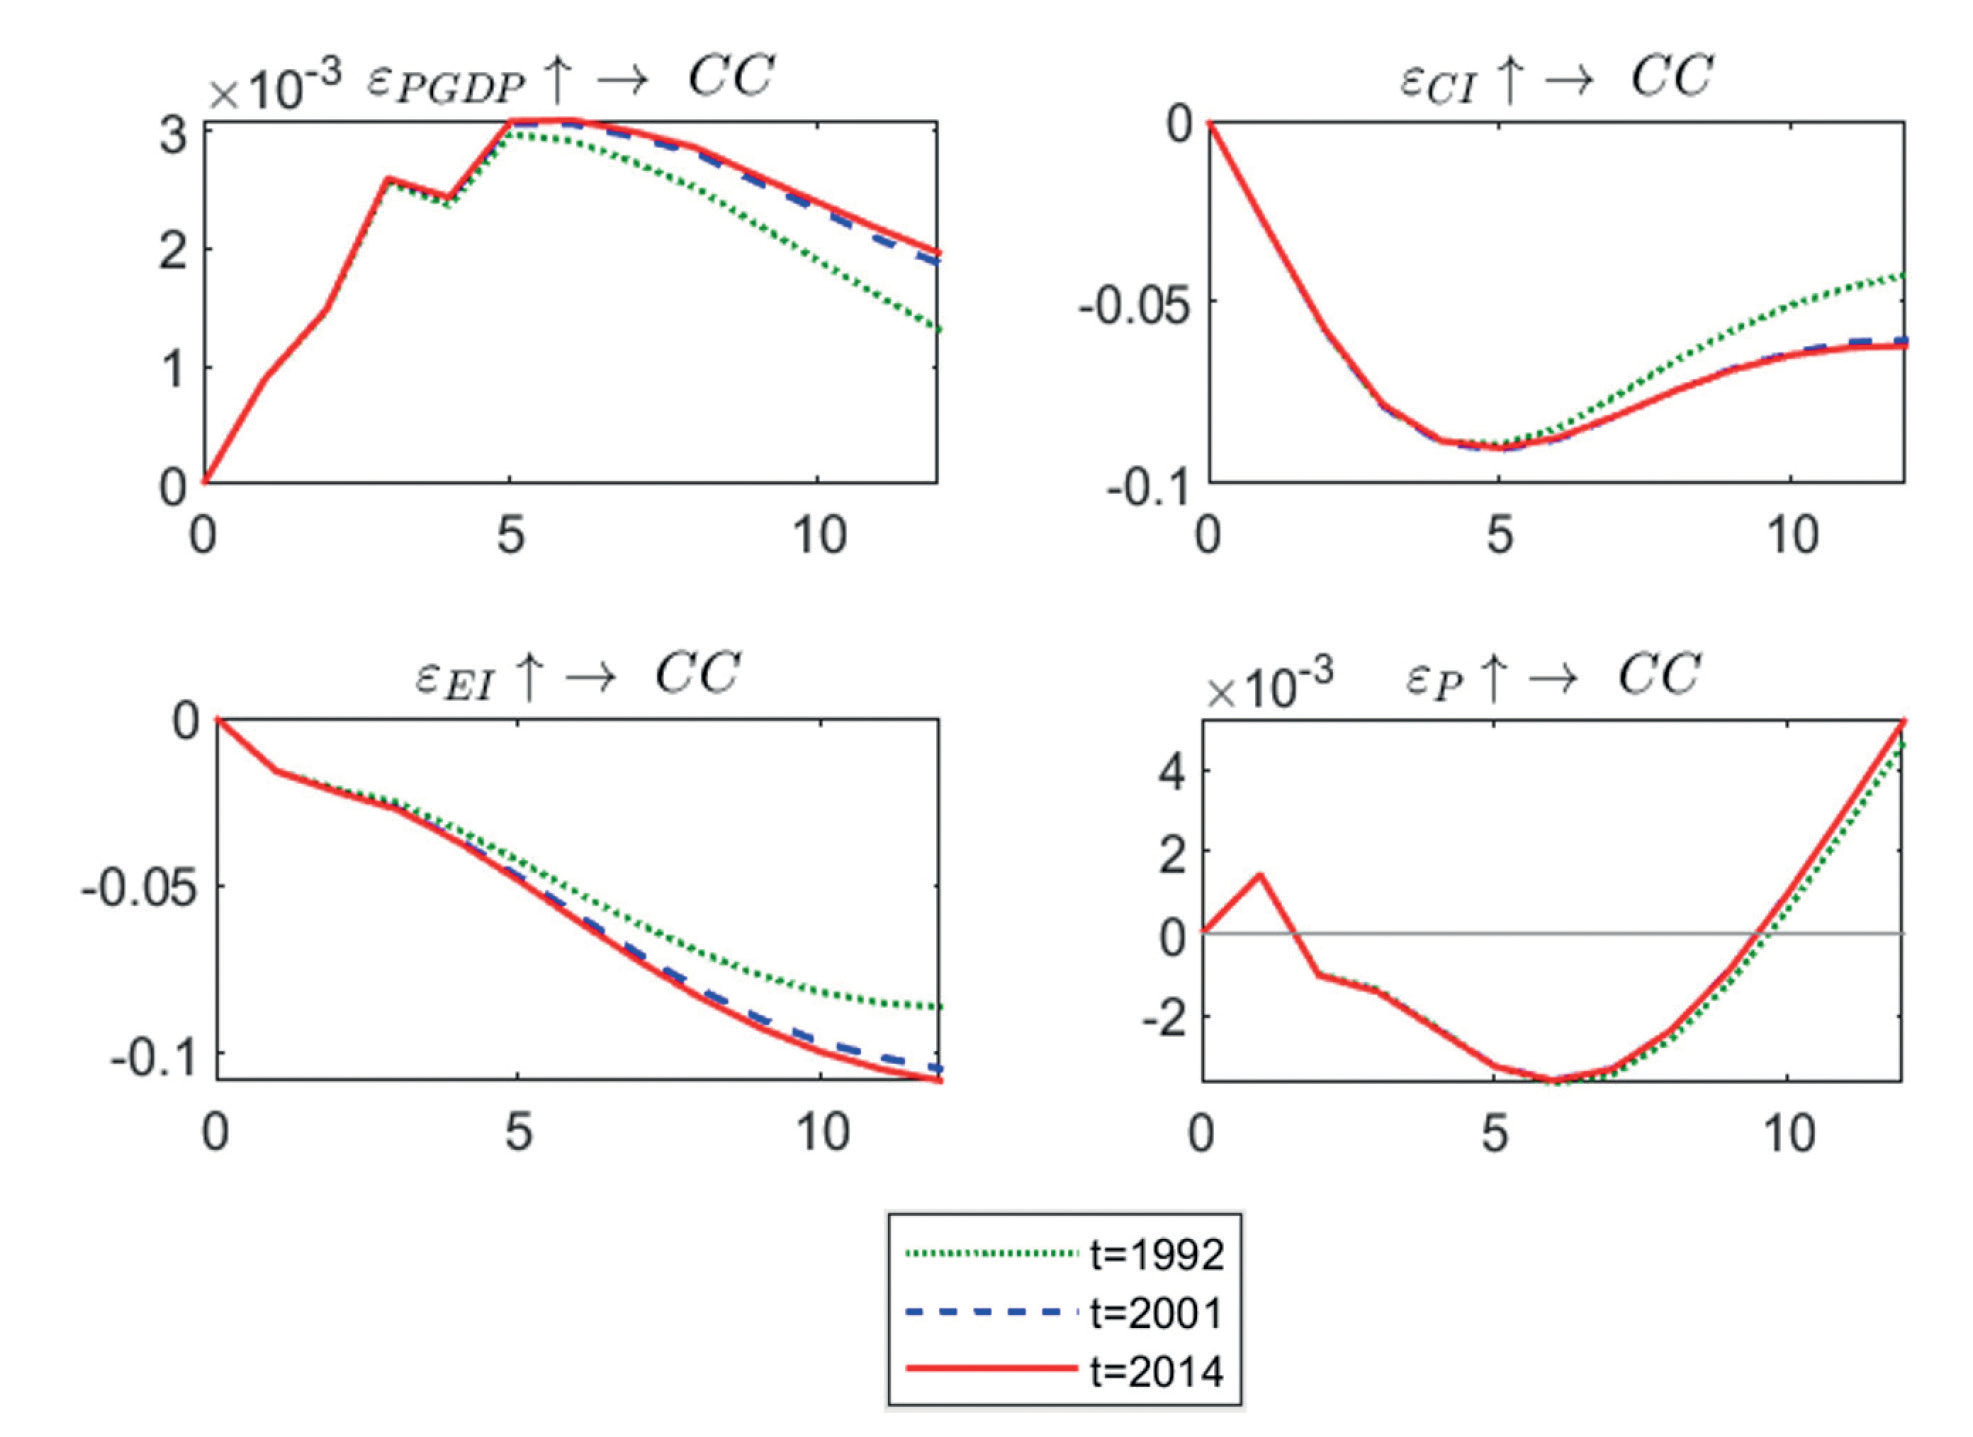
Analyzing the effects of CO2 emissions themselves as shown in Fig. 5, an increase in CO2 emissions will have a positive impact on economic development and population growth in Hubei. CO2 emissions are often accompanied by an increase in energy consumption, which implies a phase of rapid industrialization and urbanization, and signifies continued economic growth. The results of the positive impact of carbon emissions on the economy aptly reflect the transition phase in Hubei Province’s industrial economy, from extensive growth to industrial structure optimization and upgrading, and then to the search for low-carbon transformation development. The increase in carbon emissions brought about by extensive growth may have a positive impact on the economy in the short term, but in the long term, this growth model is unsustainable and the impact is bound to weaken. Instead, the upgrading of industrial structure and the technological progress and innovation of enterprises forced by the increase in carbon emissions will become a sustained driving force for economic growth. Also of interest is the fact that the positive effect of CO2 emissions on population growth will be stronger in 2001 than in 2014. Our explanation for this is the specificity of Hubei as a populous province in central China and its rich resources for university education. 2001 was a period of rapid development of higher education in China, and the establishment and development of universities in Hubei province attracted an influx of people. On the other hand, at this time, Hubei Province has steadily attracted a significant influx of migrant rural laborers by adopting the guiding principle of promoting employment and increasing income to develop job opportunities for rural labor. After the establishment of the carbon emissions trading market in 2014, the transition of high-emission industries to low-carbon or clean-energy industries will further increase the demand for low-carbon transformation and upgrading of enterprises, which may lead to a reduction of employment opportunities in certain industries. Simultaneously, the carbon market motivates enterprises to invest in high-tech research and development, leading to the inflow of high-quality talent from the surrounding area and the outflow of labor force from Hubei engaged in crude-type industries [41].
Variance Decomposition
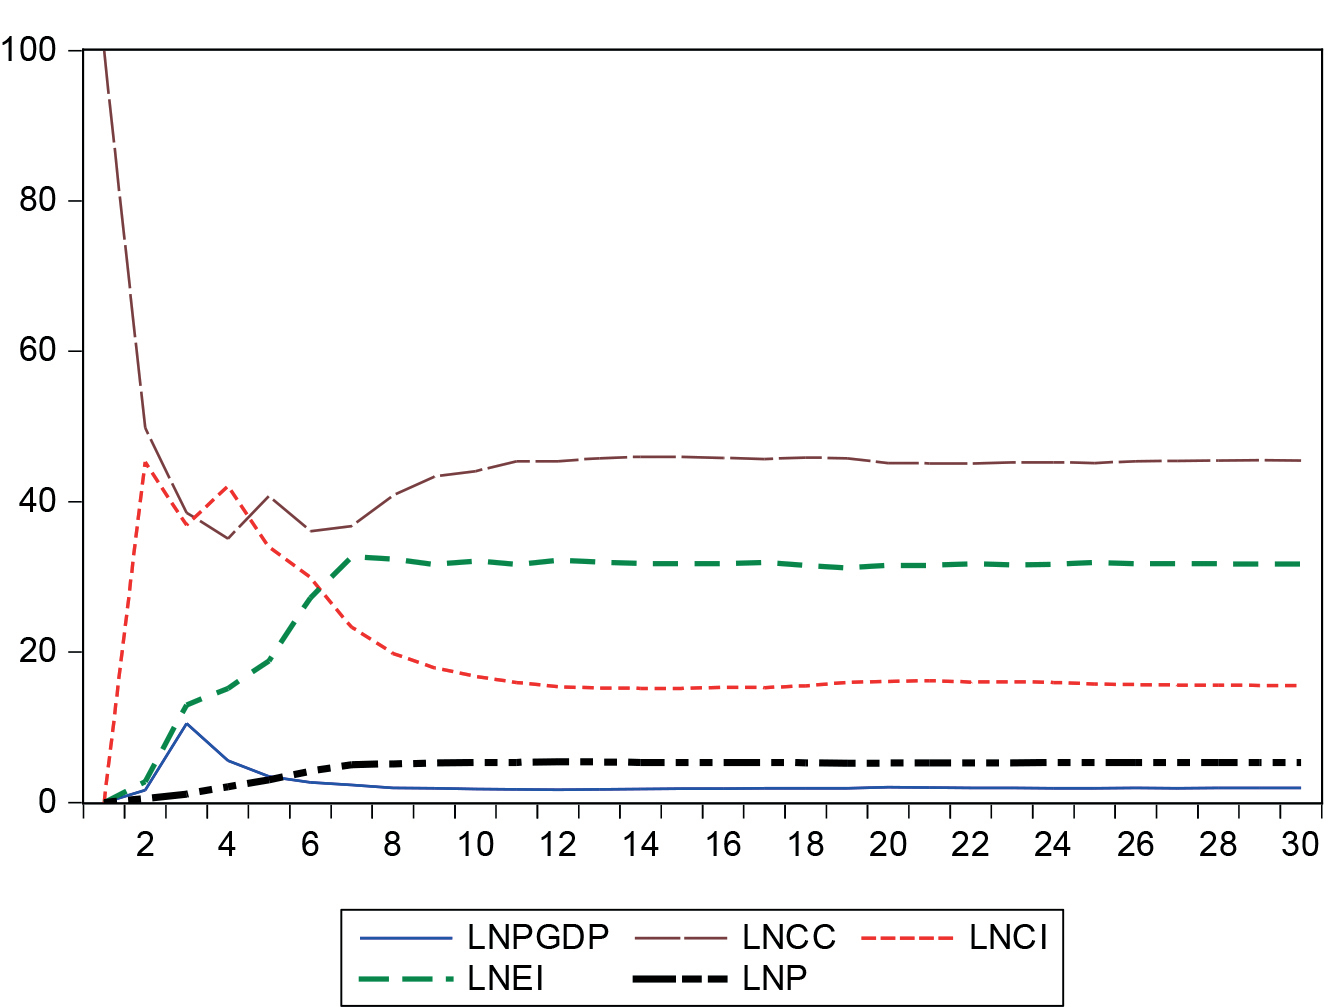
The variance decomposition focuses on calculating the proportion of the sum of variances of structural shocks to the total variance of each endogenous variable at different horizons to measure the impact of structural shocks on endogenous variables, which can more specifically represent the importance of the interaction of endogenous variables. It can discriminate the relative importance of each stochastic disturbance affecting the endogenous variables and quantify the contribution of each shock to the change in the endogenous variables. Here, we focus on the contribution of shocks to lnPGDP, lnP, lnEI, and lnCI to lnCC of CO2 emissions. The results are as Fig. 6 follows.
The contribution of CO2 emissions to itself continues to decline, and after a short period of fluctuation, remains at 45% after period 11. Apart from CO2 emissions themselves, CO2 intensity and energy intensity make the largest contribution to the change in CO2 emissions, with CO2 intensity rising for a short period before declining and stabilizing at around 17% from period 9. The contribution rate of energy intensity reaches a maximum of 32.68% at a lag of 7 and remains at 31% for subsequent lags, indicating that it has a significant long-term impact. As a former industrial base in China, Hubei has a good industrialization base and a deep foundation, which is an important reason why carbon and energy intensity are the main CO2 emissions contributors in Hubei. Although Hubei has attempted many measures for the transformation and development of industrial and economic structures, such as building a world-class new industry leader, “Optics Valley of China”, based on optoelectronic information technology, which has initially appeared to have an impact on the world. Furthermore, the Hubei government has introduced policy measures, including tax and fee reductions, project funding support, and technological innovation support, to encourage enterprises to increase technological innovation and facilitate the growth of low-carbon industries. There is also a carbon emissions trading market with Hubei characteristics that plays a role in driving corporate emission reductions and encouraging enterprises to adopt more energy-saving and emission-reduction measures. However, the current energy structure has not yet fully realized the transition, clean technology and more efficient production methods have not yet been fully promoted, and the inflection point of the Kuznets curve has not yet arrived. Once the issues hindering the implementation of the CO2 intensity and energy intensity control degree have been resolved, the reduction in CO2 emissions will become more obvious. It also requires more effective and targeted environmental regulatory policies and measures. The results also indicate the economic development level and population have a smaller contribution to CO2 emissions, which differs from some of the conclusions reached in previous studies using typical countries and regions as samples. For example, factors of the innovation economy in developed countries, represented by the OECD, have become major contributors to CO2 emissions [42]. While energy growth remains the primary driver of CO2 emissions in the countries represented by the E7, there are also significant differences in the relationship between economic growth and carbon emissions within the E7 countries [43]. In eastern China, the relationship between economic growth, talent aggregation, and CO2 emissions is more significant [44]. This paper analyzes that reason is closely related to the level of economic development and urbanization in the Hubei province. As an important province in central China, despite its strategic position, Hubei’s economic development still lags significantly behind that of the eastern seaboard. The current stage of Hubei’s economic growth implies that the impact of carbon emissions generated by the economy and population is relatively lower.
With the above variance decomposition analysis, the results that the relationship between energy consumption, economic progress, and CO2 emissions varies across countries and regions has been reconfirmed [15], it also clarifies the meaning of studying the case of regional carbon emission impact factors. In the current era of global low-carbon transition and development, each country and region needs to differentiate emission reduction paths, taking into full account regional differences, but also giving full consideration to the flexible use of multiple emission reduction modes. Contributing “China power” to the development of global low-carbon transition, and contributing “Hubei power” to the realization of “dual-carbon” goals are the contributions that the findings of this paper hope to make.
Conclusions
This paper utilizes the Kaya constant equation to decompose the influencing factors of CO2 emissions and conducts research based on the TVP-VAR model. By employing cointegration tests, equally spaced impulse response function, variable time point impulse response function, variance decomposition, and other methods, we have empirically investigated the impact of CO2 emissions and key influencing factors. Our analysis elucidates the dynamic transmission mechanisms and yields the following conclusions:
First, CO2 emissions and the main drivers are in a long-term equilibrium of the level of economic development, population size, energy intensity, and CO2 emission intensity. The impact of the level of economic development on CO2 emissions has a long-term positive effect, and the short-term impact effect is significantly higher than the long-term effect. CO2 emission intensity and energy intensity have negative impacts on CO2 emissions, while energy intensity has a short-term negative impact that is smaller than the long-term impact, and CO2 emission intensity has a short-term negative impact that is larger than the long-term impact. The dynamic emission reduction effects of the above two are the key points to the policy impact, with the strongest effect observed in 2014, indicating that the carbon emissions trading market has formed and sustained an emission reduction effect, and the empirical results further confirm the feedback effect of benign interaction has been formed between the CO2 emission influencing factors in Hubei Province. Finally, the results from the variance decomposition analysis show that energy intensity and CO2 emission intensity have the largest contribution to the change of CO2 emissions, and CO2 emission intensity has an important link with the energy structure, which can be deduced that energy intensity and energy structure are the important drivers of the change of CO2 emissions in Hubei Province.
In view of the “dual-carbon” goal, this paper puts forward measures and recommendations for promoting the transformation and upgrading of the industrial economy of Hubei Province by delving into the factor decomposition affecting carbon emissions and the dynamic transmission mechanism, with a focus on two pivotal aspects: establishing a clean energy system and advancing the construction of a carbon trading market.
The important impact of energy intensity and energy structure on carbon emissions in Hubei determines that the government must do a good job of dual-control mechanisms for energy intensity and total energy consumption. On the one hand, we need to establish a stable, safe, economic clean energy industry system, through the transformation of energy structure, to realize the reduction of energy intensity and total energy consumption. Through vigorously strengthening independent innovation, practically improving energy conservation and emission reduction, actively promoting the integration of industrialization and informatization, and the convergence of advanced manufacturing with productive services, we can accelerate the cultivation of market entities, adhering in intensive, clustered, and grouped development, and endeavoring to build a competitive modern industrial system. It is imperative to accelerate the promotion of new industrialization and to constantly improve the overall strength and competitiveness of industry. This will facilitate the rapid and beneficial development of the industrial economy. Furthermore, it is crucial to promote the larger industrial province to the strong industrial province, in order to establish an important strategic pivot that will facilitate the rise of the central region and provide the primary support [45].
On the other hand, the results of the empirical analysis of the key time points show that the carbon trading market has significantly increased the dynamic emission reduction shock effect, which makes it necessary to promote the construction of the carbon trading market. Hubei Province in recent years has developed into China’s largest carbon emissions trading market, but also the only pilot province in central China for carbon trading. According to the actual situation in Hubei, the scientific allocation of carbon quota targets to each region, each industry, each enterprise. It focuses on promoting technological reforms in large energy-consuming industries such as coal, oil, natural gas, and electric power in Hubei Province, giving full play to the market mechanism, and promoting changes in the way energy is produced and utilized [46]. Further quota allocations from the carbon quota management mechanism to enterprises should focus on enterprises with higher contributions to the gross economic product (GEP) [47], to promote further rises in the GEP of these enterprises, so as to reach an early stage of generating output levels that stabilize CO2 emissions. While the construction of a unified national carbon market is still in its infancy, Hubei, as a pilot region, has formed a research sample of carbon market data to summarize the effectiveness of the policy, to provide the experience of Hubei, and to explore the virtuous circle relationship between the impact of a unified national carbon market on economic growth, industrial structure, and energy consumption, which has a basis to follow.
Although this study provides a new perspective for understanding the complex dynamics of regional carbon emissions, there are still limitations. This study examines the dynamic transmission effects of regional carbon emission influencing factors at key time points through annual data, and in the future, given the strengths of high-frequency data, we will also try to introduce them into related studies to obtain richer results. Additionally, this study introduces the TVP-VAR model to further demonstrate the policy dynamic emission reduction effect formed following the establishment of the carbon emissions trading market in Hubei Province. The impact of specific carbon market trading mechanisms, such as carbon price and carbon quota, should be considered in follow-up research, which requires extending the existing study by combining new models. Certainly, our research should not be confined merely to typical case provinces in China. To enhance the applicability of our findings and to better highlight a global perspective, future studies should endeavor to delve into the diversity and complexities across different regions.

