

Introduction
In recent years, the problem of eutrophication in shallow lakes has become increasingly serious, and frequent outbreaks of cyanobacterial blooms are more frequent [1-4]. Outbreaks of cyanobacterial blooms not only cause water quality deterioration but also produce algal toxins that pose serious health risks to aquatic organisms and humans [5, 6]. Although the management of cyanobacterial blooms in eutrophic lakes has achieved good results in recent years, the global eutrophic lakes still face the hazard of cyanobacterial blooms, because the real growth kinetics of cyanobacterial populations are still unclear. In other words, despite the improvement in water quality, the annual cyanobacterial bloom trend has not been fundamentally reversed. M. aeruginosa is one of the most dominant species of common cyanobacteria due to its biomass and frequency of occurrence [7-9]. It is important to investigate the growth kinetics of M. aeruginosa to aid in the prevention and control of cyanobacterial bloom [10, 11].
However, the monitoring time span and frequency of the studies related to M. aeruginosa are low, and the sampling and data analyses take days as the minimum time unit, which makes it difficult to reveal the growth pattern clearly [12]. While M. aeruginosa can renew one generation in approximately three days, it is difficult to control its real growth dynamics with too large of a span of monitoring time. In addition, the time frequencies used in current cyanobacterial growth kinetic models are mainly based on days, focusing on the growth of cyanobacteria on long time scales [13]. Cyanobacterial growth on long time scales only reflects the cyclical and macroscopic growth patterns of cyanobacteria. In this case, the real growth pattern of cyanobacteria is difficult to capture effectively, and many key growth nodes are easy to be ignored. Meanwhile, cyanobacteria can use circadian rhythms to regulate their metabolism and may sense multiple environmental cues to adapt and change their environment [14]. Therefore, it is important to explore the diurnal growth pattern of cyanobacteria for cyanobacterial water bloom control. For example, Bryan et al. [15] explored the effects of photoperiod on the growth of algae and cyanobacteria and explored the coping strategies of cyanobacteria subjected to light-dark environmental transitions. However, affected by the time scale, these studies did not explore the full cycle of algal life, while lacking a comprehensive consideration of algal growth stages. Therefore, the diurnal growth pattern of cyanobacteria on long time scales is still unclear and needs to be explored in depth by research.
The long time scale of algal growth pattern studies and the lack of applicability of the constructed algal growth kinetic models in different environments have limited the extent of their application. In terms of single-species logistic models, although it was often applied in studies related to algal growth simulation and prediction, the results of fitting algae using single population logistic models in different studies are variable [16]. Influenced by the low frequency of data monitoring, the common population growth models reveal activities throughout the life cycle of the algae, but they are not applicable under certain conditions. For example, Huang and Kong [17] found that although M. aeruginosa growth conforms to the logistic growth curve to a certain extent, fish food and atrazine had a greater effect on the K-value and environmental accommodation in the logistic model of M. aeruginosa. At the same time, the parameters (K-value, proliferation rate) of the single-species logistic model and the division of growth stages are obtained by fitting based on algal growth. This model is susceptible to environmental parameters, such as light, disturbance, and pH, which can lead to poor fitting specifically for algae occurring in natural water bodies. Many field experiments with cyanobacteria have been designed and many research methods have been applied [18, 19], but field culture experiments are affected by many external environmental factors, and it is challenging to study the growth potential and patterns of cyanobacteria. Therefore, enhancing the frequency of data monitoring during the growth of algae, delineating the growth stages of algae from a more microscopic perspective, and constructing a growth kinetic model that is more scientific, are of great significance in revealing the mechanisms of cyanobacterial bloom outbreaks in the natural environment.
To reveal the growth kinetics of cyanobacteria more clearly, an indoor high-frequency monitoring experiment was designed for this study. In this study, the growth trend of M. aeruginosa, the dominant cyanobacterial species in lakes, was followed in real time. Meanwhile, the growth mechanism of M. aeruginosa under alternating light and dark environments was explored in the context of high frequency data, and a new three-stage growth pattern of M. aeruginosa was discovered. The data frequency of high frequency monitoring experiment designed in this study can reach 15 min/time, which not only breaks the barrier of large time span of monitoring data, but also systematically reveals the whole growth cycle and growth limit of M. aeruginosa. In addition, a three-stage growth law was proposed combining the growth trend of M. aeruginosa under light and dark exchange environment, and the environmental driving mechanism of the three-stage growth law was explored. This study is sufficiently theoretical and innovative to provide new ideas for the prevention, control, and early warning of cyanobacterial blooms.
Material and Methods
Experimental Materials
The M. aeruginosa (FACHB-912 unicellular line) isolated from the cyanobacterial population of Lake Tai (the third-largest freshwater lake in China) was used in this experiment. The M. aeruginosa were inoculated with BG11 medium in a sterile environment and then cultured in a light incubator (LRH-150). The temperature in the incubator was 25ºC, the light-dark ratio was 1:1, and the light intensity was 2400 Lux. The glassware was rinsed with water, soaked in 0.1 mol/L dilute hydrochloric acid, rinsed with sterile water, dried, and autoclaved. The overall experiment was carried out on a sterile bench.
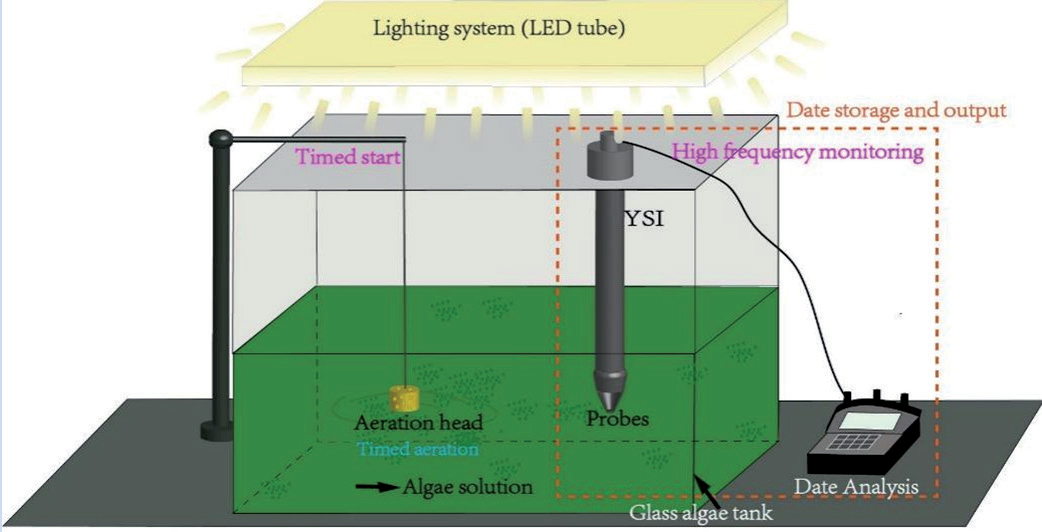
The experimental equipment included a sterile glass incubator, white light color temperature LED lamp, aeration pump, YSI-DSSpro water quality analyzer, and based on this equipment formed a high-frequency culture monitoring device (Fig. 1). YSI-DSSpro is an improved high-frequency water quality analyzer, which can monitor pH, DO, chla, Cond, and other growth indicators of M. aeruginosa at a high-frequency condition. The suitable light conditions and Oxygen conditions for the proliferation of M. aeruginosa. can be provided by the LED lamp and aeration pump. The high frequency culture monitoring device enables both automatic and high survival rate culture work of M. aeruginosa and high frequency monitoring of pH, DO, chla, Cond. In addition, the monitoring data were regularly transferred to a server for storage.
Experimental Method
The M. aeruginosa used in this study were incubated in a light incubator for a short cycle and then used for high-frequency experiments. The M. aeruginosa were mixed and transferred to a sterile glass incubator with the initial chla set at 40 μg/L.
The aeration pump, high-frequency water quality analyzer, LED lamp, and other equipment were turned on after the start of the high-frequency culture experiment and a fixed opening time was set. The monitoring frequency was set to 15 min/time and the aeration times were set at 3:00 a.m., 10:00 a.m., 15:00 p.m., and 22:00 p.m., with each aeration lasting 20 minutes. The light source was turned on at 8:00 a.m. and turned off at 20:00 p.m. The time of aeration and light on/off is fixed every day. The data of the high-frequency culture experiment were initially stored in the high-frequency water quality analyzer and then regularly transmitted to a computer to monitor the growth condition of M. aeruginosa and for further analysis.
Data Analysis
To improve the accuracy and reliability of the data of high -frequency monitoring results, this study used a wavelet transform with adaptive characteristics to remove the noise from the data. A wavelet transform can achieve noise reduction while retaining valid information and ensure the reliability and continuity of pH, DO, Cond, and chla data as much as possible. A wavelet transform can also decompose the time series by different resolutions and decompose the original signal into sub-signals of different frequencies, so that the timing profile and detailed parts of the original signal can be easily identified [20, 21]. Therefore, this type of analysis is appropriate for the continuous processing and cleaning of the data from these culture experiments. The wavelet transform used in this study consisted of the following three processing steps.
(1) Wavelet decomposition: The best wavelet function was selected to decompose the noise signal according to the data characteristics of different variables, the orthogonal wavelet was used for the data x(t), and then the wavelet decomposition coefficients of the l-layer k points were calculated as follows.
where l is the number of wavelet decomposition layers; r = 0, 1, 2, ..., 2l -1 is the number of nodes under the corresponding layers; 0, 1, 2, ..., 2l is the kth node of the jth layer.
(2) Threshold quantization: The appropriate threshold for the high-frequency coefficients of each layer after the decomposition was selected and the global threshold was used in this study.
(3) Wavelet reconstruction: Wavelet reconstruction was performed based on the high-frequency coefficients in layers 1 to N and the low-frequency coefficients in layer N to finally achieve noise reduction. The first equation that performs single-branch reconstruction, Sl+1r(k) is the single-branch reconstruction signal at k points in layer l+1 and the second equation is the total reconstructed signal.
Results and Discussion
Differential Growth of Microcystis aeruginosa in Light and Dark Environment
As shown in Fig. 2a), under indoor culture conditions (populations with stable age structure, unrestricted food and space, and only intraspecific competition), a complete culture cycle of copper green microcysts is about 80 days. From the whole life cycle of M. aeruginosa, the growth of M. aeruginosa was characterized by chla concentration with a growth limit of about 110-120 µg/L (about 2.4x10⁶ million units/L), and the maximum growth rate point appeared on the 23rd day of culture with a maximum value-added rate of about 1.04x10⁵ units/day. The culture period, growth limit and maximum value-added rate points of M. aeruginosa obtained from this experiment are of great significance and can provide theoretical support for the precise control of cyanobacterial population and actual cyanobacterial salvage.
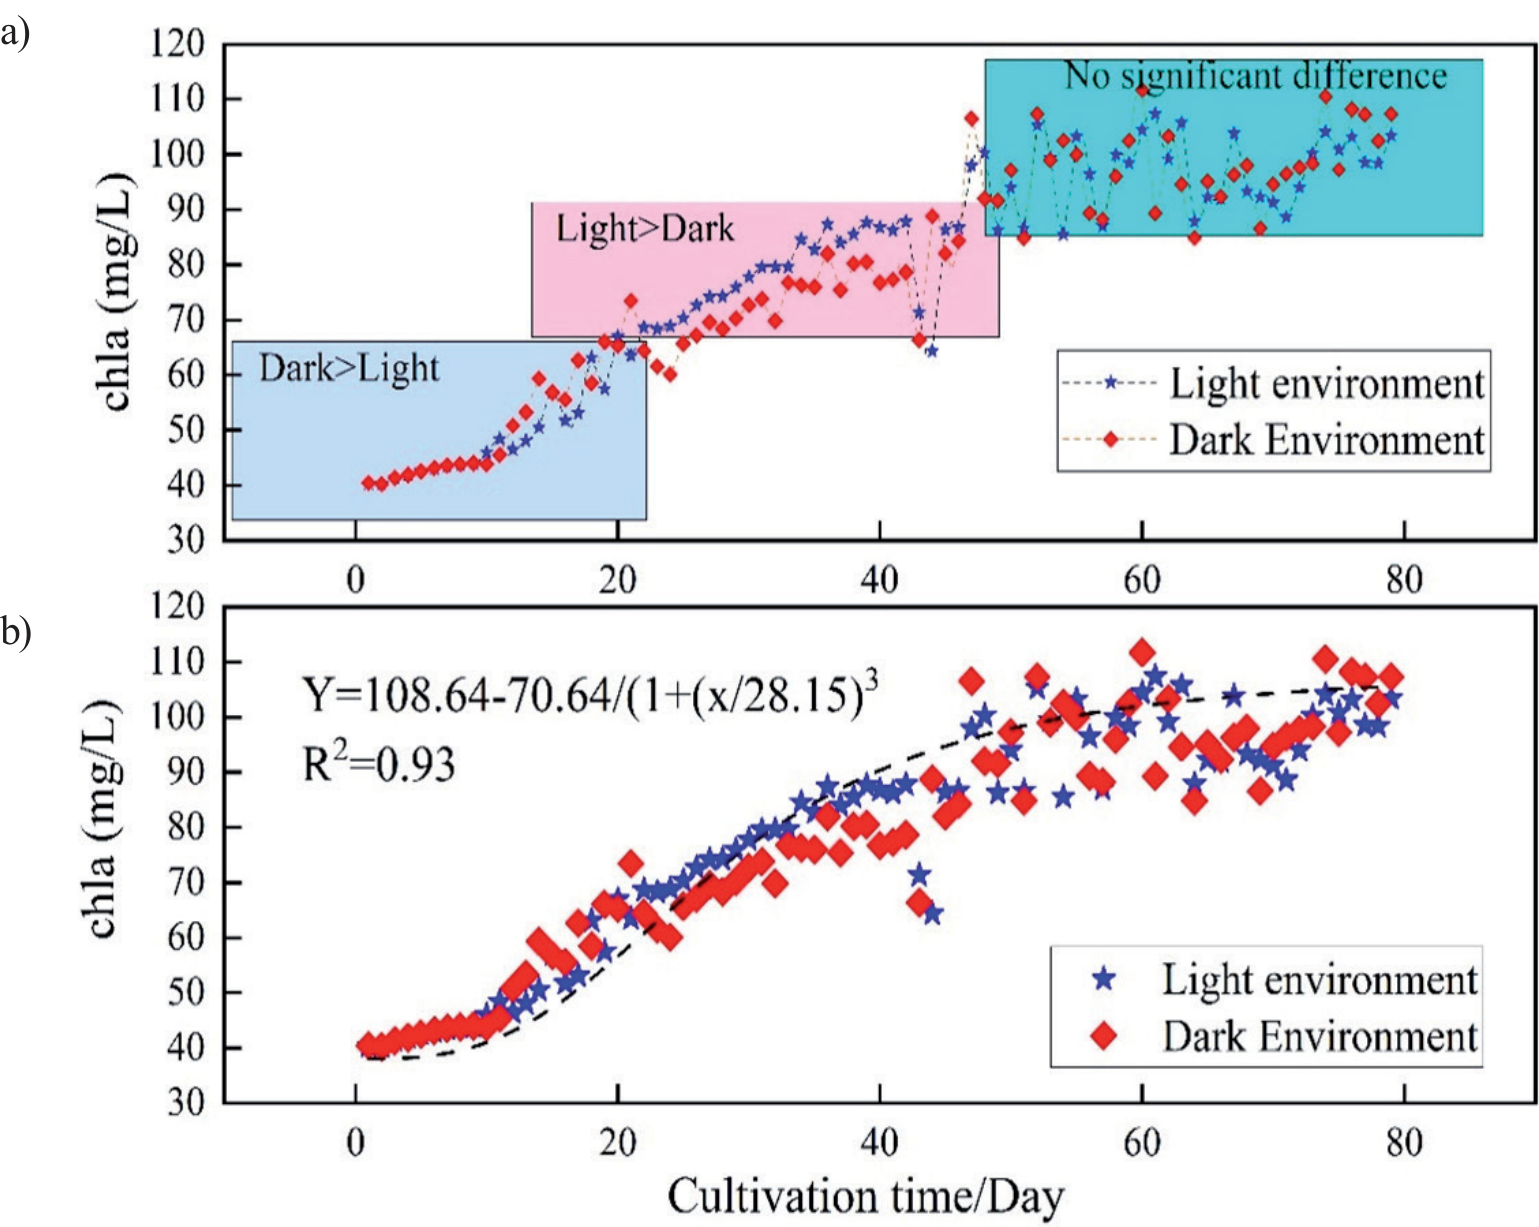
From the light and dark environment, there was significant variability in the growth of M. aeruginosa (Fig. 2a). From day 0 to 20 of the experiment, the chla concentrations of the cyanobacteria in the dark environment was higher than in the light environment. From day 20 to 45 of the experiment, the chla concentration in the light environment was gradually higher than that in the dark condition. From day 45 to 80, the chla concentrations in the light environment was similar to the dark environment. A logistic model to the different growth trends of M. aeruginosa during the light and dark environment was fitted (Fig. 2b). The results demonstrated that M. aeruginosa growth in both dark and light environments was consistent with logistic growth. The R2 reached above 0.93 and the fitting results were good. This shows that the overall growth is consistent with Logistic growth.
Discovery of Three-Stage Growth Pattern
Depending on the proliferation rate of M. aeruginosa under light and dark conditions (Fig. 3), the growth phase under indoor culture conditions can be divided into three stages. The three different stages are Light adaptation period (LAP), Logarithmic growth period (LGP) and Stabilization period (SP). The LAP represents the stage in which the chla concentration was higher in the dark than the light condition in the early stage of culture. The LGP represents the stage in which the chla concentrations in the light was higher than that in the dark environment in the middle stage of culture, and the growth of M. aeruginosa was logarithmic during this period. For the SP stage, the mean chla concentrations were similar during day and night, and the proliferation rate decreased and gradually tended to 0. The proliferation rate of M. aeruginosa at these three growth stages was different. The M. aeruginosa proliferation rate fluctuated from high to low in the culture cycle, with the slow proliferation of the cyanobacteria at the beginning, an accelerated proliferation rate in the middle, and dynamic equilibrium in the growth at the end of the culture period.
The different growth periods of M. aeruginosa were classified according to the fitting results (Table 1). The results showed that the three growth stages overlapped to some extent with the four logistic stages (start-up, accelerated growth, decelerated, and stabilization periods). The chla concentration was higher under the dark compared to the light conditions during the start-up and accelerated growth period. The chla concentration was lower under the dark compared to the light conditions during the pre-mid decelerated growth period. Finally, the chla concentration was similar under dark and light conditions during the end of the decelerated growth and stabilization periods. The shorter duration of the onset and accelerated growth periods of M. aeruginosa were related to the initial density of M. aeruginosa selected in this study. The initial value of the chla concentrations of M. aeruginosa was about 40 μg/L. Since the initial value of the algal density was high, the M. aeruginosa density could reach the k/2 value quickly.
The Driving Mechanism of the Three-Stage Pattern
Trends in chla Concentrations under Alternating Light and Dark Environments
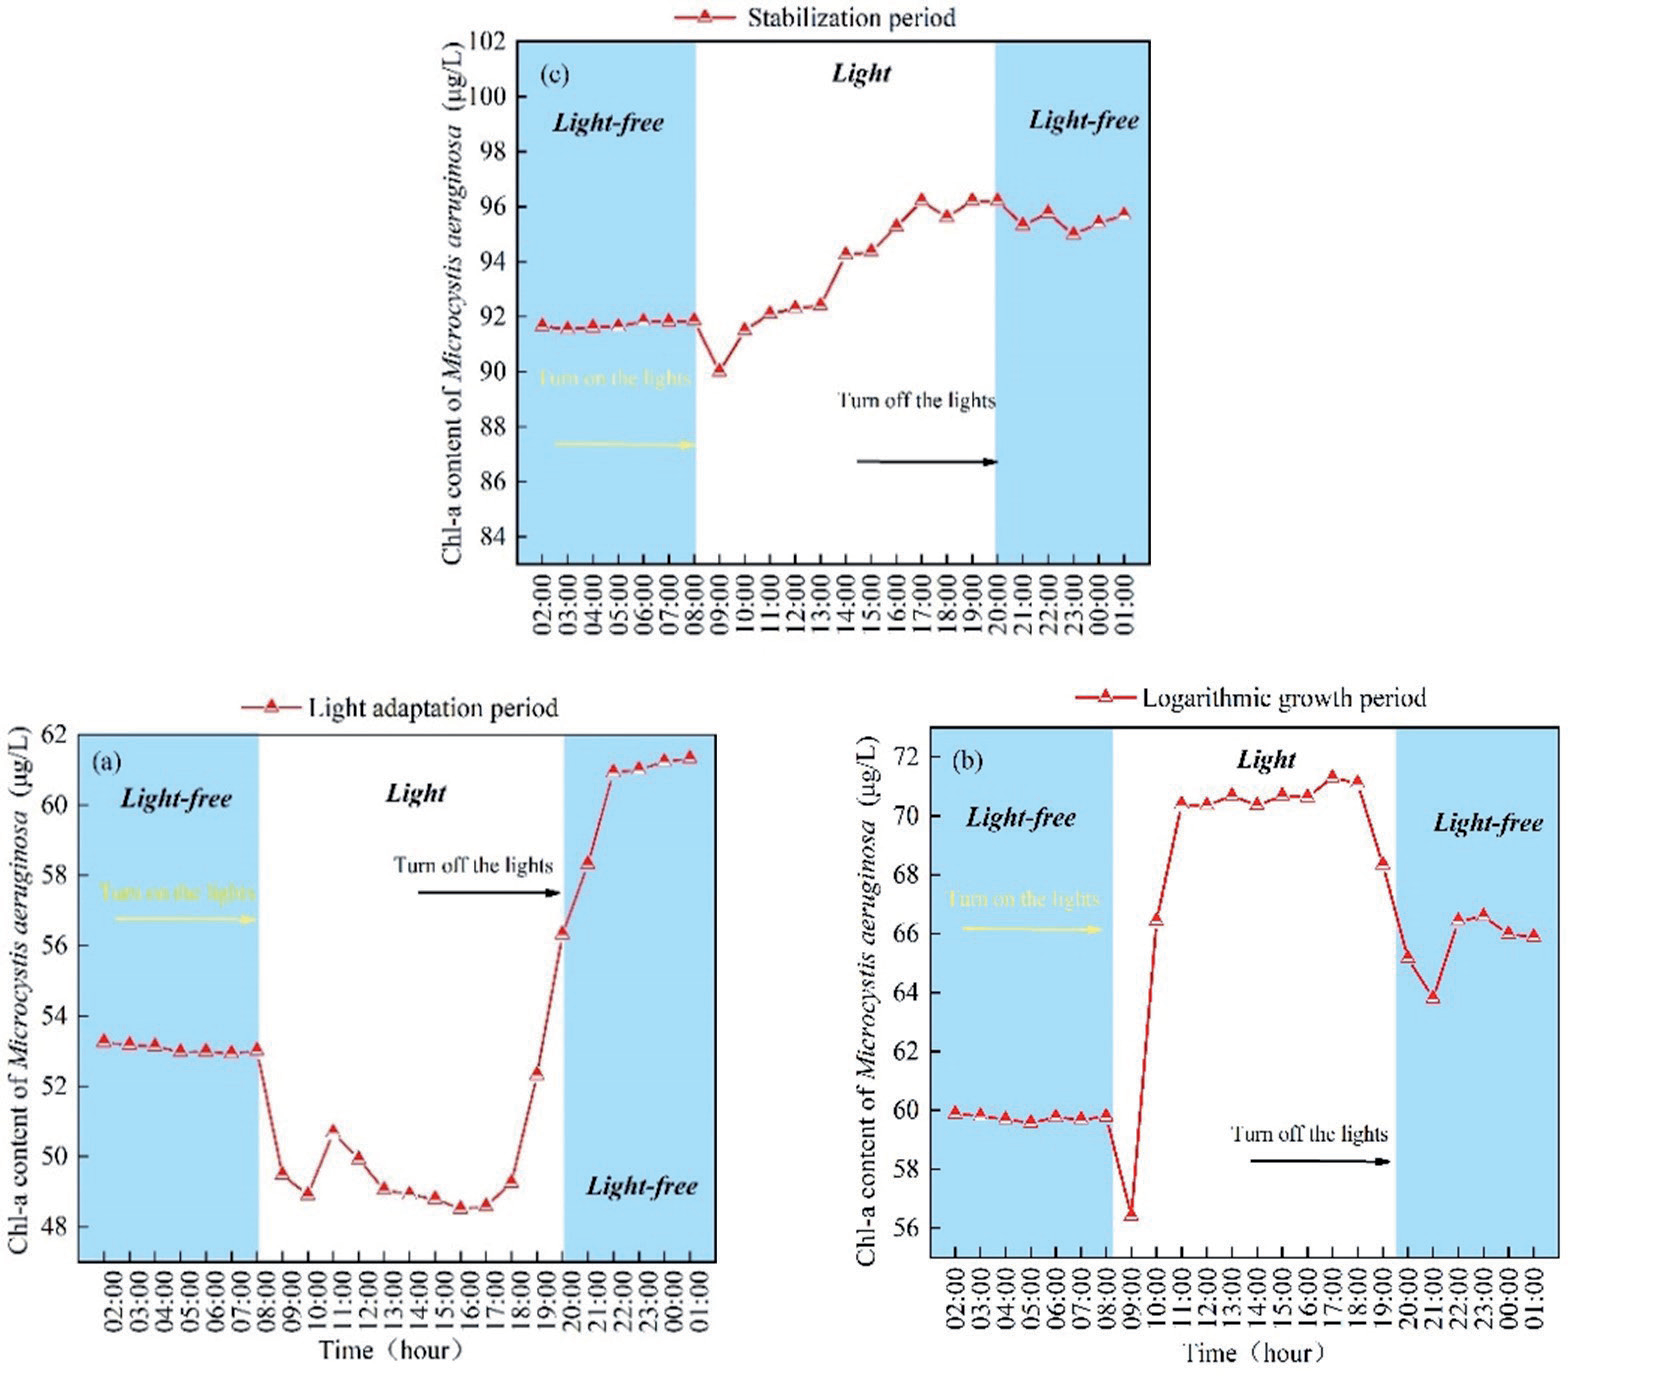
The chla concentrations trends of M. aeruginosa in the light-dark alternating environment in the three stages of LAP, LGP, and SP were highly variable (Fig. 4). As expected, the LAP showed an opposite trend to the LGP. The chla concentrations in the LAP showed an initially decreasing and then increasing trend after the light was turned on. However, the chla concentrations first increased and finally stabilized after the light was turned off. In contrast, the chla concentrations in the LGP showed a trend of rapid increase after the light was turned on and a significant decrease followed by a small increase after the light was turned off. This was the superficial reason why the chla concentrations in the dark environment were lower than in the light during the LAP. The trend of chla concentrations was not obvious after turning the light on and off during the SP. The diurnal chla concentrations of M. aeruginosa during the SP were the same, although displaying fluctuations related to the density of the initial cyanobacterial culture. The small degree of disturbance that can lead to substantial changes after the algal concentration became high was difficult to avoid.
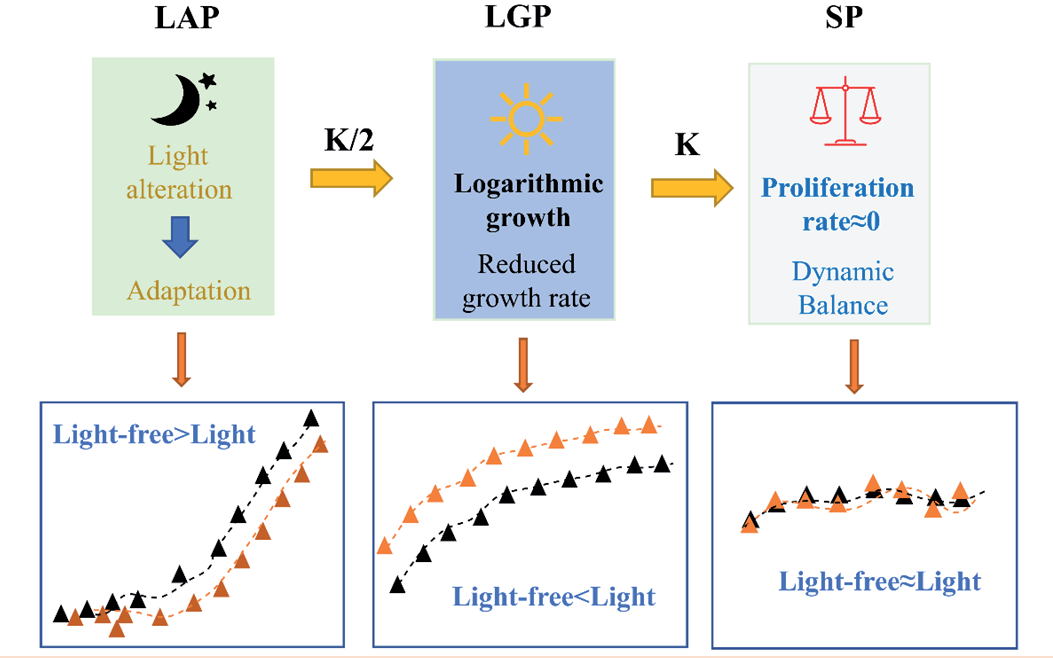
Table 1.
Relationship between fit and the logistic period.
The significant variability of chla concentrations trends in alternating light and dark environments during the LAP and LGP may be related to the existence of an adaptation process (light or competition) during the pre-culture period. When M. aeruginosa was transferred from the light incubator to the sterile glass incubator, a series of adaptation processes to the new environment were required to ensure normal growth and reproduction. In indoor culture conditions, this adaptation process primarily includes the adaptation to light, the degree of intraspecific competition, and other processes. In this study, photoinhibition and photoadaptation processes in M. aeruginosa were observed. The change of light environment produced a kind of photoinhibition of photosynthesis and the growth and reproduction of M. aeruginosa, reducing the photosynthetic activity and resulting in photodamage. Therefore, this may be the intrinsic reason for the higher chla concentrations in the dark compared to the light environment during the LAP. For the intraspecific competition, the population density was low during the LAP and the LGP, and the degree of intraspecific competition was lower than during the SP. The low intensity of the intraspecific competition may facilitate the process of light adaptation, which may have been one of the reasons for the short duration of the LAP. For the SP, the M. aeruginosa population reached the environmental holding capacity (K), the proliferation and decay of M. aeruginosa reached a dynamic equilibrium at this stage, and the net proliferation rate was essentially 0. After the adaptation process of LAP and the LGP, the proliferation rate of the light and dark environments in the SP reached stability. In summary, we suggest that the adaptation mechanism of M. aeruginosa to light and the intensity of intraspecific competition is one of the intrinsic driving mechanisms of the Three-stage growth pattern in indoor culture.
Variability Analysis of Environmental Drivers
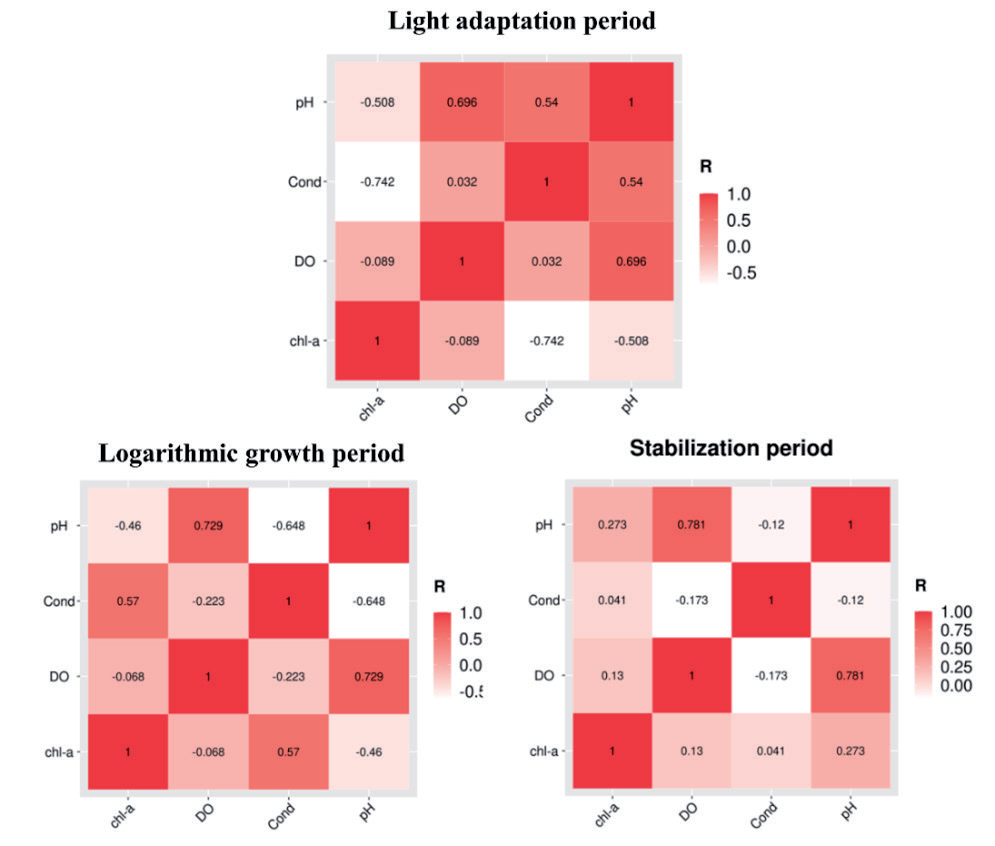
The correlations of different environmental indicators (pH, DO, Cond, and chla) were calculated for three different stages (Fig. 5). The results demonstrated that chla concentrations in the LGP and LAP had a good correlation with Cond and pH. The correlation coefficients of chla with Cond were -0.742 and 0.57 for the LAP and LGP, respectively. The correlation coefficients of chla with pH were -0.508 and -0.46. The correlation of Cond with pH and DO was poor. For the LGP, chla concentrations displayed a negative correlation with Cond, while chla was positively correlated with Cond. Alternatively, the correlation relationship between pH and DO for the three stages was significant, which was related to photosynthesis and respiration of M. aeruginosa.
The differences in the correlation between the environmental factors and chla content at the three stages can partially characterize the differences of the M. aeruginosa proliferation mechanisms. The Cond was closely correlated with the growth of M. aeruginosa during the LGP and LAP. During these two periods, the Cond well-characterized the growth and reproduction of M. aeruginosa. The chla concentrations in the LGP and LAP was associated with faster proliferation, faster increase in algal density, faster uptake of nutrients from the culture medium for life activities, and faster release of metabolic substances to external survival environments. The correlation between chla concentrations and pH, DO, Cond in the SP was poor, which was related to the proliferation state of M. aeruginosa. The proliferation and decay of M. aeruginosa in the Stabilization period reached a dynamic balance, the consumption of nutrients in the medium was accelerated, and the metabolic products were aggregated. The Stabilization period may have been longer because the BG11 medium provided sufficient nutrients for the algae.
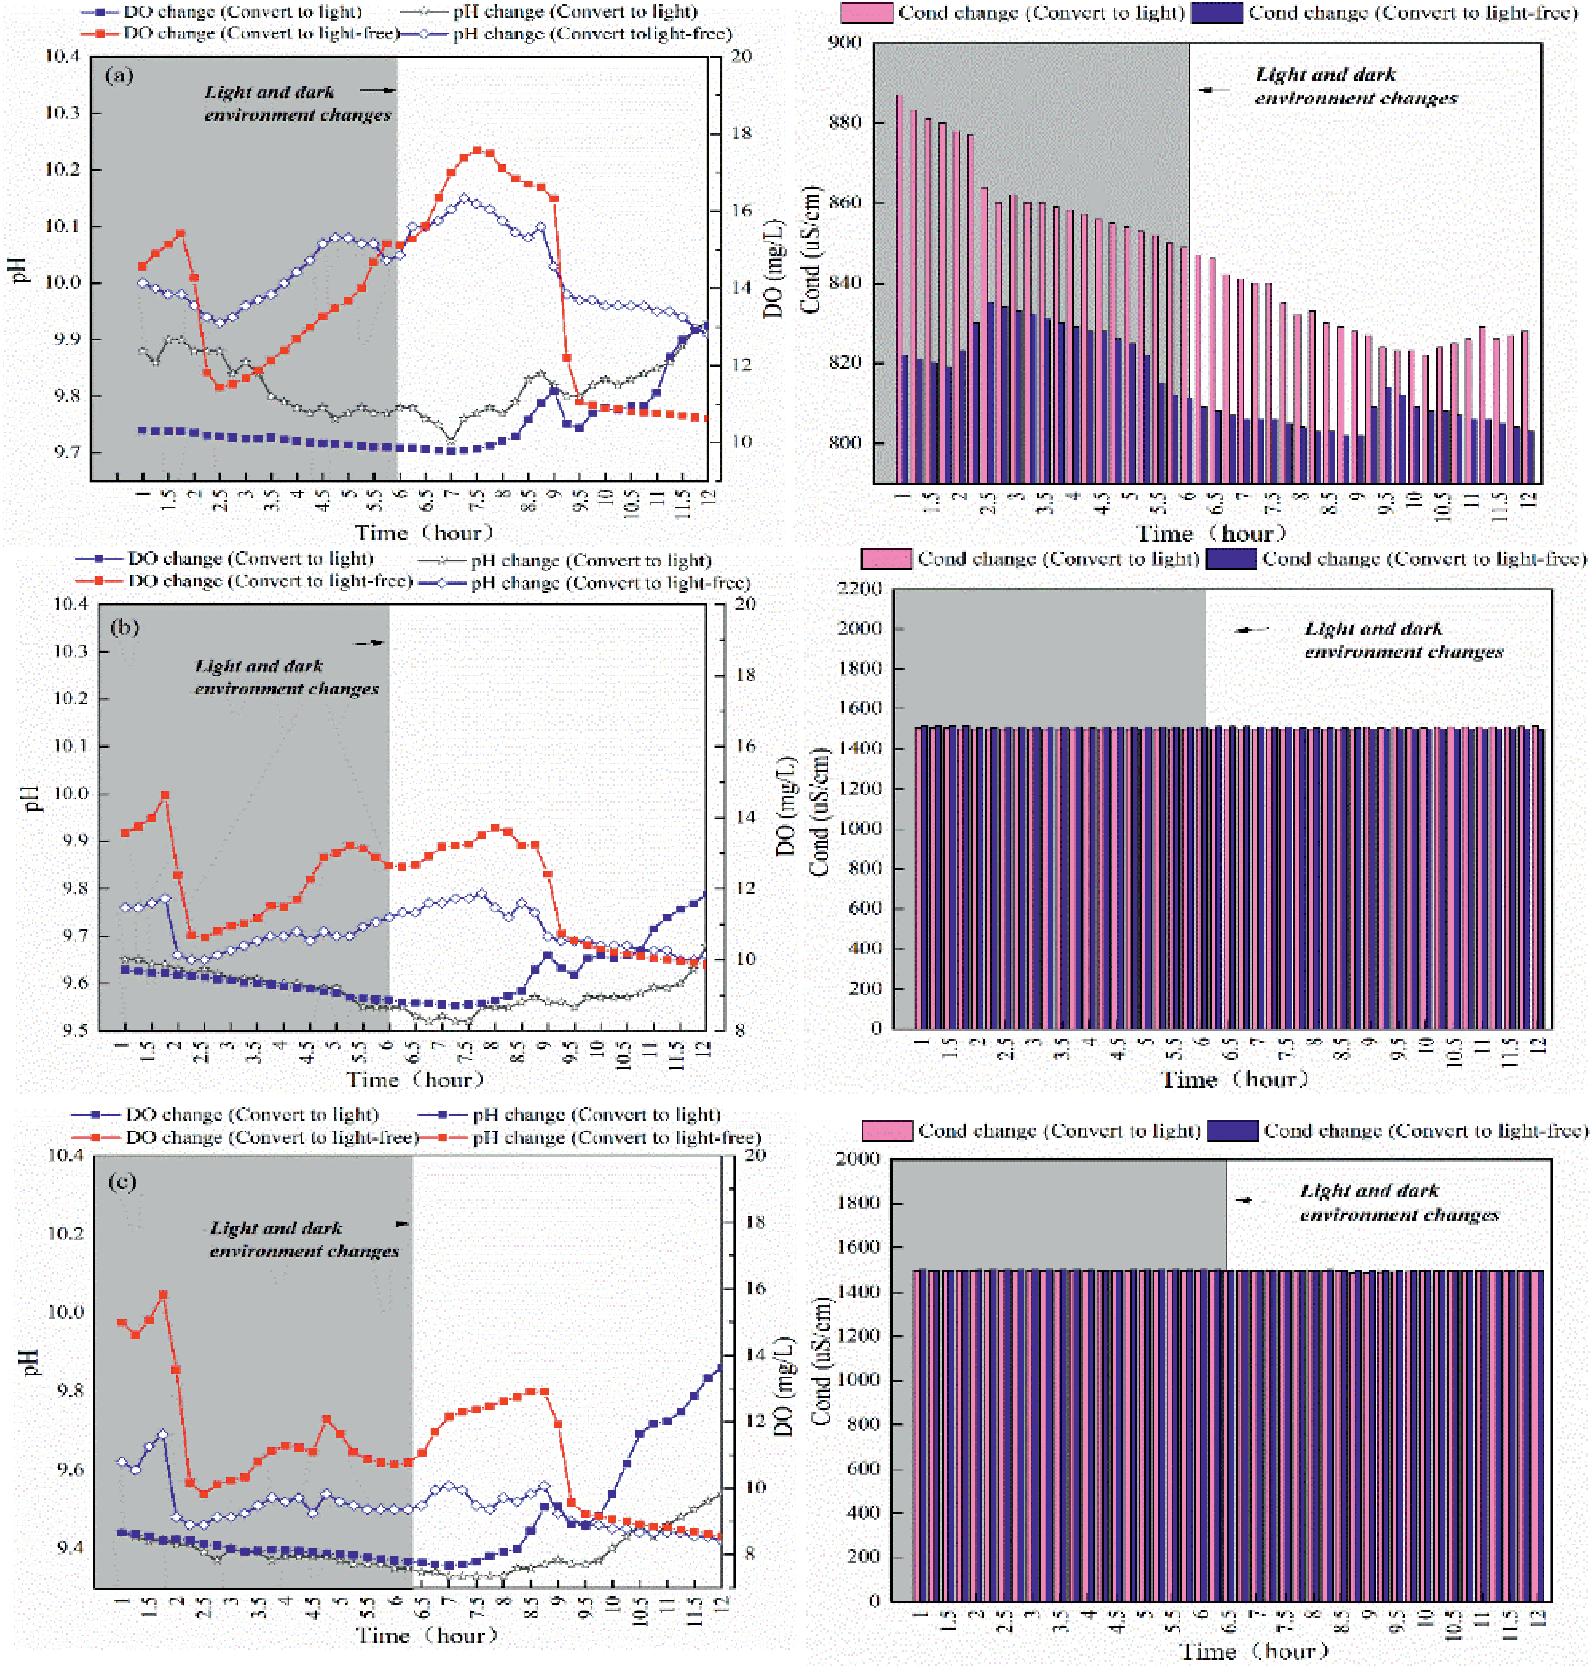
The changes to pH, DO, and Cond were the manifestation of the intrinsic mechanisms of diurnal growth of M. aeruginosa. To further reveal the environmental factors driving the mechanisms of the three growth stages, the diurnal transformation patterns of pH, DO, and Cond at different growth stages were further investigated (Fig. 6). The results demonstrated that the diurnal trends of pH during LAP, LGP, and SP were similar, all showing an increase after the light was turned on and a gradual decrease after it was turned off. However, the pH during the three stages was different, varying following the change of the light conditions. The pH magnitudes were in the following order: LAP>LGP>SP, and the values and magnitudes of the pH changes gradually decreased. The diurnal trend of DO at the different growth stages was similar to the pH diurnal trend, which also increased after the light was turned on and gradually decreased after the light was turned off. The diurnal pattern of Cond varied significantly among the three stages. Cond showed a gradual increase after the light was turned off during the LAP and a substantial decrease after the light was turned off. However, the Cond did not change in the diurnal environment during the SP.
The pH and DO trends can characterize the photosynthesis and respiration processes during M. aeruginosa growth. Under light conditions, M. aeruginosa can photosynthesize and release oxygen by absorbing and using carbon sources in the medium, leading to a decrease in water acidity, a rise in pH and DO. In dark conditions, M. aeruginosa stops photosynthesis and begins respiration, where pH and DO decrease. The high algal activity and strong photosynthesis during the pre-mid culture period were the reasons for the higher pH and DO in the LAP and LGP compared to the SP. The change of Cond can characterize the process of nutrient uptake and metabolite release from the medium by M. aeruginosa. A process of adaptation to the environment during the LAP occurs where sensitivity to environmental changes is enhanced and vital activities are affected, which was the reason for the large changes in Cond during the LAP.
Based on the diurnal patterns of pH, DO, Cond, and chla concentrations, the light environment, photosynthesis, respiration, and intraspecific competition of M. aeruginosa were the driving factors of the Three-stage patterns. Light, nutrient salts, and their interactions were the key factors limiting M. aeruginosa diurnal growth. The LAP contained the adaptation of light as well as competitive conditions to the new environmental adaptation process, during which the growth of M. aeruginosa was primarily affected by light inhibiting the intensity of photosynthesis and initiating photoinhibition. The M. aeruginosa reduced the damage produced via photoinhibition through its light adaptation mechanism, which is an intrinsic mechanism for the above changes in pH and DO. In addition, according to the light-nutrient hypothesis, the growth of M. aeruginosa in the laboratory was influenced by the synergistic effects of light and nutrient salts, rather than by a single factor. Considering that the nutrients such as nitrogen, phosphorus, and carbon in the medium were sufficient to support the vital activities of M. aeruginosa, once the proliferation and decay of M. aeruginosa reached a dynamic equilibrium, the Cond value in the algal solution also reached dynamic equilibrium.
The Exploration of Driving Mechanisms
The diurnal variation of chla concentrations in M. aeruginosa displayed some variability. Based on this variability, we divided M. aeruginosa growth under laboratory conditions into three different stages discovering The Three-stage pattern of growth. An adaptation process to the new environment occurs during the pre-culture phase [22]. When M. aeruginosa was transferred from the light incubator to the high-frequent incubator, the survival environment changed accordingly and the M. aeruginosa needed to adapt to the new environment. Since the temperature and the culture medium were not altered, this adaptation process primarily refers to the adaptation to light and competition after the change of algal density [23, 24]. The effect of this photoinhibition gradually decreased as the proliferation rate of M. aeruginosa increased. Microcystis aeruginosa resumed its normal growth patterns. For example, photosynthesis returned to normal levels under light conditions and the rate of increase in chla was significantly higher, resulting in higher chla than under dark conditions. Finally, M. aeruginosa reached the environmental accommodation and the dynamic balance between proliferation and decay at the end of culture, which was the basis of the discovered Three-stage pattern.
The results show that the light environment and the photosynthesis, respiration, and intraspecific competition conditions of M. aeruginosa were the primary drivers of the Three-stage pattern. Photoprotection was triggered when light conditions changed, specifically under strong light conditions. Microcystis aeruginosa dissipates excess light energy via the 3Chl pathway. When the algae absorb too much light energy, the excess light quantum causes excitation energy to accumulate in the LHC, increasing the lifetime of 1Chl. Through inter-system crossover, a longer-lived 3Chl (ms) is again produced, which can help the diffusion of excess light quanta [25, 26]. The 3Chl processes can efficiently consume light energy. However, it can still cause damage to algal proteins, pigments, and lipids. The process of light adaptation in algae occurs via the generation of drought stress triggering photoprotection. Prolonged and intense light stress leads to Photosynthetic system II (PSII) damage, which decreases photosynthetic activity and reduces the rate of CO2 conversion to O2. This process is associated with damage to algal D1 proteins, loss of PSII reaction center protein photosynthetic activity, and a decrease in quantity, which directly affects the maximum photosynthetic rate [27]. This is the reason for the relatively low chla concentrations in the light-adapted environments during the LAP. In contrast, chla concentrations under light conditions during the LGP was higher than under dark conditions, which is an indication that the algae have adapted to the new environment [28-30]. This time protection mechanism can enable M. aeruginosa to adequately cope with light stress and photodamage. The growth and decay of M. aeruginosa reached a dynamic equilibrium during the SP. The reason for the severe fluctuation changes was the large base of M. aeruginosa density and the effect of other factors, including aeration amplifying the disturbance on M. aeruginosa monitoring.
Comparative Analysis of the Three-Stage Pattern and Logistic Pattern
The Three-stage pattern demonstrated some similarities with the four-stage population logistic theory. Roughly, the cut-off points between the LAP and LGP in the Three-stage pattern and between the accelerated and decelerated growth periods in the logistic four-stage were both the points of maximum population proliferation rate (k/2). In this study, the chla concentrations of M. aeruginosa in the dark was higher than in the light condition until the k/2 point was reached. The chla concentrations began to be higher in the light environment compared to the dark when its content reached the k/2 point. In addition, the end of decelerated growth and the Stabilization periods in the logistic growth curve largely overlapped with the Stabilization period of the three-stage pattern. The Stabilization period in the three-stage hypothesis was similar to the growth characteristics of the Stabilization period in the logistic four-stage theory. During these two Stabilization periods, the rates of proliferation and decay of M. aeruginosa reached dynamic equilibrium, and the chla under light and dark conditions gradually became equal. This indicates that the three-stage pattern was compatible with the logistic four-stage theory and that the logistic four-stage theory can somewhat corroborate the Three-stage pattern.
The Three-stage pattern and the logistic four-stage theory did demonstrate some differences. Firstly, the basis for the division between the Three-stage pattern and the logistic four-stage theory is different. The Logistic pattern is based on different growth rates and environmental capacity (k) throughout the life cycle of M. aeruginosa. In contrast, the Three-stage pattern of growth discovered is based on the high-frequency monitoring of diurnal growth variability, proliferation rate, and environmental accommodation for delineation. Secondly, the data context of the Three-stage pattern differs from the four-stage theory of logistic growth curves. Briefly, the logistic four-stage theory focuses on the proliferation rate of a population throughout its life cycle and the data are analyzed in terms of days only. However, the Three-stage pattern is discovered in the context of high-frequency monitoring data, which can be obtained as often as every 15 min.
The Three-stage pattern can clearly and accurately characterize the growth stages of M. aeruginosa under indoor culture conditions. Firstly, the Three-stage pattern has more high-frequency data to support the division of the growth stages of indoor M. aeruginosa at a more microscopic level of diurnal growth differences. Secondly, although only the Three-stage pattern of M. aeruginosa was classified, these covered the trends of multiple processes including adaptation to a new environment (light, competition, etc.), changes in proliferation rate, and the process of diurnal growth variability. It is therefore advantageous to investigate the indoor culture of M. aeruginosa.
The Three-stage pattern has some compatibility with the logistic four-stage theory. The Three-stage pattern encompasses the ecological features of k and k/2 in the logistic four-stage theory and covers the value-added rate changes of M. aeruginosa throughout its life cycle. The extreme value of the stable stages in the Three-stage pattern is represented by k. The LGP and LAP stage were divided by the maximum accretion rate k/2 point. This division model was compatible with the logistic four-stage theory. Alternatively, the three stages of the Three-stage pattern can accurately describe the changes in the algal proliferation rate throughout their life cycle, including the characteristics of diurnal variability of algae in the high-frequency monitoring background.
Logistic models were widely used in growth simulations and predictions of microbial and algal populations. However, microorganisms and algae that fully conform to the logistic four-stage growth characteristics are easily influenced by environmental factors [31]. The three-stage pattern covers both the ecological characteristics of the logistic four stages and incorporates the characteristics of diurnal variability in the context of high-frequency monitoring including the characteristics of the effects of changes in the culture environment. Only for guiding indoor culture and research of M. aeruginosa, the Three-stage pattern has certain applicability. However, the high-frequency monitoring test in this study also had certain drawbacks. Nutrients such as N, P, and C are key nutrient factors for algal growth. High-frequency monitoring of the nutrients was not included in this study because the nutrients in the BG11 medium used for the culture experiments were sufficient for the growth and proliferation of M. aeruginosa and due to the limitations of current high-frequency monitoring equipment. Therefore, to explain M. aeruginosa growth patterns more accurately and thoroughly, this study utilized the high-frequency monitoring system of added nutrients such as N, P, and C. At the same time, the interpretation of cyanobacterial growth patterns only in laboratory culture experiments has certain limitations for the prevention and prediction of cyanobacterial blooms. Therefore, this study aimed to reveal the growth patterns of cyanobacteria in natural water at a more detailed level, to provide scientific suggestions for the development and improvement of current cyanobacterial water bloom prevention, early warning, and control technologies.
Conclusions
Based on indoor diurnal high frequency monitoring of M. aeruginosa, this study found that the growth pattern of M. aeruginosa was variable during the day and night, showing three phases in general (LAP, LGP, and SP). It was found that there was a significant difference in the growth trend of M. aeruginosa between day and night in LAP and LGP, but the difference was not significant in SP. In addition, the indoor growth parameters of M. aeruginosa were scientifically obtained in this study. The stabilization time of M. aeruginosa at SP stage was about 80 days, and the extreme value of chla concentrations was about 110-120 μg/L. The Three-stage pattern and its related parameters proposed in this study are important references for the indoor culture of M. aeruginosa and the construction of prediction models.

