

Introduction
Side weir is one of the most common diversion structures that used from many decades in irrigation, flow control, sewer, drainage engineering and other hydraulic structures. It is used to convey excess flow from the parent channel into the diversion channel when the surface water elevated above the maximum crest level. The side weir overflow is considered as a special case of spatially varied flow with decreasing the flow rate. The side weirs are classified to many types, the most common types are rectangular, triangular, circular and labyrinth. The labyrinth type is one of the most effective side weirs in controlling and reducing the upstream water level because of the non-regularity in the weir crest plan. The basics and theories for the design of side weir for subcritical flow are firstly obtained by De-Marchi’s constant-energy approach in (1934) as measured by V-Chow cited in [1]. The concept of De-Marchi’s constant energy [2] is often used by other researchers for studying the characteristics of flow over side weir [3, 4]. De-Marchi obtained a mathematical formula to calculate the discharge variety over a side weir:
Where, dQ/dx is the upstream parent channel flow to the distance from the side weir beginning, g is gravity acceleration in m2/s, P is side weir height, y is the flow depth along the centerline, and Cd is side weir discharge coefficient.
Lots of studies were conducted for modelling different types of side weir. Most of them defined the surface profile along the side weir at both sub-critical and super-critical approaches and founded the discharge coefficient the side weir in order to improve this weir efficiency using different shapes of the weir crest [4-8]. Different schematic approaches and intelligent models has been used for the predicting discharge coefficient of various types of side weir [9-19]. Many studies have been conducted that the modified side weirs performs better as compared to rectangular side weirs [8, 20-30]. Nowadays, various shapes of labyrinth side weirs have been developed, for example triangular, trapezoidal, circular and semi-elliptical. The triangular labyrinth side weir was considered firstly by [20] and they conducted that the coefficient of discharge increased through increasing the upstream Froude number. The flow characteristics over the side weir have been conducted experimentally and simulated numerically by [31]. The results showed that the flow performs in three dimensional near to the side weir and hence it provides some errors in outlining the streamlines. [32] carried out an experimental study for one and two cycles of triangular labyrinth side weir. The results showed that the ratio of coefficient of discharge for a triangular labyrinth to a conventional side weir increases to higher than two with the similar conditions of geometry and flow. [33] studied experimentally the influence of number of cycles on the flow characteristics of flow for triangular labyrinth side weir. For this purpose, three number of cycles were used (1, 2 and 4 cycles). The results showed that the labyrinth side weir with four cycles has poorer performance in contrast with two other models. [34] compared three methods, empirical formula, Radial Base Function RBF and Multi-Layer Perceptron MLP neural network. Several famous formulas from previous studies for predicting discharge coefficient were collected and compared with measured data and predicted the most accurate formula between collected empirical formulas. [35] predicted scour depth at the triangular labyrinth side weir based on dimensional analysis. Gene expression model performs good results for predicting discharge coefficient of side weir [36, 37]. According to the results of [38] the ANFIS method has higher performance with using simple variables at input. Due to the limited space in the side weir wall, the cycle number in labyrinth side weirs more than two could not be appropriate to side weirs in practice [39]. More cycles results in the reduction of the effective length of the side weir due to the jet collision flowing over the crest in the joining points of the cycles [33]. The inside angle of triangular labyrinth side weirs has a significant effect on the water surface elevations along the side weir opening [40].
As the flow over the labyrinth side weir structure is very complicated, in this study, some aspects of hydrodynamic flow behavior of water surface flows over the side weir for instance, velocity distribution, discharge coefficients, and surface water elevations are determined more precisely using CFD model (ANSYS-CFX) code with experimental workup for different types of side weir. The discharge coefficients of various labyrinth side weirs are compared with rectangular ones which are correspondingly verified numerically.
Experimental and Numerical Model Setup
Experimental Description of Test Cases
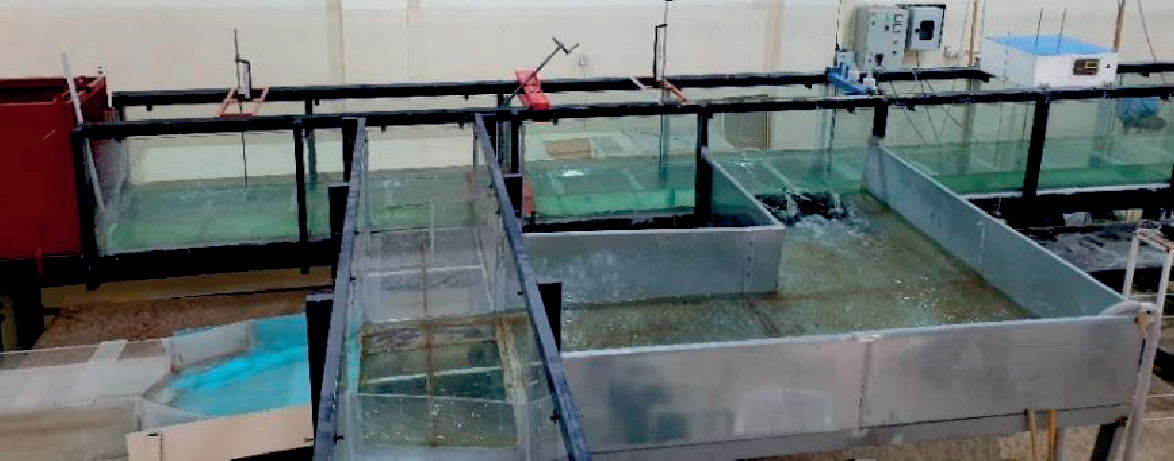
The present side weir experiments are conducted at the Hydraulic Laboratory of College of Engineering, University of Duhok. All test cases are performed in rectangular horizontal open channel with the collection channel installed adjustable to the parent channel. The main channel is 11m long, 0.6 m wide and 0.6 m deep. The collection channel is 0.4 m wide and 0.3 m deep, while the width of the collection channel across the side weir is 1.1 m in order to provide free overflow conditions as shown in Fig. 1. The flow meter and two fixed sharp crested weirs have been used for measuring incoming, out coming and side flow discharges. Two Ultrasonic sensors FDU90 which was continuous, non-contact level measurement of fluids have been used for measuring water surface elevations along the center and at weir bank of the parent channel. The ultrasonic sensors were applicable for continuous, non-contact level measurement of fluids, these sensors were connected to the transmitter (Prosonic S FMU95) in order to monitor measured levels via display and operating module. This type of transmitter, automatically recognizes the type of sensor. In addition, a manual point gauge was used for measuring the head of water over the flow measurement weir crest at the collection channel with sensitivity 0.01 mm and two point gauges were fixed at the upstream and downstream of the main channel as a control device to monitor the steady state condition. The experiments were performed for subcritical flow conditions. The minimum nappe height for all models is considered as 25 mm to avoid surface tension. The experiments were conducted for triangular labyrinth side weir with two cycles (n = 2) and normal rectangular side weir for weir height (P = 0.15 m) and weir length (L = 0.6 m). Three weir included angles with three weir heights have been tested which was (θ = 30o, 45o and 60o) and (P=10, 15 and 20 cm) respectively.
Numerical Description of Test Cases
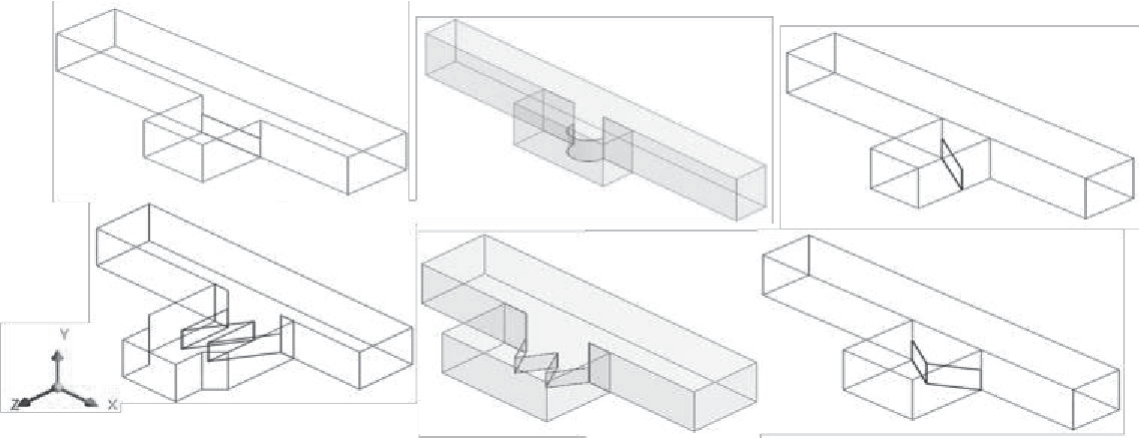
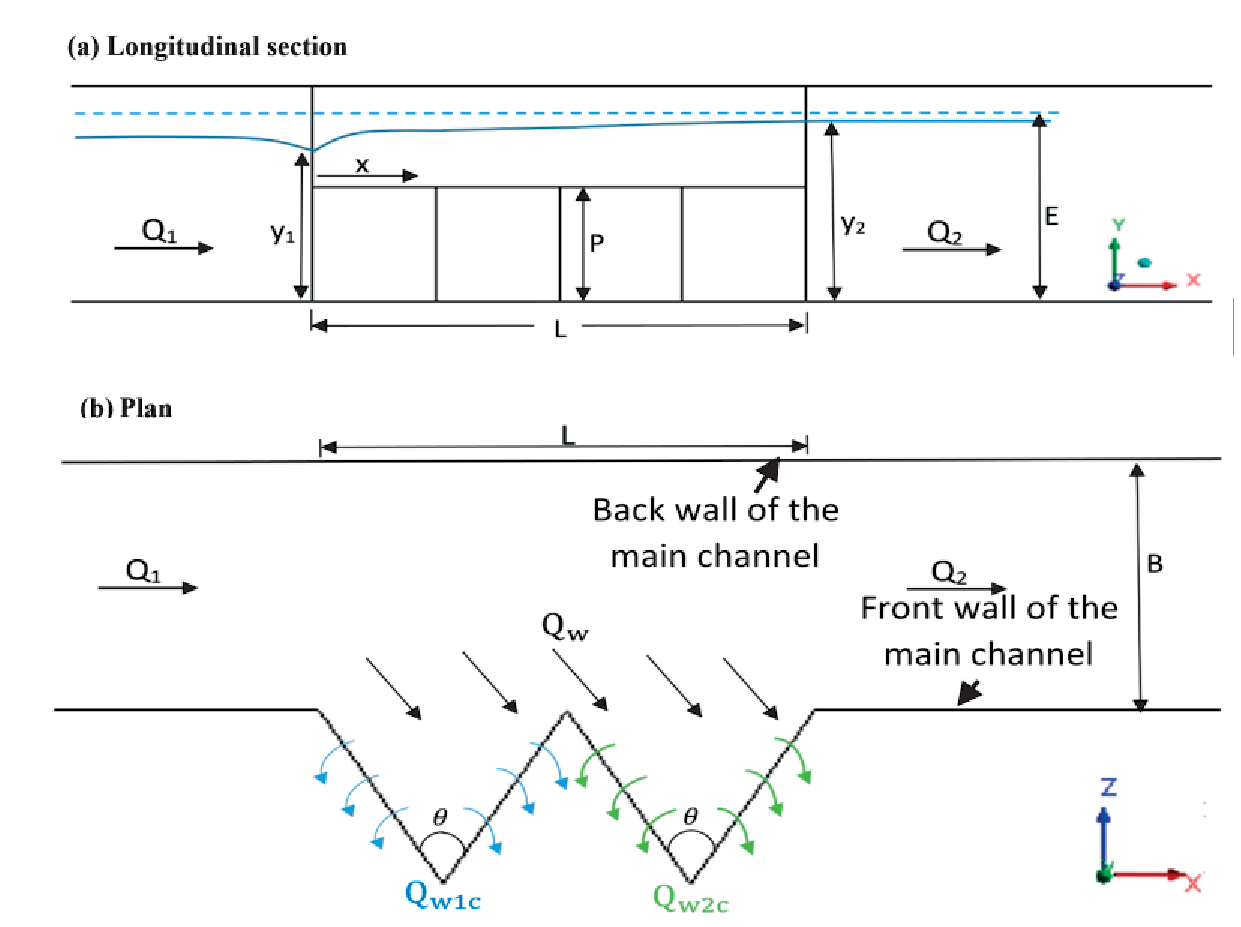
The verification for the numerical model based on the results of the present experimental study and on the previous experimental studies [20, 41, 42] for different range of Froude number. Different types of the side weir have been simulated to compare the efficiency for these types of the side weir and show the compatibility of the numerical simulation for analyzing the hydrodynamic behavior of the flow. Wider details of the geometrical experimental models that are used in the simulation are presented in Table 1. After performing the verification, several test cases of side weir have been simulated numerically using ANSYS-CFX software. The simulated test models were triangular labyrinth side weir with two cycles. Furthermore, the normal rectangular side weir has been simulated for the same weir length and opening. The geometry of all above models have been developed in ANSYS-Design Modeler. The details of all verified and present tested models are shown in Fig. 2. The definition sketch of tested models presented in Fig. 3.
Theory of ANSYS-CFX
ANSYS-CFX is one of the popular commercial codes that based on unstructured and structured grid, it employs moving mesh approach which is one of the adaptive techniques that solves partial differential equations in order to improve the approximate solution with grid refinement. The CFX theory is based on the method of an element-based finite volume discretization to solve Reynolds Averaged Navier-Stokes equations (RANS), which is used to solve the conservation equations of continuity and momentum for the fluid flow [43, 44].
Table 1.
Details of the test cases adopted for numerical model
The mass balance formula of a viscous fluid with a compressible component can be used to derive the equilibrium equations of flows from the law of conservation of mass. [43]:
In which, Vf is the ratio of fluid volume to the whole element volume, ρ is the fluid density, t is time, (u,v,w) are the components of velocity in (x,y,z) directions, (Ax, Ay, Az) are defined as the proportion of the area of fluid to total element area in (x,y,z) directions.
Navier Stokes equations of fluid flow with velocity components (u, v, w) in three-dimensional coordinates can be written as:
(3)
The terms (Gx, Gy, Gz) in the above equations indicates mass acceleration and the expressions (fx, fy, fz) symbolizes viscosity acceleration. So, the acceleration of Viscosity is defined as:
(4)
In which the wall shear stress is indicated by (wsx,wsy,wsz).
In addition, the Volume of fluid scheme (VOF) can be used which is one of the identical methods for solving the applications involving the free surface flow [24, 45- 48]. In this method the volume fraction of every fluid is defined in the whole domain. Then the boundary between the two fluids (water and air) is recreated to model the free surface profile, a continuity equation is used to solve the volume fraction of phases in order to trace the interface among two phases:
where, αw is the water volume fraction, and ui is the speed in the direction of xi.
The sum of the volume fractions for two phases (water and air) is equivalent to one; hence, the air volume fraction (αa) is represented by:
Numerical Grids and Setup
In the present study, the Multizone mesh type with hexa elements was used for discretizing all different types of side weirs with the maximum number of elements (755324). The hexa element type has a good accuracy in executing data in any section. As the passing flow over the labyrinth side weir is very complicated near the side weir path and changes quickly, the mesh adaptation was used in order to automatically refine the mesh at free surfaces that results large fluctuations as shown in Fig. 4. So, the maximum total number of elements after using the mesh adaption became (3020560).
Boundary conditions have a significant influence on numerical modelling results especially for complex flow conditions like labyrinth side weir simulation. These conditions were selected for all locations of the fluid domain as follows; at the inlet main channel, the bulk mass flow rate was set, on the outlet of the parent channel the static pressure was selected depending on the downstream flow conditions, while at the outlet of the branch channel the free flow was used by considering the zero Pascal gauge pressure. The opening boundary condition was fixed at the top locations of the main channel and side channel which open to the atmosphere. In the solid wall locations, the nonslip shear and smooth wall conditions were fixed. After selecting the boundary condition, it is important to adopt the initial conditions at the beginning of analysis in the inlet section of the main channel. The initialization can be considered by entering the values of water and air volume fraction, inlet pressure and velocity components. Throughout the setup procedure, the RNG k-ϵ turbulence model was utilized for flow computation over the different shapes of side weir. The RNG turbulence model is the same as the SKE turbulence model with some modifications to the turbulent dissipation rate ε which increases the accuracy for the swirling flows. The Navier-Stokes equations served as the basis for this model [44].
Results and Discussion
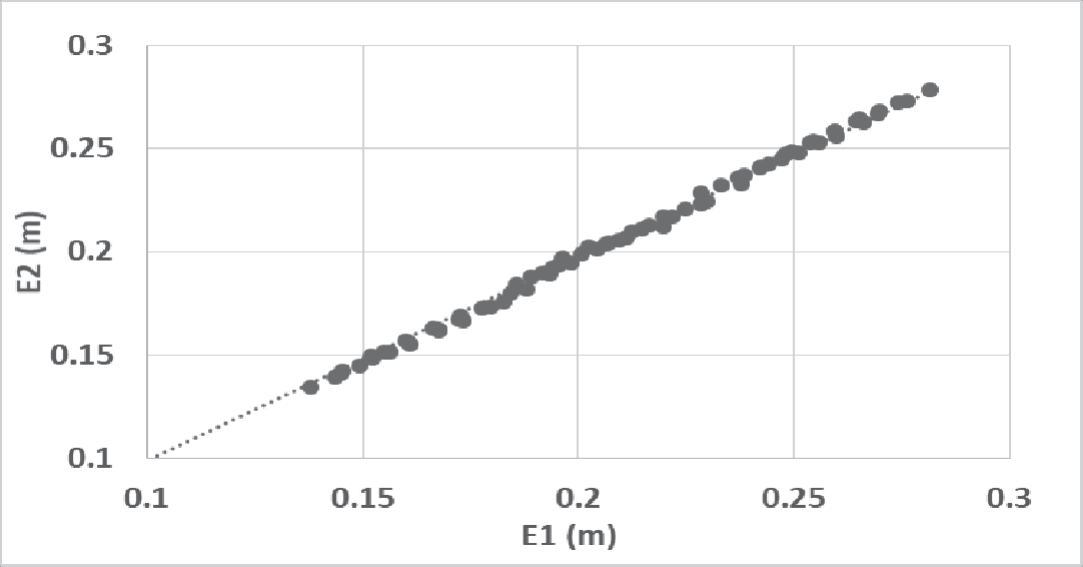
Energy values at the upstream and downstream ends of the side weir have been calculated to show the specific energy variation along the weir section, as presented in Fig. 5. The results indicate that the difference between the specific energy between the two sections are very small and less than 0.3%. This means the assumption of constant specific energy was confirmed and the De-Marchi equation can be used for calculating discharge coefficients in all present test cases.
Results of Surface Profile
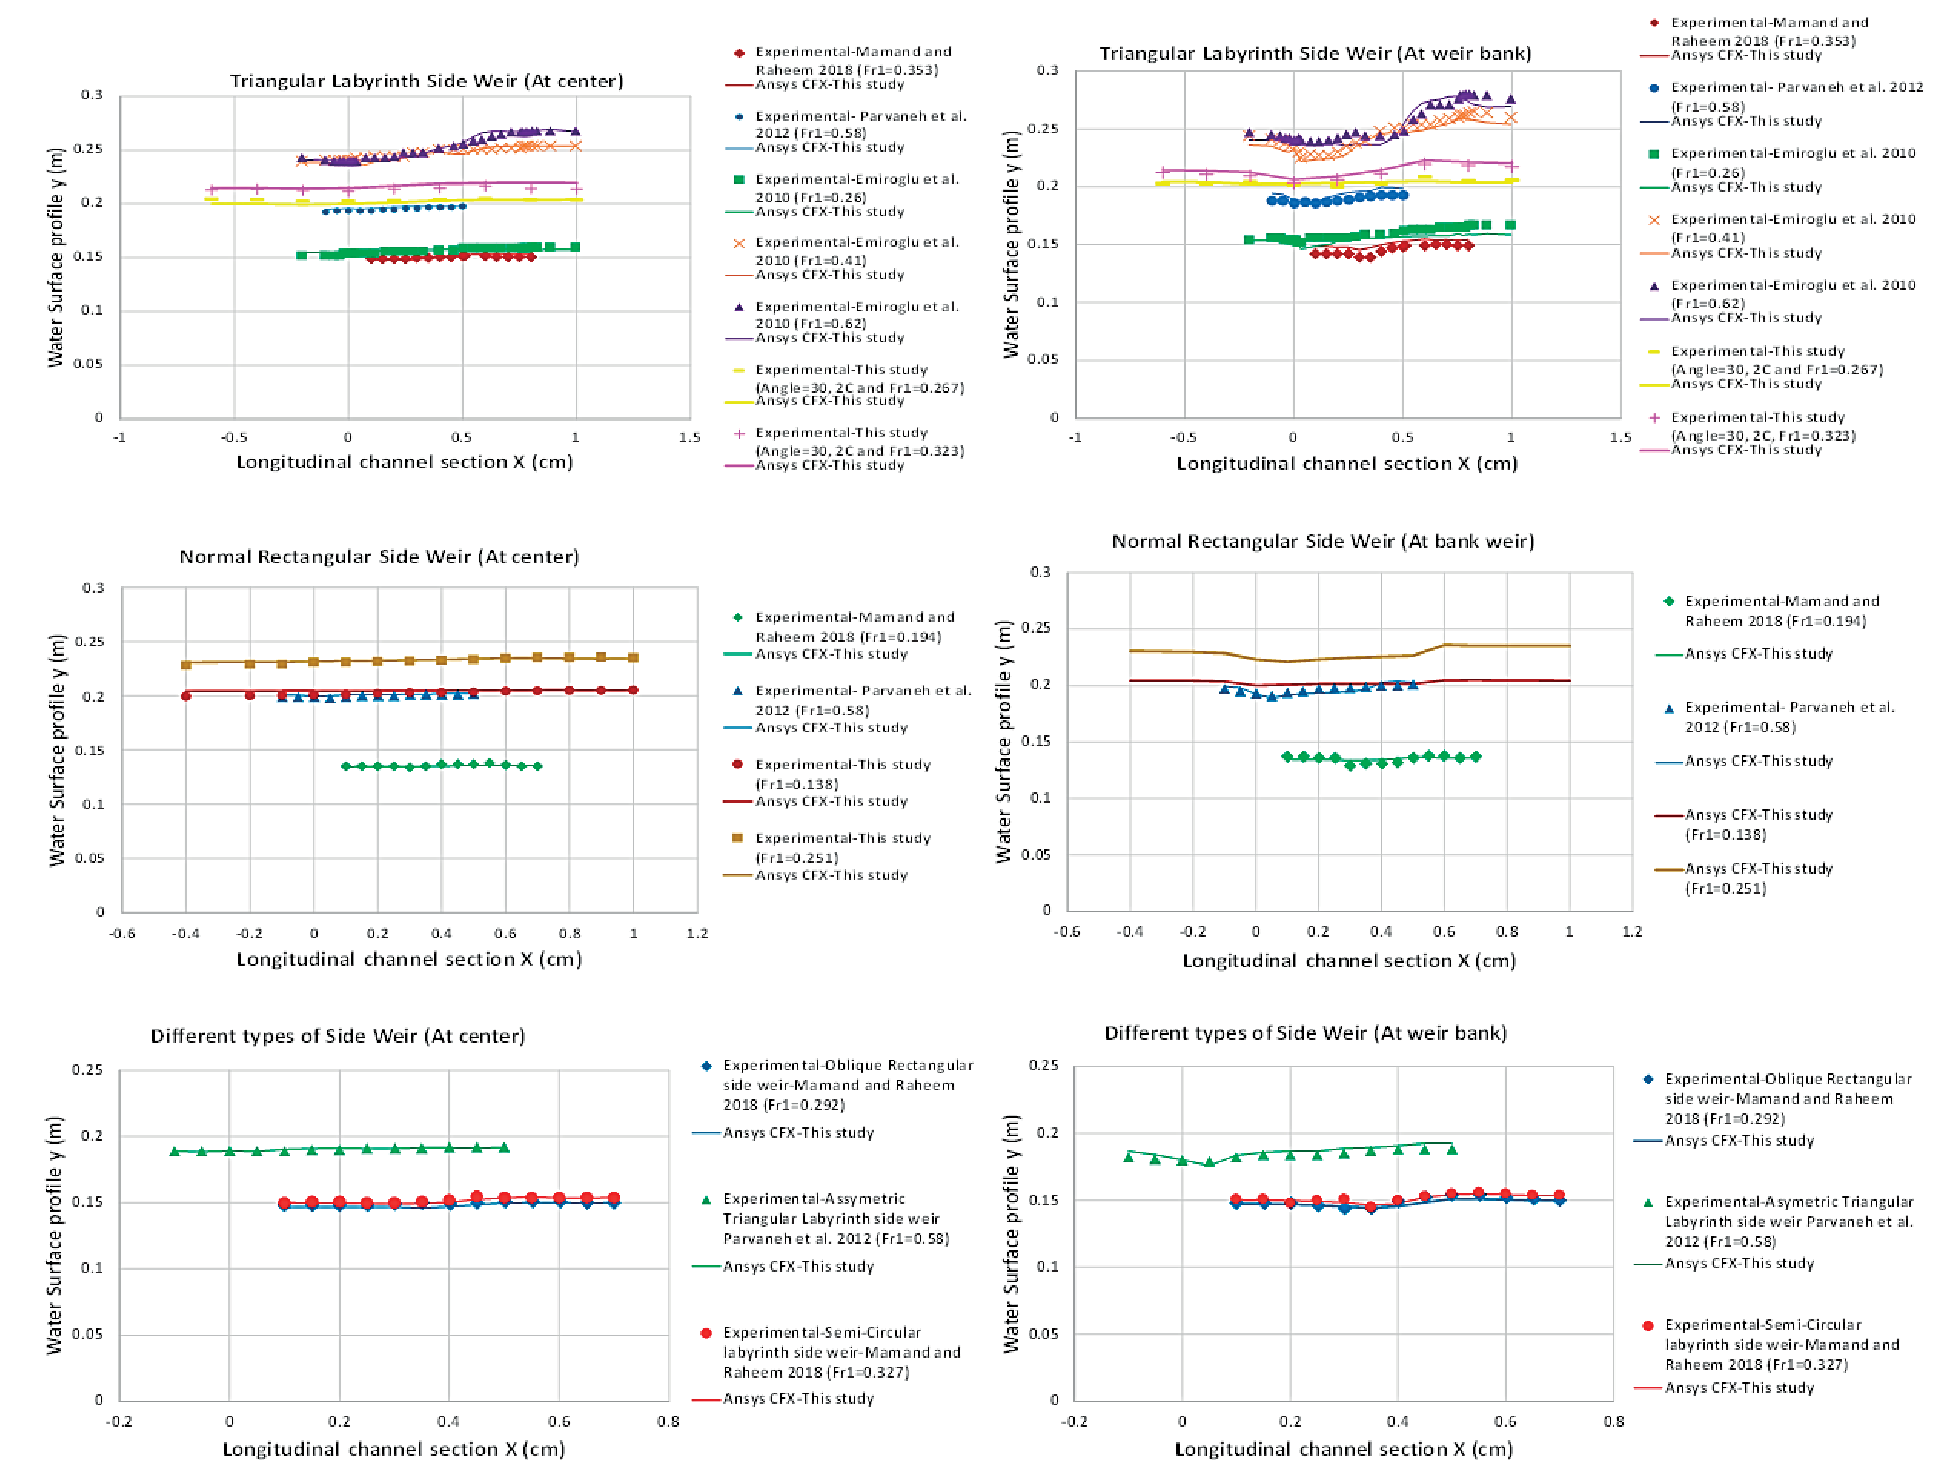
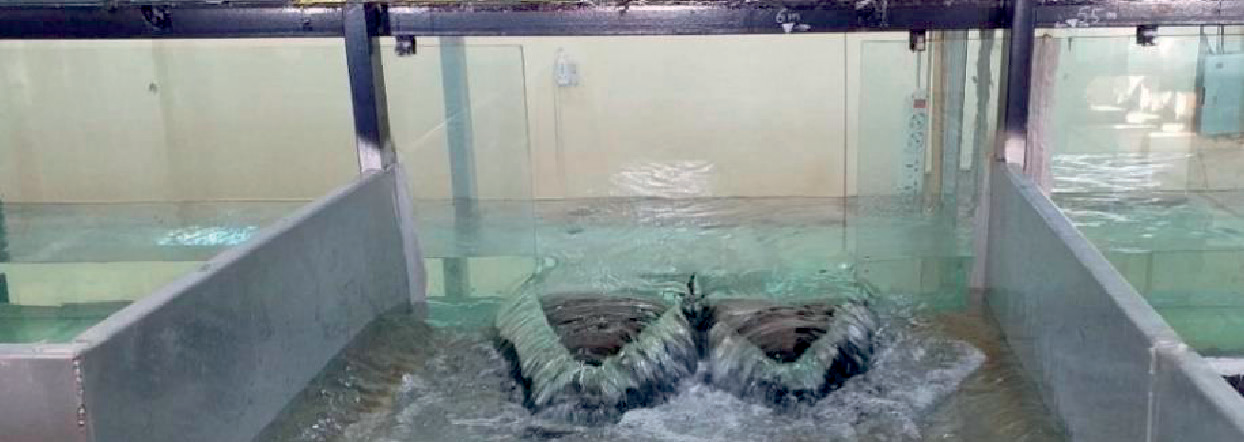
The water surface profiles along the center line of the main channel and at the weir bank were plotted in Fig. 6 for all tested models that obtained using experimental and numerical results. Fig. 7 shows a photo for the triangular labyrinth weir test of this study. The results show that the present numerical simulation predictions matched well with the current test outcomes and the experimental results of the previous studies [20, 41, 42] with maximum mean absolute percentage error less than 1% along the centerline and approximately 3% at weir bank profile.
It was observed from Fig. 6, that the water surface profiles along the centerline was absolutely the same for all different tested models with slight increase in water level towards the downstream end of the side weir. This increase in water level happens due to the secondary flow that disperses the energy of flow in the parent channel. The water profile can be viewed more clearly along the side weir bank. In which the water level along the side weir demonstrates a sudden fall at the upstream end of side weir due to effect of the side weir entrance and the occurrence of the vortices beside the side weir, after that gradually rises approaching the downstream end of the weir and reaches to the highest level nearly at the weir exit. After that the uniform flow has been observed at the downstream locations of the side weir in which the flow become parallel to the bed of the flume.

Results of Diverting Streamlines and Stagnation Zone
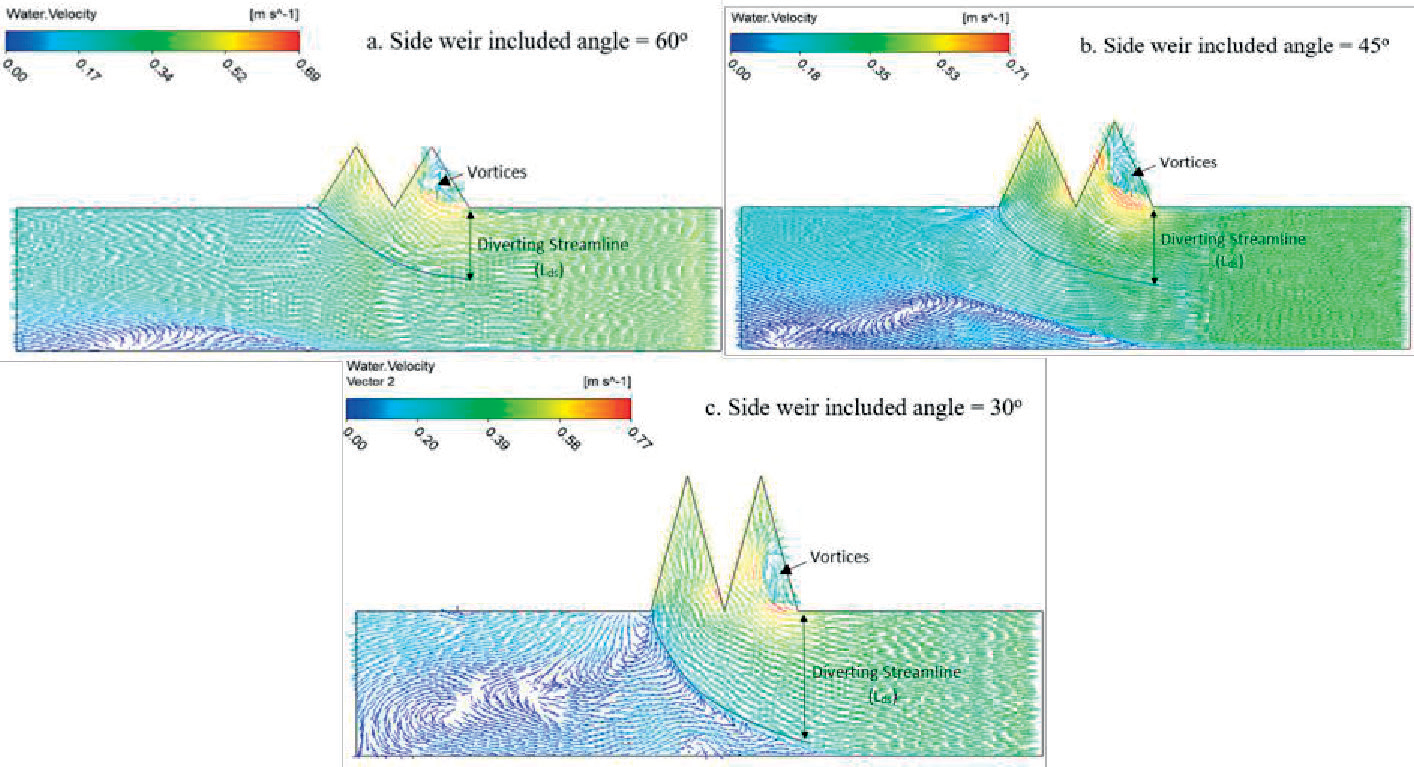
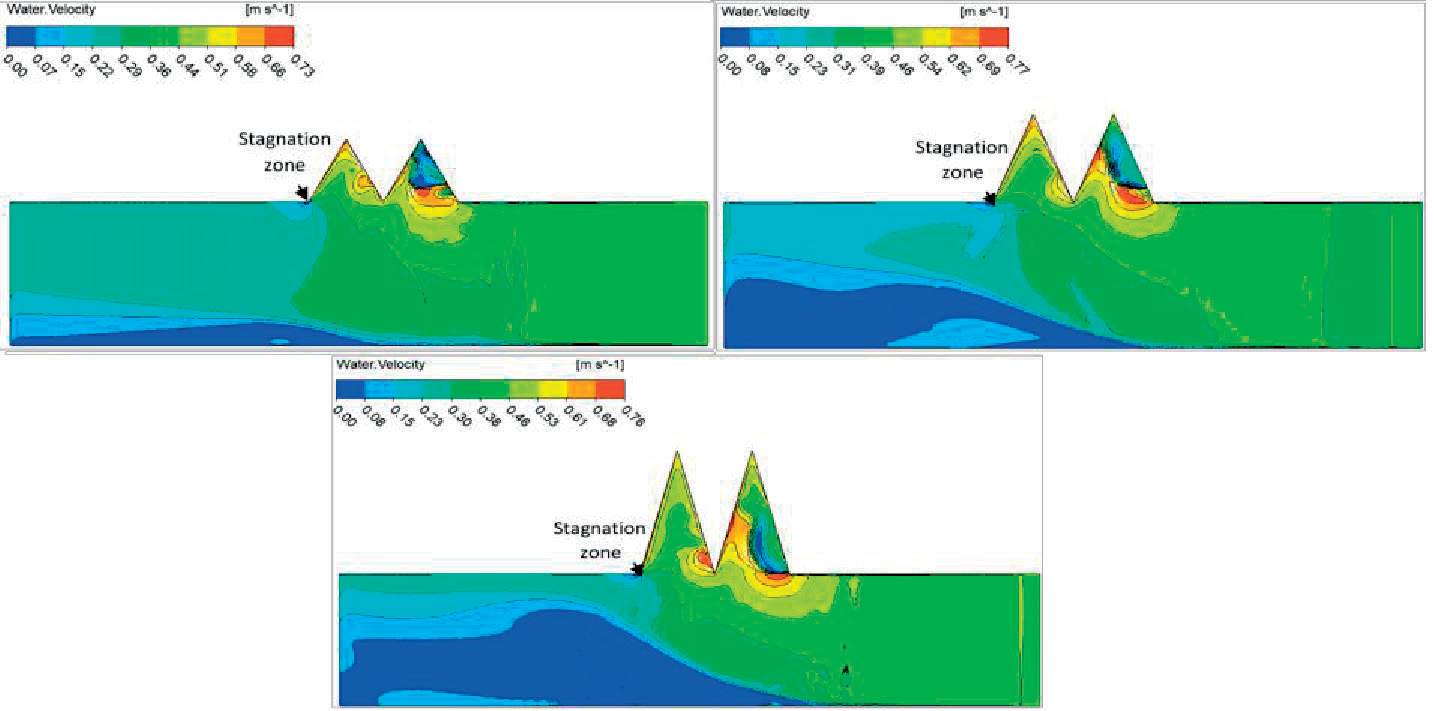
In order to show the effect of the diverting streamlines towards the side weir performance, the water velocity vectors, at inflow discharge (Q = 40.3 l/s) have been plotted along the surface of the channel in Fig. 8 for different weir included angles. The diverting streamline represents the maximum flow path that separates the side weir flow and lateral flow. It was illustrated from these velocity vectors that with increasing the side weir included angle, the width of the diverting streamline at surface from the upstream end of side weir reduced, the estimated ratio for the width of the diverting streamline to the parent channel width (Lds/B) within the upstream Froude number range (Fr1 = 0.19 – 0.33) and (y2/y1) ratio of (1.01-1.03) was (0.49, 0.61, and 0.66) for the weir included angles (60, 45 and 30) respectively. When the diversion streamline strikes the near wall of the main channel at the downstream of side weir results the existence of the stagnation point. At this point, the water velocity reaches to zero, while the water surface elevation extents to its maximum level, the region of this zone has been clearly visualized in velocity contours shown in Fig. 9. On the other hand, it is shown from this figure that the average water velocity decreases along the centerline of the parent channel while increase towards the labyrinth zone, near the upstream side wall. The region of the stagnation zone relying on the upstream Froude number F1 in the main channel, side weir geometry and weir included angle.
Results of Separation and Depression Zone
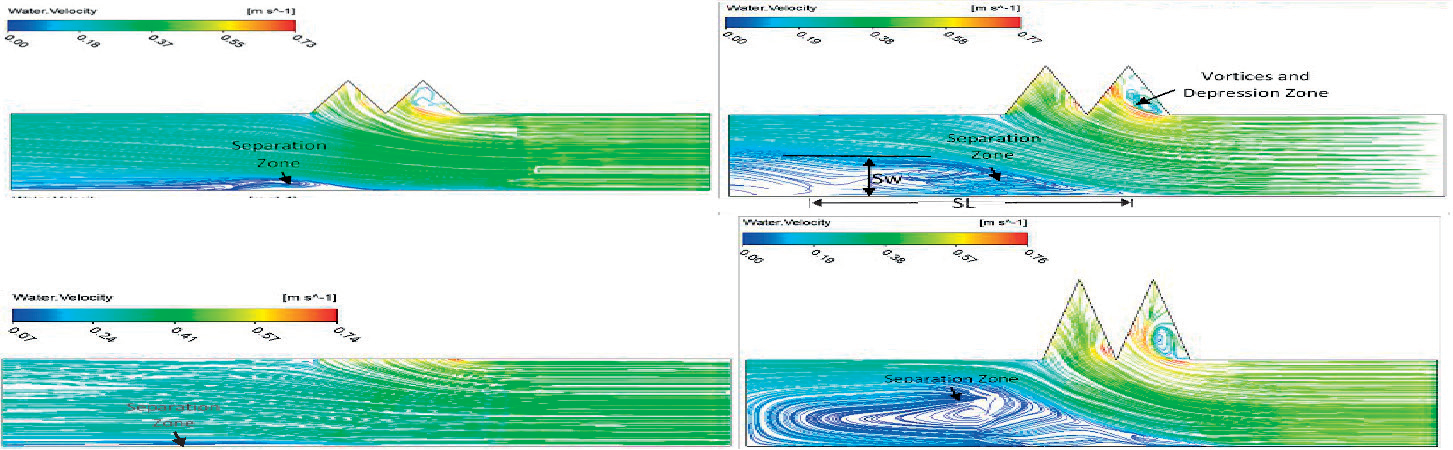
The effect of side flow which tends to reach the side weir causes a separation zone close the back wall of the parent channel. The location of separation region, its length (SL) and width (Sw) depend on the shape and included angle of the side weir. It is shown from velocity streamlines, Fig. 10, that with decreasing the included angle of the side weir, the separation region enlarges due to passing the higher ratios of the over flow (Qw/Q1) at smaller angles. In which, the higher overflow ratio causes a huge amount of water to divert into the side channel and reducing the outflow in the parent channel. In order to maintain the total amount of energy downstream of the side weir, a separation zone is formed, the area of such a zone depends on the overflow ratio and the included angle of side weir. It was observed from these streamlines that the triangular labyrinth side weir has larger separation region as compared to the normal rectangular side weir. Maximum width of the separation region was observed to be 0.3 times the width of the main channel (0.3 B) for the rectangular side weir as the same results were indicated by [42], while for the triangular labyrinth side weir the maximum width reached (0.8 B) which is more than 8% of asymmetric labyrinth side weir [41]. Furthermore, the maximum separation zone length is slightly higher than (3.0 B) in comparison with [42] which was approximately equal to (3.0 B).
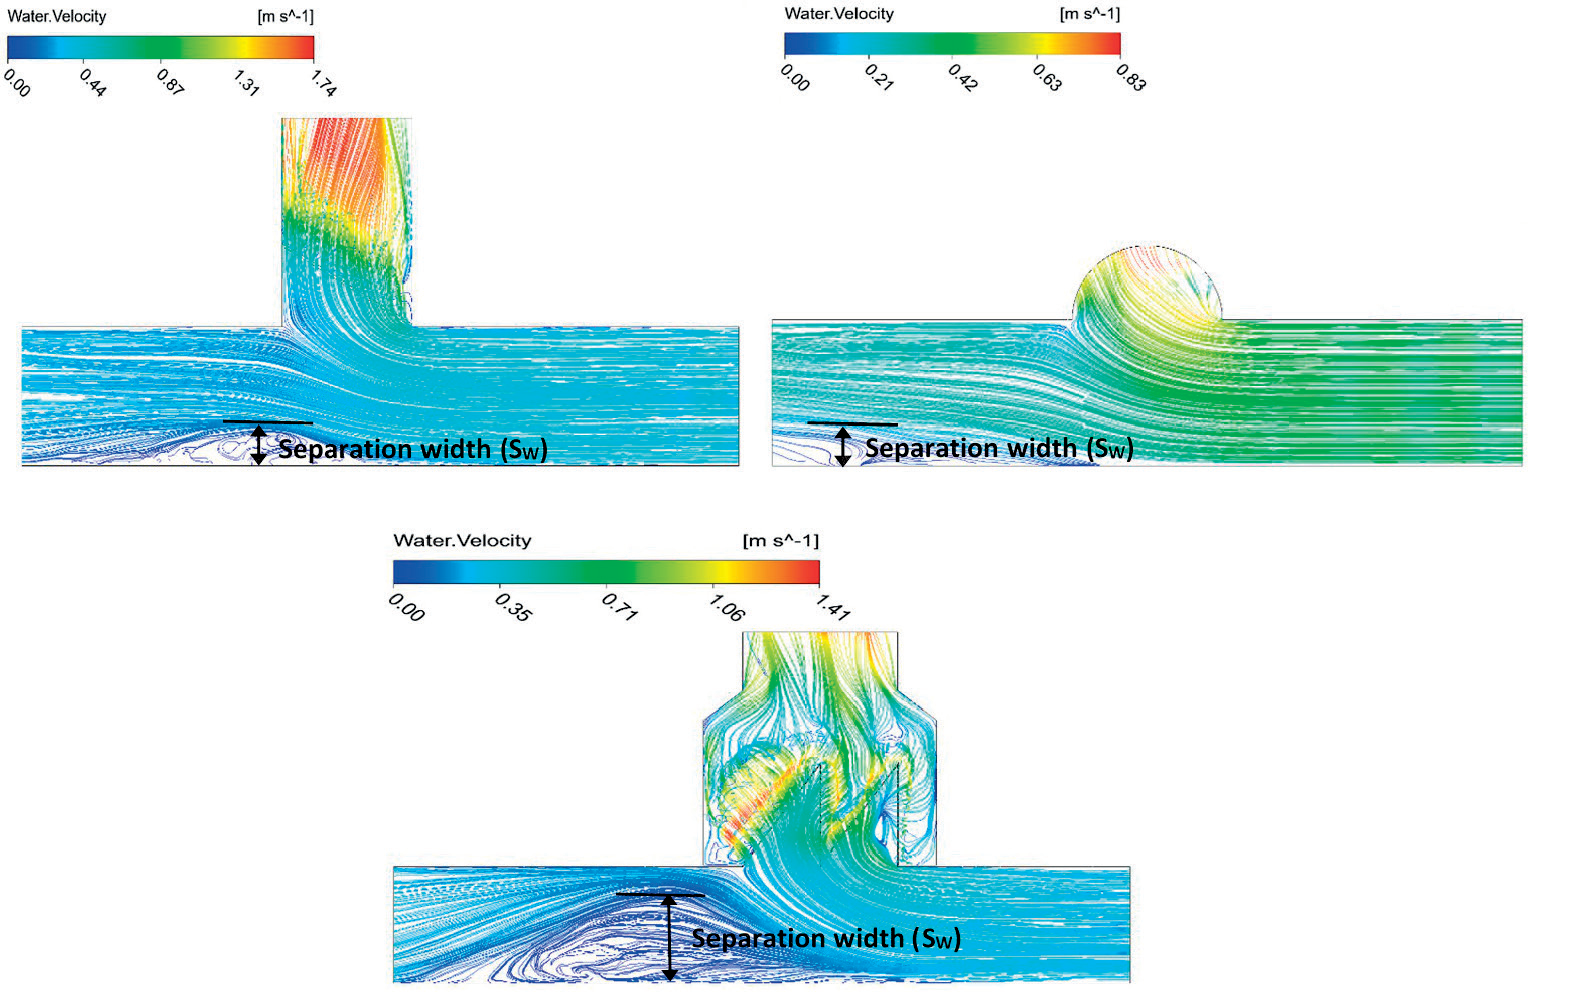
The water velocity streamlines were visualized from the verification of the experimental earlier studies data [41, 42] for different types of side weir in Fig. 11. It was observed from this figure that, for approximately the same value of Froude number (Fr1 ≅ 0.22), the width of the separation region was (0.3, 0.35 and 0.72) times the width of the main channel (B) for oblique, circular labyrinth, and asymmetric triangular labyrinth side weirs respectively.
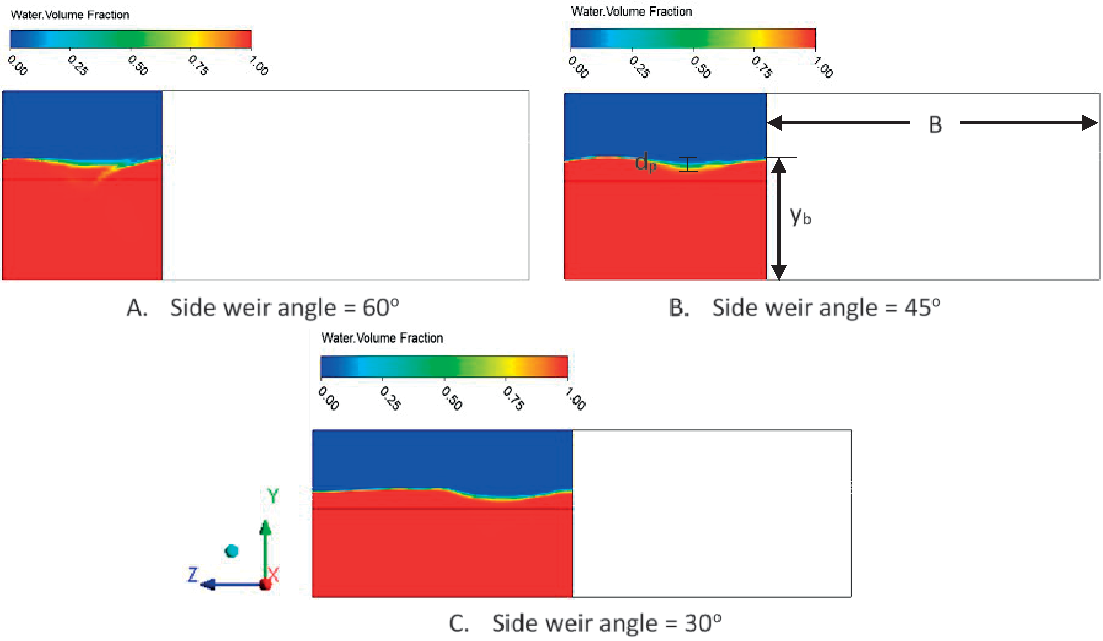
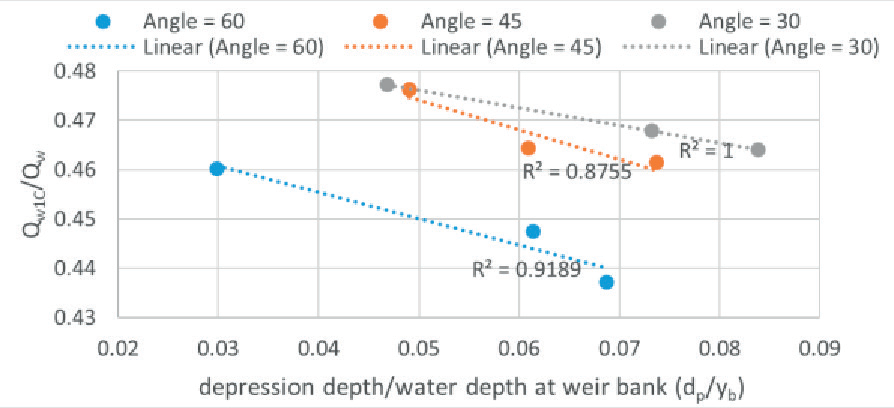
Furthermore, the phenomenon of depression zone has been visualized in the labyrinth side weir, it was cleared by plotting water volume fraction contours along the centerline of the first cycle of labyrinth side weir in ZY- plane, which is presented in Fig. 12. This zone is generally formed in the initial (1st) cycle of the labyrinth side weir close to the upstream crest. The main reason for developing this zone is the direction of the velocities near each side wall of the 1st labyrinth cycle, and this results flowing the smaller amount of water over the first cycle of labyrinth side weir comparing to the second cycle. While, at the second cycle which was located at the downstream of the side weir causes the larger amount of water to pass over its crest, which is increased about (9 to 29%) with the comparison to the first cycle. In order to show the effect of the depression depth to the overpassing flow from the 1st cycle of the labyrinth, the relationship has been plotted between the ratio of the surface water depth of the depression at centerline of the 1st cycle (dp) to the depth of water at weir bank (yb) and the ratio of the passing flow over the 1st cycle of labyrinth side weir (Qw1C) to the total passing flow over the labyrinth side weir (Qw) for different weir included angles in Fig. 13. The results show that with increasing the (dp/yb) ratio, the passing flow over the 1st cycle has been decreased and the same trend has been seen for all weir included angles.
Fig. 10.
Water velocity streamline for the upstream Froude number (Fr1 = 0.26) of different weir included angles and RSW.
Vertical Profiles of Longitudinal Velocities in the Main Channel
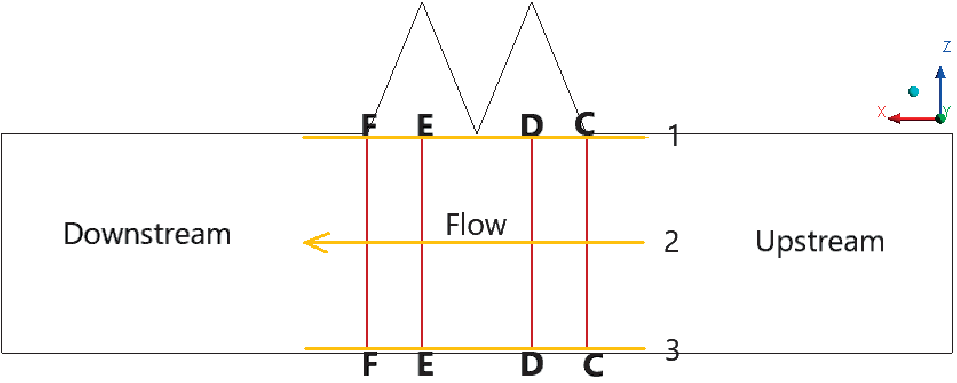
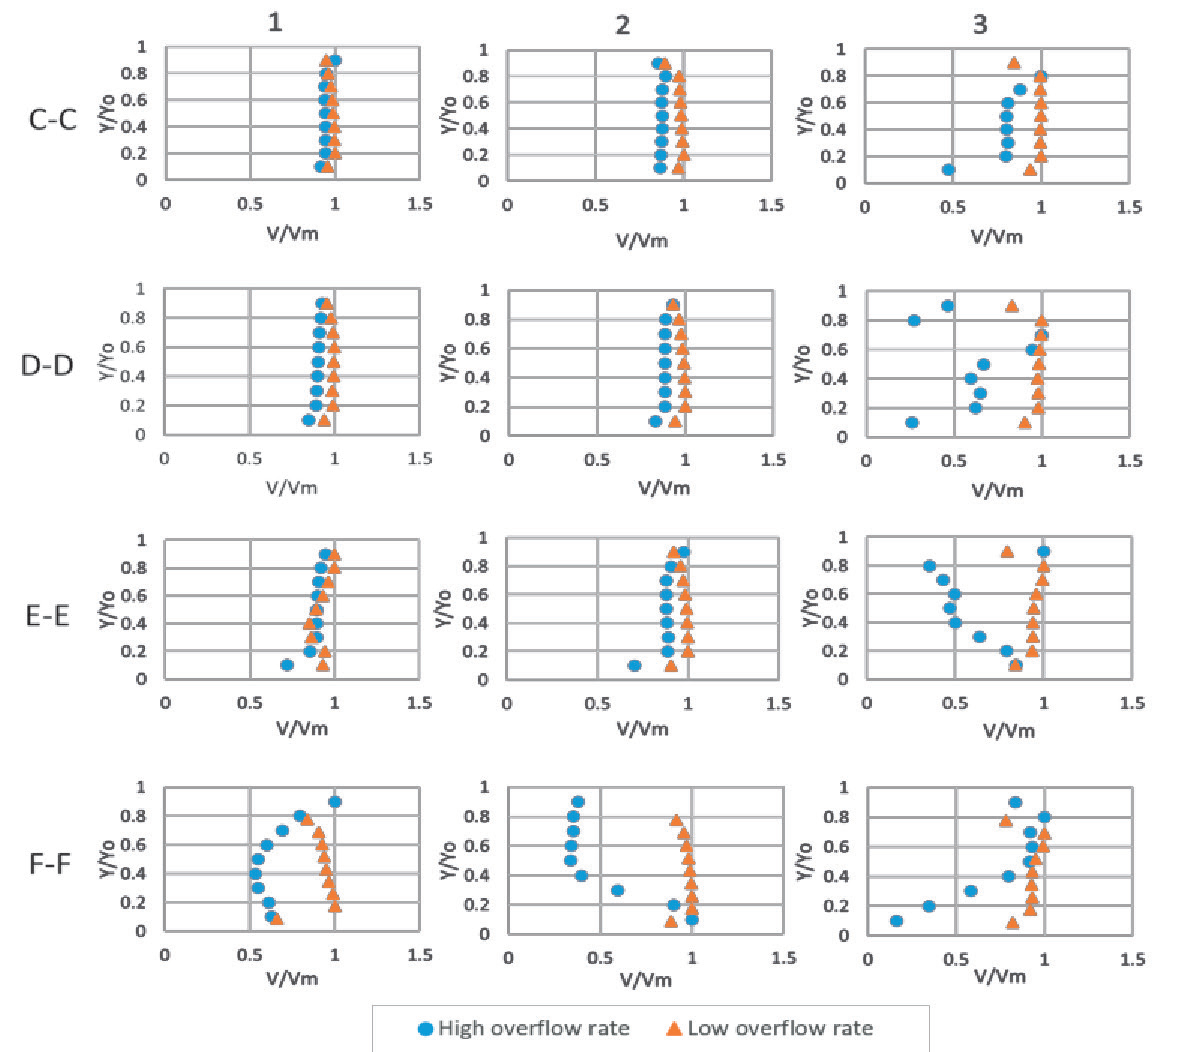
The vertical velocity profiles in the longitudinal section of the main channel was investigated numerically in order to show the effect of over flow on the parent channel flow. Velocity profiles were conducted for triangular labyrinth side weir of height 0.15 m, included angle 30 and length 0.6 m for both high and low overflow situations (Qw = 0.80 Q1 and Qw = 0.13 Q1) and the main channel flow Q1 =40.5 l/s. The selected points for estimating velocity are illustrated in Fig. 14, which are (C1, C2, C3, D1, D2, D3, E1, E2, E3 and F1, F2, F3). The normalized velocity profiles has been plotted in sections C-C , D-D, E-E and F-F versus the ratio of the local vertical coordinate (depth) to the parent channel depth (y/yo), as in Fig. 15. The velocity has been normalized by dividing the velocity at every location of the parent channel to the maximum speed at each section (V/Vm). The ratio of (V/Vm) ratio deceases towards the section 3 with instability in the velocity range especially for high overflow rates to side weir and section 1 always has a greater velocity values, the same findings were observed by [20, 25]. In addition, normalized velocities at section F-F have lower values as compared to other sections and it is due to the decrease in the discharge after the side weir and creation of the separation zone in addition this causes the depth of flow to become higher than the upstream section C-C. Also, this reduction in velocity profiles at sections 3 and F-F because of falling the parent channel momentum in the flow path and the appearance of separation zone near the left channel side and at the downstream end of side weir as a result of decreasing momentum.
Results of Discharge Coefficient
The coefficient of Discharge for triangular labyrinth side weir of different weir included angles was computed using De-Marchi’s equation (1). In order to show the capability of numerical simulation and the effect of geometry shape on the performance of the side weir, different side weir geometries of previous studies and present study have been simulated. Fig. 16 shows the comparison of discharge coefficient values for the labyrinth side weir of the present study with those of [3, 4, 7, 33, 41]. This figure indicates that the measured weir values of Cd are clearly above 1 for included angles 30o and 45o under the current test conditions, as the same trend were found by [10, 25, 33, 49, 50], and the discharge coefficient increased with decreasing Froude number at the upstream end of side weir (Fr1). Moreover, it is noticed from this figure, that discharge coefficients of triangular labyrinth side weirs for three tested included angles (30°, 45° and 60°), compared to those of rectangular side weirs, have substantially higher values, which is about (3.8, 2.7 and 2.12) times more than that of the rectangular side weir obtained from the previous reference [3]. Especially, triangular labyrinth side weir with small included angle (θ = 30°) has greater Cd values, which is about 1.8 times greater to that of labyrinth side weir with larger included angle (θ = 60°). The smaller inclusion angle provides a longer crest length ratio to the weir length (l/L) which is about 1.93 times higher when compared to the larger tested angle, so it can be explained that the longer crest length performs better as an effect of its smaller angle. Additionally, among the investigated settings, Fig. 16 compares the values of Cd for several side weirs examined in this study to Fr1. The findings show a negative correlation between Cd value and Fr1. The majority of researchers [3, 4, 33, 41, 50-52] revealed comparable findings. In other words, in subcritical flow, side weirs perform better when the mean velocity of flow is low. This means, increased flow velocity causes vortices and eddies to generate in the channel, which reduces the efficiency of side weirs.
An empirical relationship was developed to predict discharge coefficient (Cd) for triangular labyrinth side weirs according to the effective parameters for the present study; upstream Froude number (Fr1), upstream water depth to the weir height ratio (y1/P) and crest length to the weir opening width (l/L). The resulting discharge coefficient formula is provided in the following form:
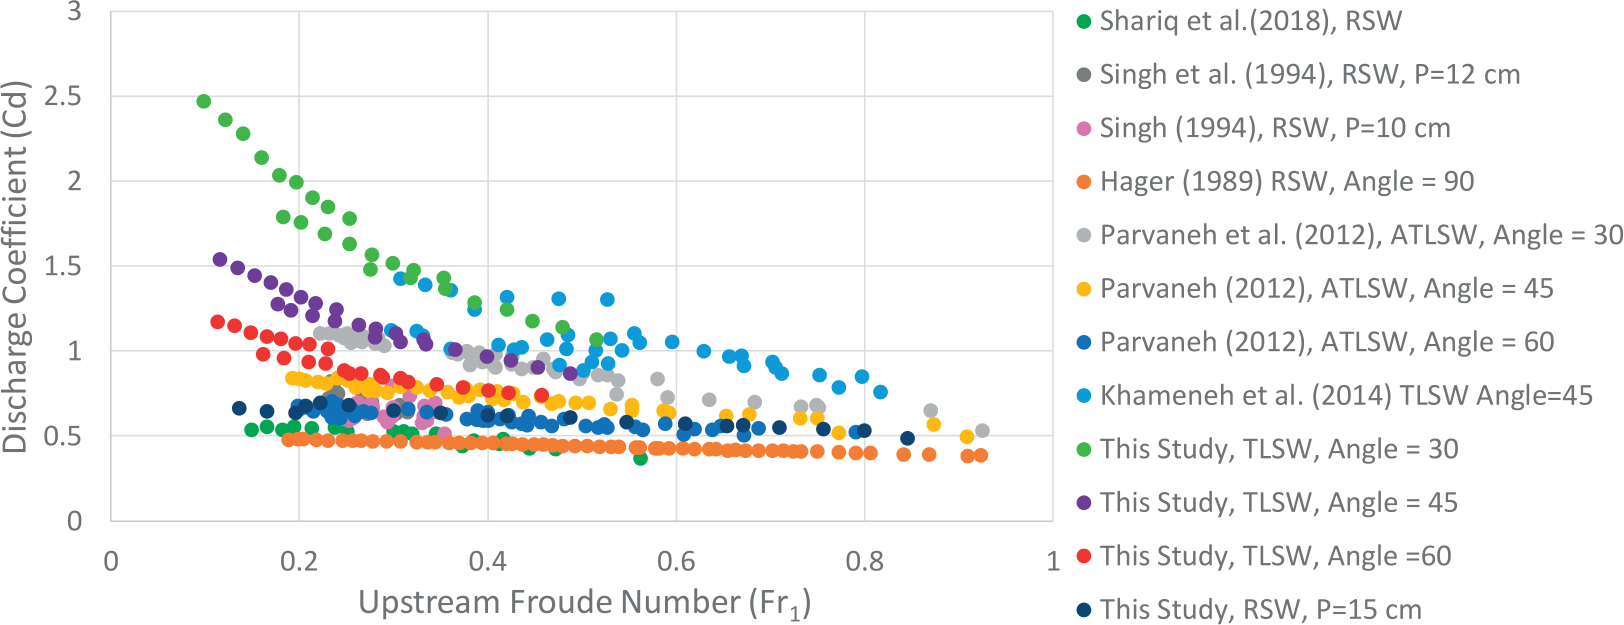
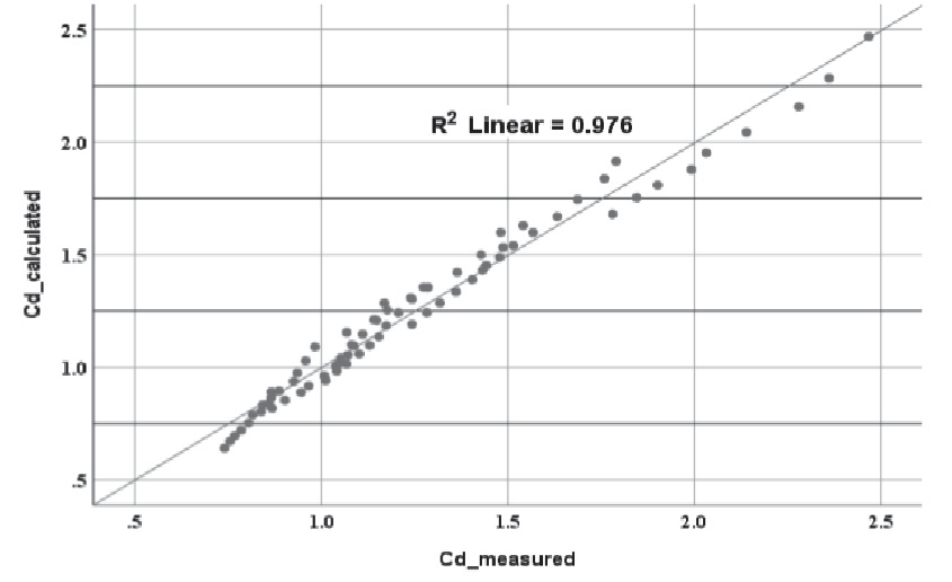
Fig. 17 illustrates the measured Cd values against proposed ones using equation (7). In order to the accuracy and precision of developed equation in the present study, the statistical tests, Root Mean Square Error (RMSE), Mean Square Error (MSE) and Mean Absolute Error (MAE) has been used as given below [53-55]:
The results showed that there is good agreement between the measured and proposed discharge coefficient. The RMSE, MSE and MAE errors for discharge coefficient prediction are 0.062, 0.00385 and 0.0525 respectively.
Conclusion
The discharge coefficient of triangle-shaped labyrinth side weirs with various weir inclusion angles was examined in this study under subcritical flow situations. Data from the experimental studies were used to provide numerical modelling in order to visualize the flow behavior and estimate discharge coefficient for this type of side weir in subcritical flow conditions. During this study, the following findings have been investigated: – The discharge coefficient of triangular labyrinth side
weir was up to 3.8 times greater in comparison with
the rectangular side weir. – A significant increase in Cd results from a reduction
in the labyrinth weir inclusion angle and this causes
the overflow length to get bigger and due to the
recession of the vortices zone at the upstream side
wall of the weir. The labyrinth side weir with an
angle of (θ = 30) has the highest Cd values among all
those examined. – Wider part of the surface flow directed to the side
weir when the inclusion angle is small, for θ = 30°,
Lds/B = 0.66. – The amount of water flowing over the second cycle
is about (9 to 29%) higher than that passing over the
first cycle due to the generation of the depression
zone in the first cycle. – The minimum values of vertical longitudinal
velocities were observed close the back wall of the
parent channel which is opposite to the side weir and
near the downstream end of the side weir due to the
appearance of the separation region. – An Empirical relation was developed for predicting
discharge coefficient for triangular labyrinth side
weir.

