

Introduction
Ecological civilization marks the civilization level of a society. It takes environmental protection as the principle and emphasizes sustainable economic development [1]. The construction of ecological civilization aims to solve the problem of urban waste treatment through reduction, harmless and recycling. Reduction, recycling and harmless will become an inevitable trend of waste treatment [2, 3]. Ecological civilization is a valuable experience and wealth formed on the basis of harmonious development of mankind, and a scientific theory to realize the common development of human and environment [4]. With the acceleration of urbanization, the traditional domestic waste recycling network has some shortcomings, such as insufficient effective classification of domestic waste, unscientific selection of domestic waste collection points, unreasonable design of domestic waste network transportation lines, etc. [5, 6]. The urban domestic waste reverse logistics network has the advantages of high measurable operation cost and strong information mobility, which is helpful for the domestic waste recycling center to carry out multi frequency vehicle recycling and shared vehicle scheduling for different types of waste [7, 8]. Therefore, the study of urban domestic waste reverse logistics network is conducive to further improving the urban reverse logistics recycling system and promoting the construction and sustainable development of an environment-friendly society [9].
In terms of pricing decision-making for recycling waste, several methods have been developed, including: Taking the manufacturer led closed-loop supply chain in manufacturing as the research object, the pricing of recycled products and the manufacturer’s profit under the manufacturer’s self-owned recycling mode and outsourced recycling mode are studied [10, 11]. Considering the difference in recycling costs between traditional recycling and Internet recycling, a pricing decision-making model is constructed, and through numerical simulation, the impact of various recycling factors on recycling pricing and recycling volume is analyzed [12, 13]. Aiming at the problem of intelligent recycling pricing strategy under the background of “Internet recycling”, a recycling model considering consumer behavior is established, and it is proposed that recycling pricing will directly affect recycling volume in a competitive recycling environment [14, 15]. A game model is built for the pricing decision of two-level remanufacturing closed-loop supply chain led by recyclers, In the case of two-stage remanufacturing and product remanufacturing only, the impact of the recycling pricing decision on the recycling quantity and the revenue of the recycler is analyzed [16]. Therefore, the pricing decision of recycling products has a direct impact on the recycling volume, but the impact of different recycling pricing strategies on the recycling volume of the recycling center and the optimization of vehicle routing combined with reverse logistics need to be further explored.
There is also some research progress in the reverse logistics vehicle routing problem under the intelligent recycling mode. It mainly includes: By considering the real-time collection status of the intelligent recycling box, an improved particle algorithm is designed to study the reverse logistics vehicle routing optimization problem based on the collection of solid waste in the intelligent recycling box [17, 18]. In order to maximize the recycling volume of intelligent recycling bins and minimize the vehicle transportation cost, a reverse logistics vehicle routing optimization model is established for different management modes to determine the dynamic optimal route [19]. Based on the reverse logistics resource sharing mechanism of real-time information acquisition in the Internet of things, a dynamic optimization model of real-time information in reverse logistics is established to realize the reasonable allocation of recycled vehicles [20]. The vehicle routing optimization of reverse logistics is mainly based on the pricing of product recycling [21, 22].
Taking Hefei as an example, this study studies the optimization of urban domestic waste reverse logistics network. This study considers the linear relationship between waste recycling quantity and recycling price in the reverse logistics network, and proposes a multi frequency recycling line design scheme based on different recycling pricing strategies and vehicle sharing scheduling, Combined with the strong global search ability of genetic algorithm and the fast convergence speed of particle swarm optimization algorithm, the elitist retention strategy between hybrid algorithms is designed to enhance the search performance of hybrid algorithm. Firstly, the linear function of the distance between the transfer station and residents is constructed, and then the double objective model of minimizing the operating cost of reverse logistics recycling and maximizing the product revenue of the recycling center is constructed. A GA-PSO hybrid algorithm based on K-means spatio-temporal clustering is designed to solve the model, and the path optimization problem of reverse logistics network is discussed, which provides a new research idea for the resource allocation problem of reverse logistics network.
Materials and Methods
Study Area
Hefei (116.41°E-117.58°E, 30.57°N-32.32°N) is located in East China, central Anhui Province, between the Yangtze River and Huaihe River, and the western wing of the Yangtze River Delta. The total area is 11445 square kilometers. The terrain of Hefei is inclined from northwest to Southeast, mainly hilly. Hefei has a subtropical semi humid continental monsoon climate, with an average annual temperature of 15.7ºC and an average annual precipitation of about 1000 mm. According to the statistical yearbook of Hefei, the Gross Regional Product of Hefei in 2022 was 1201.31 billion yuan, an increase of 3.5% over the previous year. The permanent population exceeded 9 million, and the total amount of urban domestic waste was 2.791 million tons. By 2022, Hefei had four districts and four counties under its jurisdiction, with one county-level city under its custody, including Yaohai District, Luyang District, Shushan District, Baohe District, Changfeng County, Feidong County, Feixi County, Lujiang County and Chaohu City.
Data and Preprocessing
This study obtained the data of municipal solid waste from Hefei Ecological Environment Bureau (http://zwgk.hefei.gov.cn/public/14011/106651511.html) and obtaining administrative division data from China National Geographic Information Resources Directory Service System (https://www.webmap.cn). The data of population density is from the seventh national census bulletin of Hefei Municipal People’s government (http://www.hefei.gov.cn/xxgk/gsgg/106488113.html) This paper selected 11 recycling centers (RC) and 110 recycling points (R1-R110) in Hefei as the research objects. According to the existing literature [23-25] and the data obtained through multiple calculations, the algorithm parameters in this paper are set as follows: population size inn = 110, maximum rank generation times of hybrid algorithm Max gen = 300, crossover probability Pc = 0.8, mutation probability Pm = 0.2, acceleration factor c1 = 3, maximum weight Wmax = 0.6, minimum weight Wmin = 0.3, elite rank generation times run max = 100, elite individual NN = 30, unit penalty coefficient ue = 50 for recovered vehicles arriving at the processing center, The unit penalty coefficient for the delayed return of recovered vehicles to the treatment center is ud = 40, the number of work cycles in one year is t = 365, the transportation costs between different levels are 5 yuan/ton/km, and the maximum load of recovered vehicles is qv = 400.
Reverse Logistics Network Model
When the intelligent recycling bins are fully loaded, a message can be sent to the recycling center. The recycling center will conduct centralized scheduling of recycling vehicles according to the number and distribution of fully loaded intelligent recycling bins [26, 27]. Model assumptions are as follows: First, the disposal enterprise has enough processing capacity to avoid garbage accumulation [28]. Second, there are multiple alternative transfer centers, waste incineration plants and landfill sites in the reverse logistics network. Third, the disposal center can make full use of the garbage with economic value, without waste in the economic sense. Fourth, the transportation distance of domestic waste has a linear relationship with the transportation cost [29]. Fifth, in the reverse logistics network, each layer works according to the process, and there is no override operation [30]. Sixth, consider a cycle of urban domestic waste treatment.
The definitions of symbols, parameters and variables related to the urban domestic waste reverse logistics network model are shown in Table 1.
In order to minimize the cost Z and maximize the product benefit W, the reverse logistics network model of municipal solid waste with fuzzy number was established:
(4)
(5)
Z1 is the construction cost of reverse logistics infrastructure.
Z2 is equipment maintenance cost.
Z3 is the transportation cost of municipal solid waste at all levels.
Z4 is the treatment cost of non-recyclable waste.
In the whole process of reverse logistics of MSW, the logistics volume of MSW is balanced.
Table 1.
Relevant definitions of variables and symbols.
In the reverse logistics network of municipal solid waste, the treatment center can maximize the upper limit of waste treatment.
In the reverse logistics network of municipal solid waste, landfills and incineration plants can maximize the upper limit of waste treatment.
The decision variable of the model is 0-1 variable, that is, the value range of the variable.
Transformation of uncertain recovery in the model. The membership function u(x) represents the membership degree of any number to this fuzzy set, and the expression is:
Q1a = (Ql, Qm, Qu) is used to indicate the recycling amount of the recycling center in a recycling cycle. The minimum recycling amount of the recycling center is Ql, the maximum recycling amount is Qu, and the most likely recycling amount is Qm.
GA-PSO Hybrid Algorithm Based on K-means Spatio Temporal Clustering
According to the characteristics of the model, the improved Manhattan distance [31] is used as the distance function in the three-dimensional network to evaluate the space-time distance between each cluster center and each recycling site [32, 33]. Establish a three-dimensional coordinate system including the geographical coordinates of intelligent recycling sites and the recycling service time window. According to the similarity of the geographical coordinates and service time of intelligent recycling sites, use the K-means clustering algorithm to assign each intelligent recycling site to the nearest clustering unit to obtain the clustering results [34, 35]. Assuming that (xi, xj) and (yi, yj) are the geographical coordinates of intelligent recycling bins I and j respectively, (mi, ni) and (mj, nj) are the service time windows of intelligent recycling bins i and j respectively, the distance between intelligent recycling bins is a fitness function:
Where φ Is the conversion factor between time and distance.
This paper designs the fitness of the algorithm with the objective function of maximizing the product revenue of the recycling center and minimizing the operation cost of reverse logistics, which can more effectively weigh the optimization degree of individuals in the hybrid algorithm. In the process of PSO algorithm and GA algorithm, set the fitness function as [36]:
Where: Z is the reverse logistics operation cost; W is the income of the recycling center.
The local mapping method [37, 38] was used for chromosome crossover. In the initial population generated by each cluster unit, individuals with large fitness value are selected as parent chromosomes by roulette method [39, 40] to perform chromosome local mapping crossover operation between cluster units and within cluster units. In the selected chromosomes, the subsequences at the corresponding positions are randomly determined as the crossover region, and then the local crossover operation is carried out. If the same gene exists in the same chromosome after crossover, it will be removed and the missing gene will be filled according to the parent chromosome, so as to generate two offspring chromosomes, and then select two optimal offspring chromosomes combined with the parent chromosome.
Results and Discussion
The GA-PSO algorithm based on K-means spatiotemporal clustering is applied to calculate the pricing combination schemes of discrete recycled products (Table 2) with the double objectives of maximizing the product revenue of the recycling center and minimizing the reverse logistics operation cost. At the same time, combined with the characteristics of the objective function, the ratio of the product revenue of the recycling center and the reverse logistics operation cost is used as the evaluation index for the optimization of the pricing combination scheme.
The ratio of recovery income to recovery cost of scheme 8 is 0.471, which is superior to other pricing schemes. Therefore, scheme 8 is the optimal pricing scheme. In addition, the product revenue of the recycling center in scheme 8 is 3986 yuan, the reverse logistics operation cost is 8469 yuan, and the unit recycling product price of product 1 in this scheme is 1.6 yuan, product 2 is 0.9 yuan, and product 3 is 0.6 yuan (Table 2).
In the optimal pricing scheme, firstly, the K-means Spatio-temporal clustering algorithm is applied to divide the recycling service cycle interval combined with the distribution characteristics of the time window of the intelligent recycling box (Table 3); Secondly, cluster the corresponding intelligent recycling bins with multiple recycling units in each recycling service cycle (Fig. 1).
Table 2.
Revenue and logistics network operation cost of recycling center under different pricing schemes.
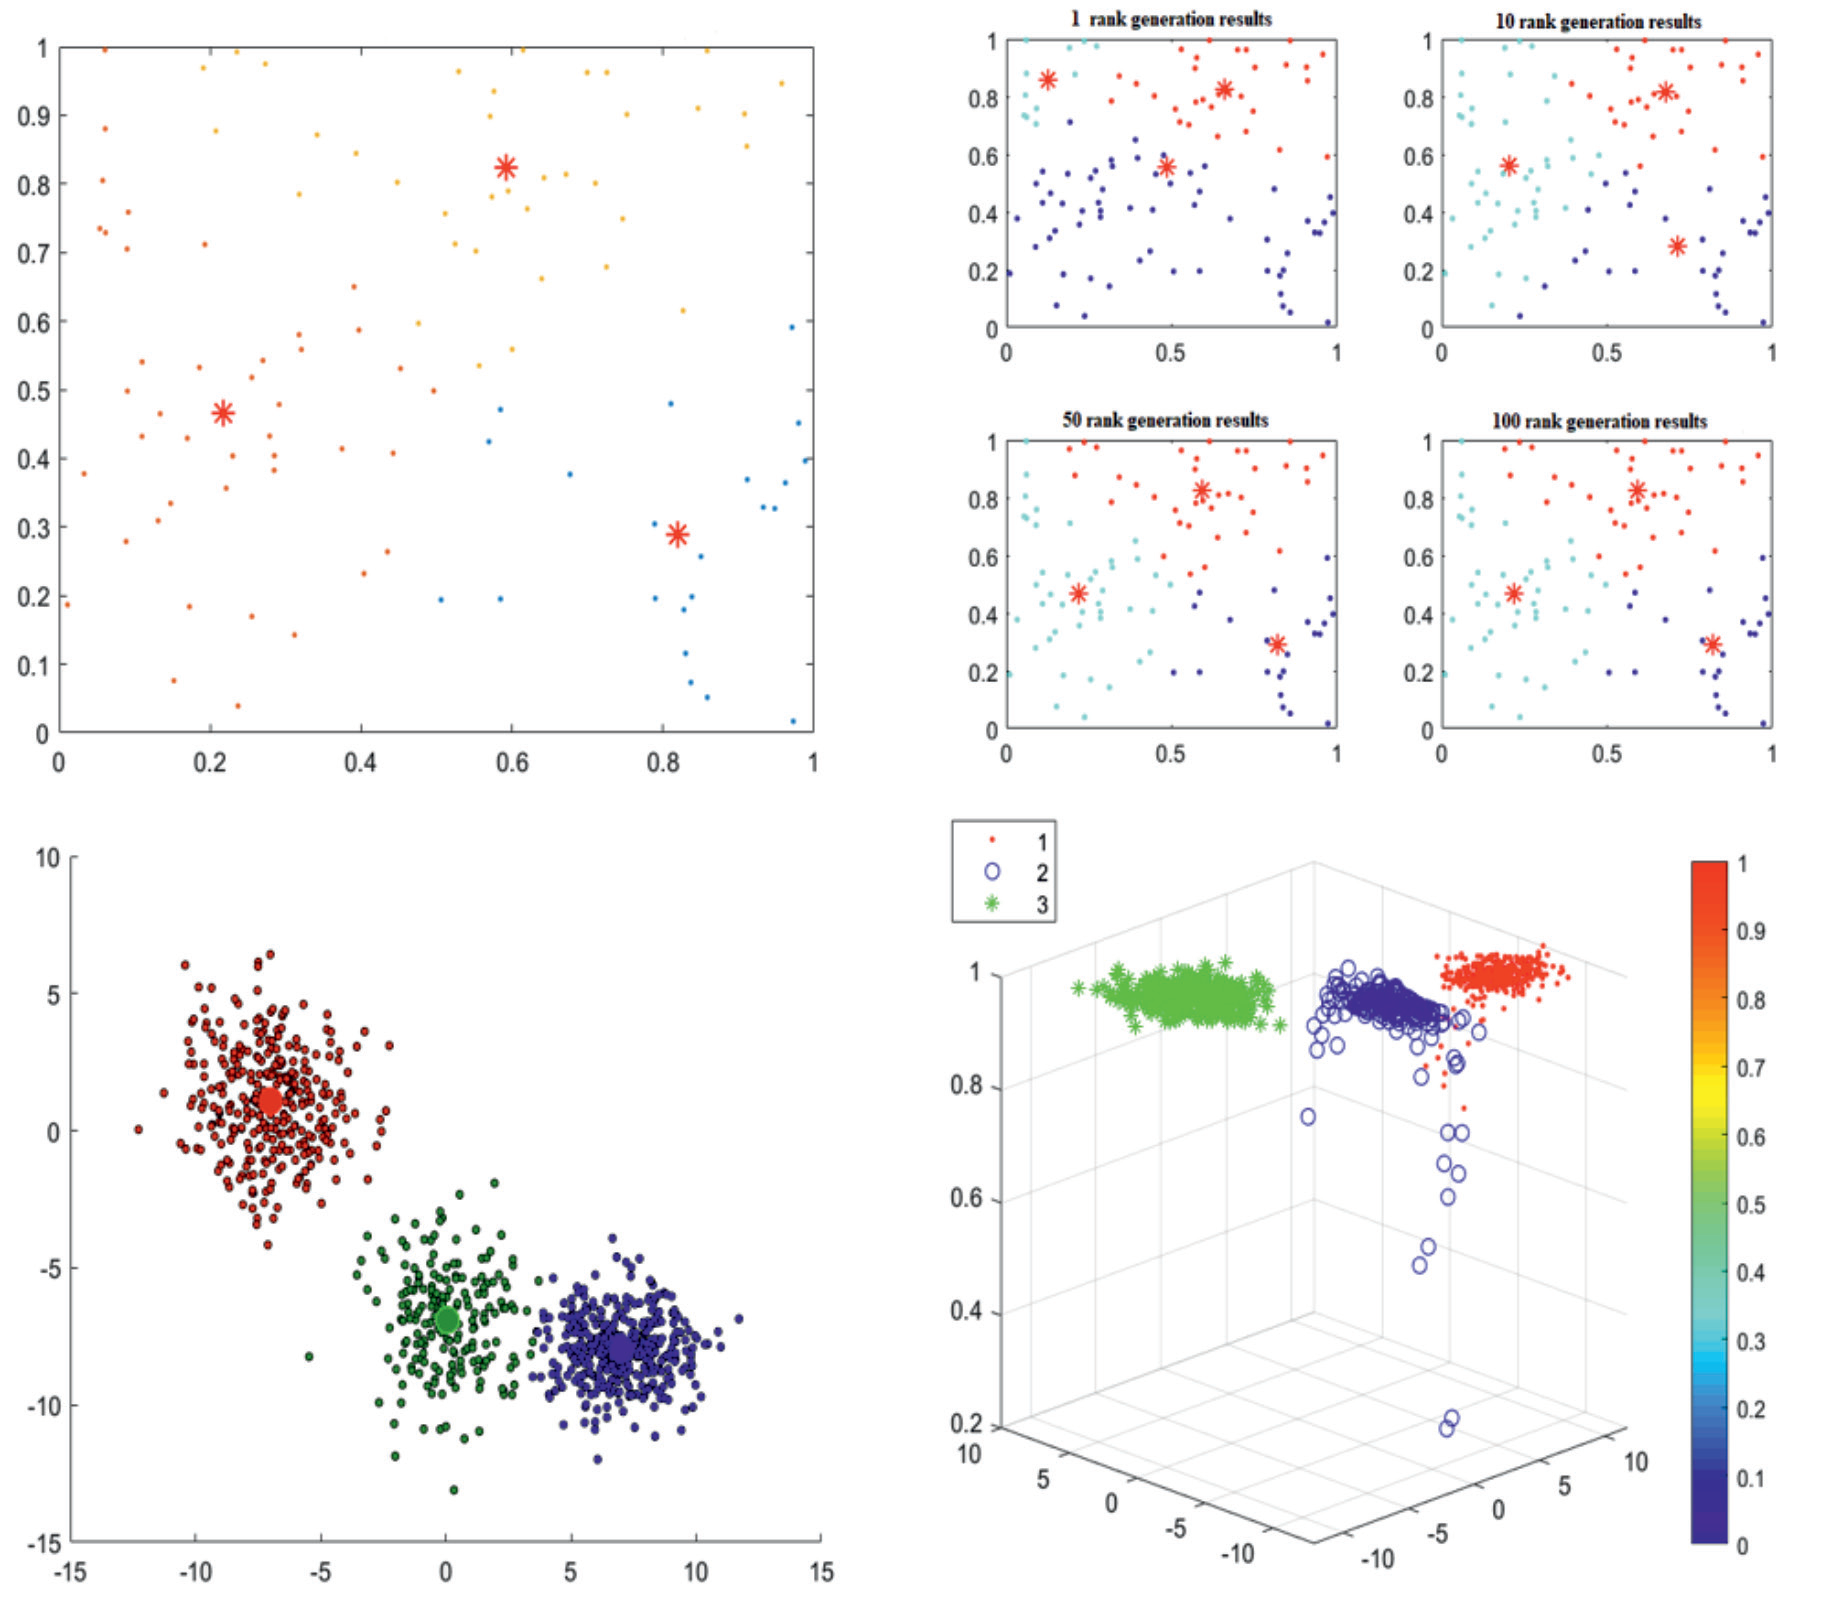
GA-PSO algorithm is applied in the recycling clustering unit to calculate the reverse logistics operation cost corresponding to each recycling service cycle and the revenue of different products collected by the recycling center in this scheme (Table 4). Select the number of vehicles used, logistics operation cost and product revenue of the recycling center within each recycling frequency for comparative analysis. The comparative analysis shows that the vehicle usage, logistics operation cost and product revenue of the recycling service cycle from 6:00 to 14:00 are higher than those of the 14:00 to 19:00 and 19:00 to 23:00. Among them, the number of vehicles used in the three recycling service cycles is 6, 4 and 2 respectively, the recycling cost of the recycling center is 4783 yuan, 3047 yuan and 1146 yuan respectively, and the product income of the recycling center is 2268 yuan, 1234 yuan and 507 yuan respectively.
The vehicle sharing scheduling strategy is applied in each recycling service cycle, according to the vehicle sharing situation and the optimized recycling route (Table 5). The results show that vehicles V2, V4, V5 and V6 are all involved in the shared vehicle recycling. Vehicles V4 serve the recycling cycle from 6:00 to 14:00, from 14:00 to 19:00 and from 19:00 to 23:00, while vehicles V1, V2 and V5 serve the recycling cycle from 6:00 to 14:00 and from 14:00 to 19:00, Other recovered vehicles only serve the recovery cycle from 6:00 to 14:00.
The GA-PSO algorithm based on K-means Spatiotemporal clustering is applied to calculate the product revenue and reverse logistics operation cost of the recycling center before and after the price adjustment of unit recycled products and the optimization of vehicle sharing scheduling (Table 6). Through the comparative analysis of the results, it can be seen that after the pricing adjustment of unit recycled products and the optimization of vehicle sharing scheduling, the pricing is adjusted to scheme 8 in Table 2. Under the condition that the recycling frequency and total recycling volume of the recycling box in the collection state are increased by 44.4%, the reverse logistics operation cost is effectively reduced by 8.8%, and the recycling income of the recycling center is relatively increased by 16.1%, The transportation cost and environmental externality revenue increased by 20.3% and 44.4% respectively, and the penalty cost for violating the time window decreased by 42.7% respectively.
Table 3.
Clustering scheme of intelligent recycling bins in each recycling service cycle.
Table 4.
Clustering scheme of intelligent recycling bins in each recycling service cycle.
Table 5.
Clustering scheme of intelligent recycling bins in each recycling service cycle.
Table 6.
Optimal layout results of reverse logistics network for municipal solid waste.
In order to further verify the superiority of the selected optimal pricing scheme and the rationality of multi frequency path optimization based on vehicle sharing scheduling strategy, the total amount of recovered products, transportation costs, time window violation costs, environmental externality benefits, reverse logistics operation costs and product benefits of the recovery center before and after the pricing adjustment of unit recovered products and vehicle sharing scheduling optimization were compared and analyzed (Table 6). The results show that although the transportation cost increases from 7318 yuan to 8692 yuan after the price adjustment of unit recycled products and the optimization of vehicle sharing scheduling, the penalty cost for violating the time window decreases from 3514 yuan to 2082 yuan, and the environmental externality benefit increases from 1956 yuan to 2891 yuan. Therefore, the operation cost of reverse logistics has been significantly reduced after the price adjustment of unit recycled products and the optimization of vehicle sharing scheduling, from 9498 yuan to 8526 yuan. At the same time, the substantial increase in the amount of recycled waste has increased the product revenue of the recycling center from 3421 yuan to 3997 yuan. Therefore, properly adjusting the pricing of unit recycled products and reasonably combining the pricing of different products, and combining with the vehicle sharing strategy to optimize the vehicle routing of reverse logistics with multiple frequencies, can effectively reduce the operating cost of reverse logistics recycling and bring higher benefits to the recycling center, thus effectively integrating resources and improving the recycling efficiency.
Conclusions
By constructing a linear function between intelligent recycling sites and recycling costs to analyze the situation of different pricing recycling volumes, and combining multi frequency recycling with vehicle sharing, a dual objective model was established to minimize reverse logistics operating costs and maximize product benefits of recycling centers. A GA-PSO hybrid algorithm based on K-means spatiotemporal clustering was designed to solve the model. This algorithm performs clustering operations based on the time window distribution and geographic location information of intelligent recycling sites, further improving the effectiveness of the hybrid algorithm.
The specific conclusions are as follows:
(1) Through Combinatorial optimization of different pricing of municipal solid waste recycling, the results show that the product income and total recycling volume of the optimized recycling center increased by 17.2% and 45.6% respectively, and the reverse logistics operating cost effectively reduced by 8%. The domestic waste treatment work in various regions can be carried out efficiently.
(2) Sensitivity analysis is carried out on the number of recycling shared vehicles for different types of domestic waste, the operating cost of reverse logistics network and the benefits of the recycling center. Combined with the vehicle sharing scheduling strategy, the recycling frequency can be increased and the number of vehicles can be kept unchanged, effectively reducing the operating cost of reverse logistics network.

