

Introduction
Phytosociology is an arch to describe the population dynamics, community structure, and diversity indices of plant communities [1]. A phytosociological study of the area gives a detailed explanation of the distribution pattern of species and their relationships between different plant communities [2]. The study of plant communities is the best way to learn about the habitat and vegetation structure of these communities [3]. Phytosociological methods often involve the quantitative understanding of various parameters like abundance, density, frequency, etc. [4]. The ecological properties of vegetation composition, like productivity, competition, niche structure, stability, and the relationship of plants in their community, are all determined by species diversity [5]. Such properties are often of critical ecological significance as they shed light on many interesting processes operating at the community level and provide an explanation of not only within-community patterns but also vegetation processes such as dynamics, stability, structuring, and functioning of communities and species diversity [6-9]. The species diversity of these communities is related to their structural habitat, which is supported by the internal and external function and potential of their habitat [10, 11].
Naturally, herbs serve as shelter and habitat for many animals and form the complex food chain and food webs [12-15]. Grasses provide shelter for a large number of microbial communities [16]. They also protect topsoil from soil erosion, improve water penetration into soils, and increase soil holding capacity [17-19]. Anthropogenic and multi-environmental factors affect species diversity, such as air, water, and other atmospheric factors [20-23]. Environmental factors, disturbance, dispersal ability and rate of plant species, and various ecological interactions determined the structure of the vegetation community in a complex ecosystem [24-26].
Humans, through overpopulation, exerted pressure on habitat destruction and reduced this influx [27, 28]. It was observed that agricultural land use in the study area affects plant composition and pattern [29, 30]. Making decisions for the conservation and management of floristic composition and structures of vegetation and biodiversity provides basic information to evaluate these results [10].
The aim of the present investigation was to analyze the phytosociological characteristics and diversity patterns of the herbaceous plants of the area, to measure the species diversity and its components for the phytosociological analysis, and to examine the environmental factors and anthropogenic pressure that were exerted on the herb layer of the study area as one of the main medicinal, economic, and fodder resources in Choti Zareen, Dera Ghazi Khan, Pakistan.
Material and Methods
Study Area
The study was conducted in Choti Zareen locality, 30 km south of the district of Dera Ghazi Khan, Pakistan, and 26 km east of the Koh-e-Suleiman range, extending from latitude 29°41`N to 29°52`N and from longitude 70°20` to 70°34`E (Fig. 1). The study area has a tropical monsoon and temperate climate, with high temperatures during the summer of about 50ºC, while during the winter the average temperature is 4ºC. The rainy season extends from July to August, with annual monsoon rainfall ranging from 87 to 165.83 mm. The field study was conducted from 2022 to 2023, covering both dry and rainy seasons. Eight vegetation sites were selected based on their physiognomy, topography, and altitude, representing vegetation variation (Table 1). The Choti Zareen supported plain, desert, fluvial, and wetland habitats, causing a large amount of plant diversity.
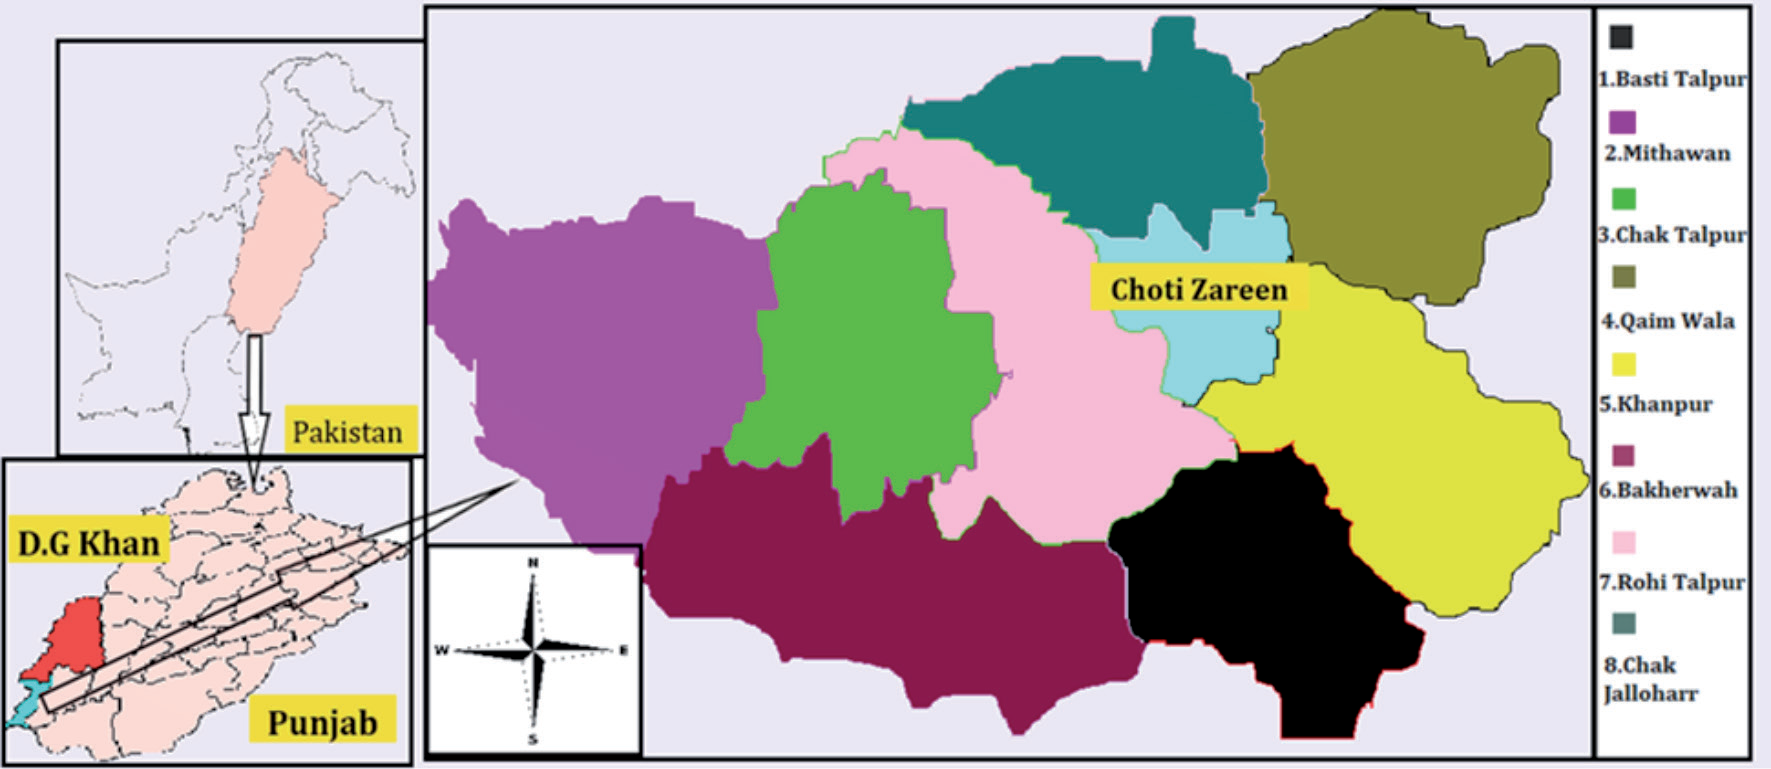
Table 1.
Coordinates, altitude, and soil type of the study sites.
Vegetation Sampling and Data Collection
At each of the 8 sites, random quadrate sampling was used to measure the herbaceous diversity of the study area. 50 quadrates (1 × 1 m) in size were randomly placed for sampling in each site, and a total of 400 quadrates were taken from 8 different sites. For the valuation of the dominance of plant species in the vegetation community, the density, frequency, and abundance, and were converted into relative values and summed to obtain statistical data. The importance value index (IVI) of the study area was calculated by the methods of Dangoli & Shivakoti [31] and Chaudhry et al. [32]. Species richness and evenness were determined in the studied sites, and species diversity was measured using the Shannon diversity index (H) [33]. The Pielou index was used for the estimation of species evenness (E) [34].
The vegetation analysis of the studied communities was analyzed for the Importance Value Index, which was obtained by Density (D), Frequency, and their relative values.
Diversity Indices
For the measurement of species diversity in herbaceous communities, commonly indices are usually used in ecology. The purpose of diversity indices was to measure species diversity and vegetation composition in plant communities [35]. For quantifying community diversity, indices provided an authentic and fruitful source, and they were useful in the analysis of the community structure of the plain and desert areas. Different types of diversity indices had been applied to contrast the plant species sampled from different sites. The general species diversity of the vegetation communities was measured by the popular Shannon– Wiener information theory function:
Where H is showing the Shannon diversity-index, which is general species diversity, Pi is the proportion of individuals in a community, ln is the natural log, taking the base e and expressed heterogeneity, and S denotes the total number present in the community [33, 36]. The variance of general diversity, Var (H), was calculated by Magurran [35], as follows:
General diversity consists of two diversity components: species richness and evenness. Species richness is expressed as S; the function ratio of the total number of individuals (N); and equitability (J) measures the evenness of the allocation of individuals among the species [35]. The evenness and its variance, Var (J), were measured in accordance with Pielou [37].
The equitability (J) is the ratio between observed H and maximal diversity H max. The variance of equitability was estimated as:
The Simpson Index determines the dominance of species. The formula for the Simpson index is:
Where D = Simpson’s Index, ni = the number of individuals of species I, and N = the total number of individuals.
Results and Discussion
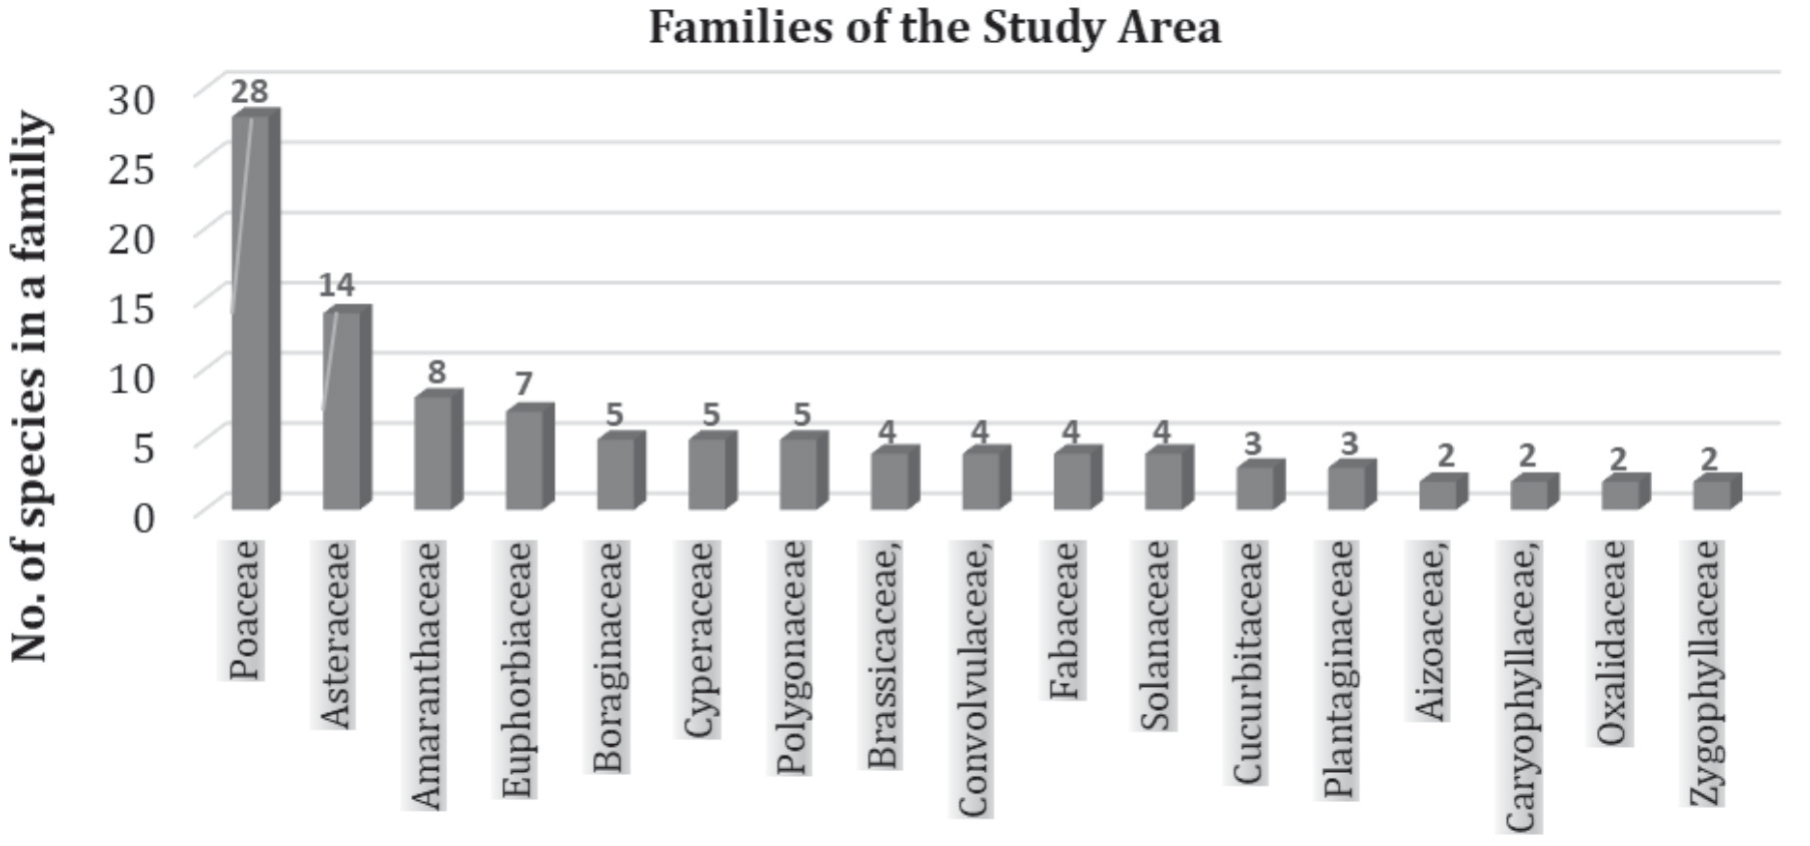
A total of 120 species, representing 92 genera from 35 families, were recorded from the studied area. Poaceae was the dominant family with 28 species, followed by Asteraceae (14), Amaranthaceae (8), Euphorbiaceae (7), Boraginaceae, Cyperaceae, and Polygonaceae (5 species each), Brassicaceae, Convolvulaceae, Fabaceae, and Solanaceae (4 species each), Cucurbitaceae and Plantaginaceae (3 species each), Aizoaceae, Caryophyllaceae, Oxalidaceae, and Zygophyllaceae (2 species each), while the other 18 families were represented by only one species (Fig. 2).
Table 2.
Vegetation composition of the herbaceous layer of various sites (Frequency (F), Relative Density (R.D.), and Relative Frequency (R.F.).
For the vegetation composition, a total of 5 species have been selected from each site with the highest density and frequency. In the present study, density (density/m2), relative density (%), frequency (%), and relative frequency (%) were calculated for all 120 species (Table 2). The result highlighted that the species Chloris flagellifera showed the highest density and relative density, followed by Chenopodiastrum murale in sites 2, 7, and 5, respectively. Whereas frequency and relative frequency were found highest from Chloris flagellifera in site 2, followed by Aerva javanica, Cenchrus ciliaris, and Eragrostis minor as compared to other sites (Table 2).
Fig. 3.
Vegetation composition with species diversity=H, species evenness=J, variance of evenness=Var(J), variance of diversity=Var(H), species richness=d1 and Dominance=D values of different sites (1= Achyranthes aspera, 2= Aerva javanica, 3= Aeluropus lagopoides, 4= Alternanthera sessilis, 5= Amaranthus deflexus, 6= Anagallis arvensis, 7= Asphodelus tenuifolius, 8= Boerhavia diffusa, 9= Carthamus lanatus, 10= Cenchrus ciliaris, 11= Chenopodiastrum murale, 12= Cleome brachycarpa, 13= Chloris flagellifera, 14= Chrozophora plicata, 15= Citrullus colocynthis, 16= Convolvulus arvenses, 17= Convolvulus prostrates, 18= Cressa cretica, 19= Crisium arvense, 20= Cynodon dactylon, 21= Cyperus rotundus, 22= Dichanthium annulatum, 23= Echinops echinatus, 24= Eclipta alba, 25= Eragrostis minor, 26= Euphorbia helioscopia, 27= Euphorbia hirta, 28= Euphorbia serpens, 29= Fagonia cretica, 30= Fumaria parviflora, 31= Galium aparine, 32= Glinus lotoides, 33= Heliotropium europoeum, 34= Heliotropium ovalifolium, 35= Imperata cylindrica, 36= Launaea nudicaulis, 37= Malcolmia Africana, 38= Medicago polymorpha, 39= Melilotus indicus, 40= Oxalis dilleniid, 41= Parthenium hysterophorus, 42= Persicaria glabra, 43= Phalaris minor, 44= Phragmites australis, 45= Phyla nodiflora, 46= Polypogon monspeliensis, 47= Ranunculus sceleratus, 48= Reseda villossa, 49= Solanum americanum, 50= Solanum virginianum, 51= Sonchus oleraceus, 52= Sorghum halepense, 53= Spergularia marina, 54= Taraxacum officinale, 55= Tribulus terrestris, 56= Typha angustifolia, 57= Vicia sativa, 58= Zaleya pentandra).
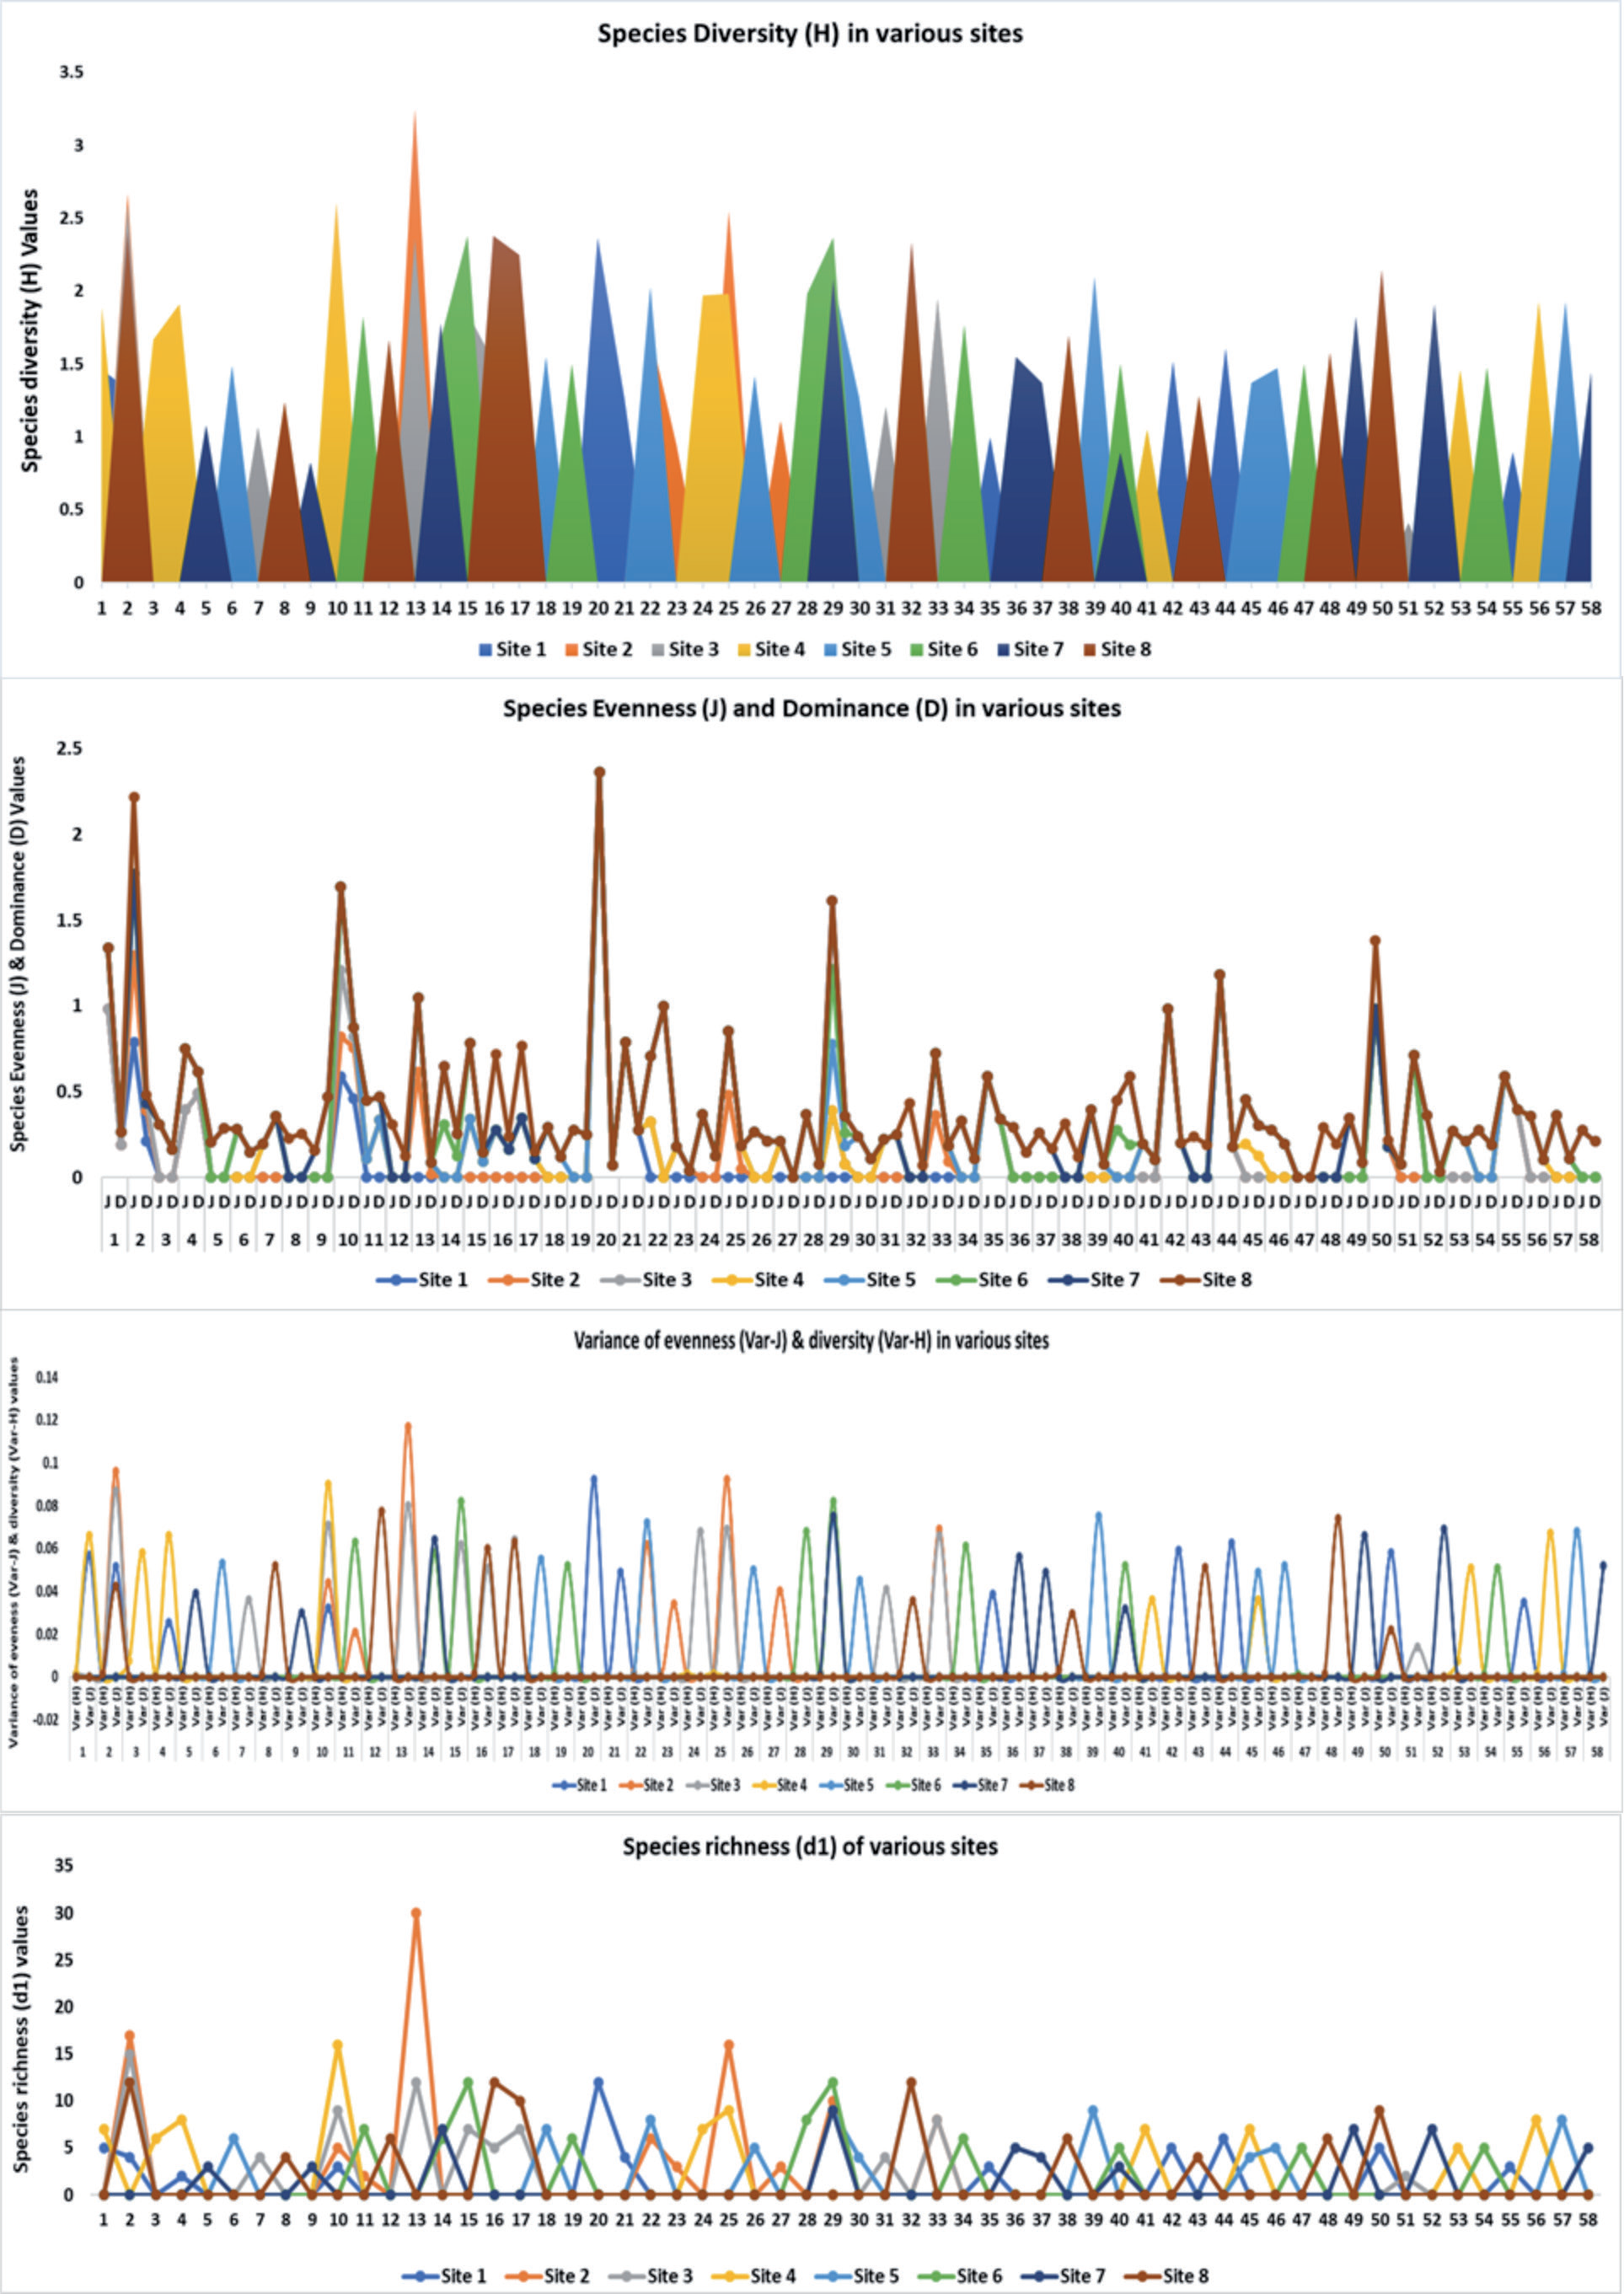
There are 10 important species selected with diversity indices from each site concerning their diversity pattern and conservation status at different sites. The result showed that the highest Simpson Index (D) was observed in Khanpur site no. 5 by Dichanthium annulatum because the study was conducted from December to April, which is the best season for its growth and yield production (Fig. 3).
The lowest Simpson index (D) was shown by Euphorbia hirta in site no. 2, Mithawan. Unusually, the overall highest Simpson index (D) is shown by Basti Talpur site no. 1 and the lowest by Mithawan site no. 2, which is the fluvial site. Mithawan is facing large grazing pressure, and agricultural activity is increasing day by day. Chloris flagellifera in site 2 had the highest general diversity (H) among all the sites, followed by Cenchrus ciliaris in site 4 and Aerva javanica in site 8 with Shannon diversity-index 2.61 and 2.41, respectively. The highest values of the Shannon Diversity-Index (H) in these sites indicate greater species richness and diverse community structure. Conversely, Sonchus oleraceus had the lowest 0.41 Shannon Diversity index in site 3 as compared to other sites. Across all sites, we observed that Aerva javanica had consistent Shannon Diversity-Index (H) values, which indicated its suitable habitat. In comparison to all sites, 4 and 5 had an even distribution of plant species. This means these are least disturbed by human impact, and these sites can maintain their diversity pattern through many ecological processes (Fig. 3).
The clear superiority in terms of species richness and evenness had been taken by Chloris flagellifera in site 2, followed by Cenchrus ciliaris and Aerva javanica in sites 4 and 3, respectively. The highest values of species richness and evenness of these species are an indication of dominance and adaptation in their respective ecosystems. In terms of even distribution and stability, the communities of site 4, site 5, and site 6 had the highest stability in their species richness and evenness in comparison to the other 5 sites, which had fluctuations between high and low in their values of species richness and evenness. Our observations of the diversity indices of each site indicated that a large number of dominant species in the study area are invasive, and the fluctuation of values between high and low for some species is proof of this phenomenon. The invasive species pose a major threat to the diversity of the area. The other reason is that the pressure exerted on many plant species, mainly fodder plants that belong to the Poaceae family, is because people of the study area are farmers in professions that have grazing animals like goats, sheep, cows, etc. and we know these animals consume more fodder and exert pressure on the natural vegetation of the study area (Fig. 4).
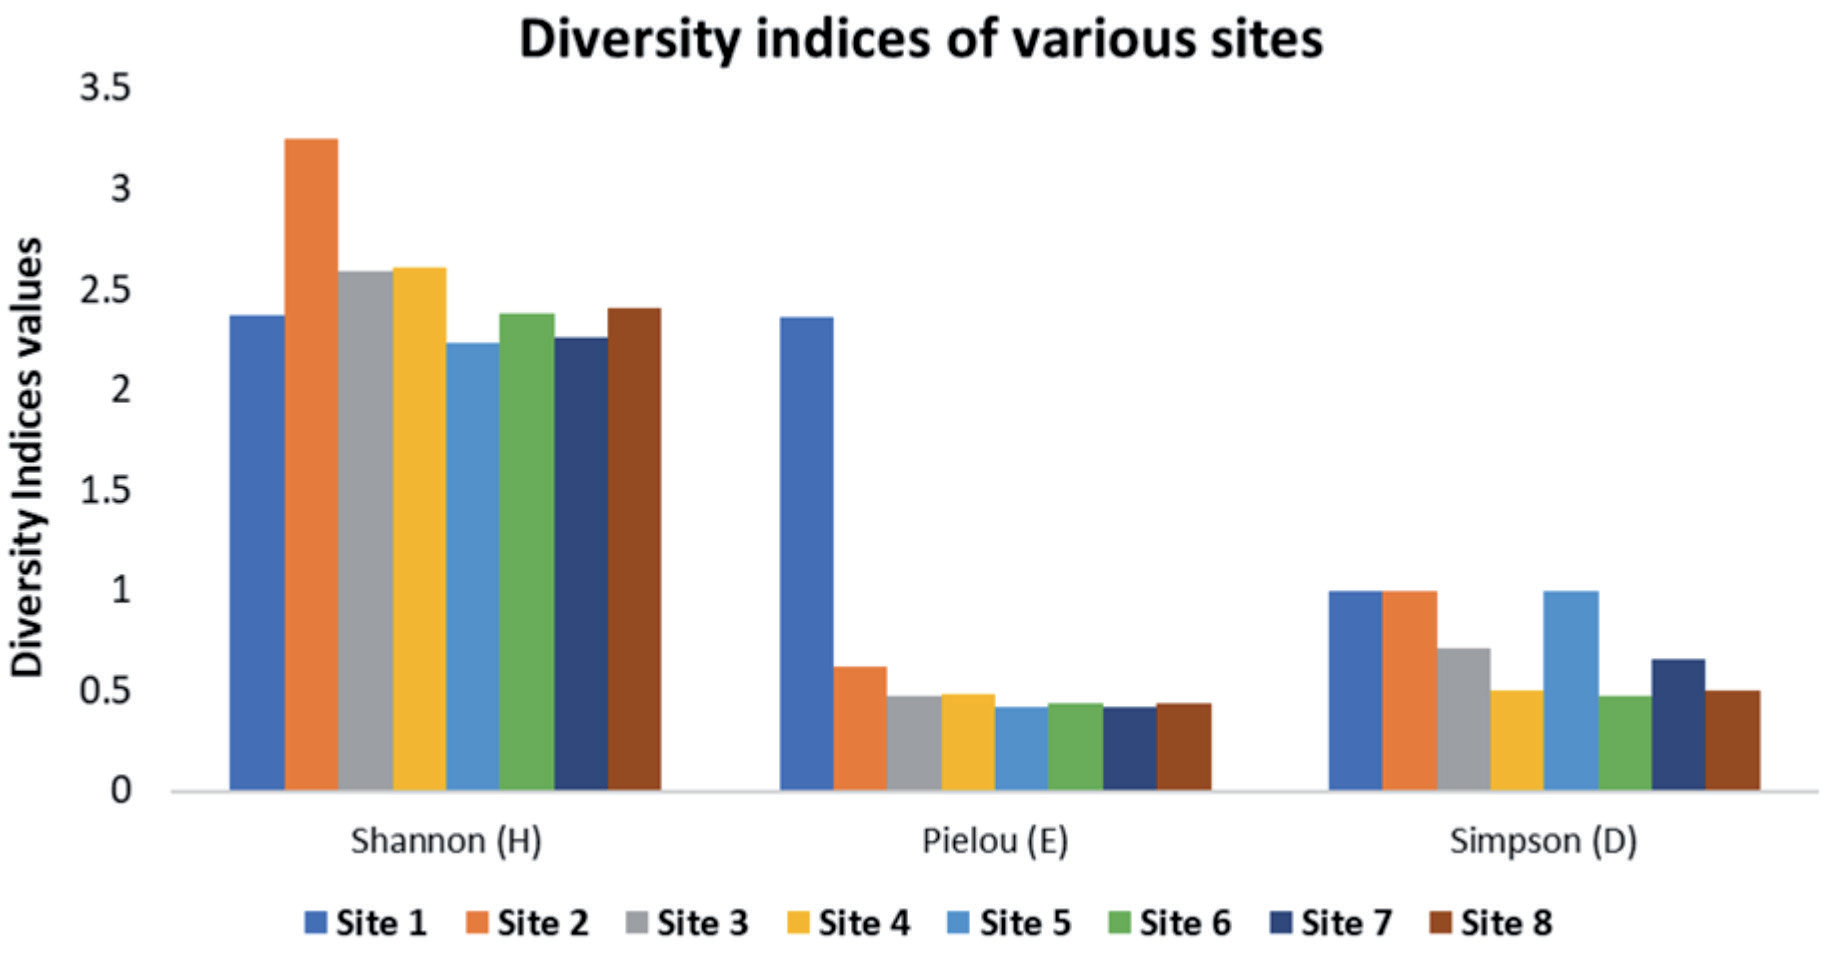
Table 3.
Importance Value Index (IVI) and random distribution pattern of recorded plant species from various sites (Ann.=Annual, Per.= Perennial, Fd. = Fodder, Med.= Medicinal).
The IVI values determined the dominance of species assigned on the basis of these IVI values. Chloris flagellifera was the dominant species, followed by Aerva javanica, Cleome brachycarpa, and Chenopodiastrum murale. The dominance of species indicated the fulfillment of suitable and desired conditions for ecological success in different studied sites. The random pattern (the distribution pattern) of plant species in different habitats was assessed, and the result revealed that 100% were randomly distributed (Table 3).
Dera Ghazi Khan Rangelands and their environments are home to a diverse array of plant species that flourish in a variety of habitats. There are two types of habitats in the research area: piedmont and alluvial. Dera Ghazi Khan is located in the Suleman mountain range and is extremely rich in floral variety. We identified the quantity and composition of communities in two historical locations, Piedmont and Riparian habitats, at various altitudinal inclines. The most significant source of habitat for floral variation is topographically diversified landscapes. Species diversity is also dramatically reduced at high altitudes compared to low altitudes [38]. Kenar & Kikvidze [39] reported that biological and evolutionary processes resulted in high species richness and served as corridors of plant and animal migration in the past. Site 1 had the highest density and relative density, and Site 4 had the lowest. Site 2 also had the highest frequency and relative frequency, and Site 6 had the lowest. Site 2 had the highest diversity indices value, and site 1 had the lowest. Poaceae has the greatest species diversity in all study sites due to the production of a large number of reproductive seeds and the many means of seed dispersion through grazing animals, fluvial water, and air. The magnitude of the diversity indices varied somewhat for different species, showing a low or high degree of aggregation where it was significant. Similar results were reported by Wang et al. [40]. Ahmad et al. [38] reported that a total of 76 species were predicted during the summer season. The maximum number of species belong to the Poaceae family, including Aristida adscensionis, Brachiari areptans, Cenchrus ciliaris, Cenchchrus setiger, Chloris barbata, Cymbopogon jawarancusa, Cynodon dactylon, Cynodon glabratus, Demostachya bipinnata, Dichanthium annulatum, Enneapogon persicus, Eragrostis minor, Eragrostis barrelieri, Panicum hemitomon, Panicum repens, Phalaris minor, Phragmites australis, Saccharum munja, Saccharum officinarum, and Saccharum spontaneum, and these are followed by the Fabaceae and Amaranthaceae families from Dera Ghazi Khan.
Plant scientists worldwide show a common interest in native plant species to predict new inclusive research investigations and ethnopharmacological, ecological, and phytoplankton studies skewed toward charismatic contributions [41, 42]. The phenotypic variation and systematic importance of flowering plants are investigated in different geographical regions of Pakistan to measure the functional diversity in restored ecosystems [43, 44]. As a result, the sources of floral scent variation and floristic diversity provide phylogenetic patterns as per the investigation of earlier researchers [45, 46]. According to Sharma et al. [47], the high species richness in the temperate ecosystem is an indication of better environmental conditions for the survival of plant communities, such as moderate temperature, proper seasonal rainfall, and moisture content that are desired for healthy plant growth. Evenness accounts for more variation in the Shannon diversity index (H), which is in agreement with Yadav & Sharma [48]. The highest species richness was also shown by Chloris flagellifera in Site 2, with an altitude of 190m. With respect to sampling, it must be noted that even in the case of random sampling, the quadrats may not be independent samples as the variation in species richness in the field may influence the quadrats (that may be species poor or species rich accordingly) situated in the vicinity of each other in species poor or species rich sections [49, 50]. Variances of diversity and equitability were not unexpectedly consistently low for almost all species, as has previously been observed by Ivashchenko et al. [51]. Species diversity may be important because of its possible role in the establishment and coexistence of species though, in some model systems it is found to play hardly any role in these processes [52]. Dominance concentration (D) was found to vary inversely with general diversity (H), which is in agreement with the results of Wang et al. [40], Ivashchenko et al. [51], Hussain et al. [53], Bashir et al. [54], and Wang et al. [69].
Variables influencing species diversity include not just abiotic and environmental characteristics, but also climatic gradients impacted by biotic factors [55]. Sustainable use and conservation of plant biodiversity are important for geo-climatic gradients to drive plant species composition, which plays an important role in how plant species assemble locally into communities [56, 57]. An integrated framework of plant structure and function is dependent on the amount of above-ground vegetation [58], which is more constant owing to some psychological processes, and this is fully dependent on regional climatic and edaphic conditions. Our findings are also consistent with previous research [59] undertaken by several plant ecologists across Pakistan’s diverse geographical zones. Herbaceous plants (55.26%) were the most prevalent living form in the alluvial environment of the research region.
The difference in IVI values of different species is due to their environmental conditions and anthropogenic activities around the sites. The wetland habitat is dominated by Typha angustifolia, Schoenoplectus lacustris, Juncus maritimus, and Phragmites australis. In addition, increasing anthropogenic pressures make Choti Zareen biodiversity a fairly sensitive and threatened ecosystem [60, 61]. Fieldwork is essential for phytosociological study and the calculation of diversity. Our devoted findings will help to extend the consensus and concentration of researchers to the herbaceous species of temperate ecosystems in Choti Zareen. In essence, the community under study is an early successional organized community [62, 63] with a low number of species. Species richness, as evaluated by the test proposed by Zhang et al. [64], showed variability within the different sections (or patches) of the community. Zhang et al. [65] explored the phylogenetic diversity and altitudinal patterns of species diversity across temperate mountain forests located in China. [66] examined the phyto-diversity distribution in terms of elevation gradient in Saudi Arabia. [67] conducted a study on the prediction of the soil seed bank of two different geographic arid zones (piedmont and alluvia plains) in Dera Ghazi Khan, Pakistan.
Our results also show consistency in these above-mentioned measures. It is interesting to note that [40, 51, 53, 54, 68, 69] also obtained consistency in the results of the three measures mentioned above. These three similarity measures are the most popular and are recommended for use in ecology.
Ahmad et al. [70] documented that the conservation of phyto-diversity in the Koh-Suleman range mountains has been neglected, especially at lower elevation piedmont zones (Sakhi Sarwar, lower foot hill arid zone) and upper rocky slopes located at high elevations (Fort Manru). There is a need to develop biodiversity conservation strategies for all plant communities and their habitats with the establishment of topographic preferences of these species, especially in the Koh-Suleman range mountains of Gera Ghazi Khan, Pakistan.
Conclusions
The findings of the current study concluded that the study area has 120 herb species, representing 92 genera and 35 families. Poaceaceae and Asteraceae are the dominant families, according to IVI. The dominant species, according to IVI, are Chloris flagellifera and Aerva javanica. The Shannon diversity index (H) is also moderate for this study area in all sites of herbaceous diversity, but the dominant species, Chloris flagellifera, showed the highest diversity, followed by Aerva javanica. The result of this research shows that phytosociological diversity is dominant, and their distribution is favored by vegetation that has larger seed production, well-adaptive mechanisms of seed dispersal and competes for basic needs such as soil nutrients. While phytosociological diversity and distribution patterns were distracted by anthropogenic activities and environmental pressure, from this study, it is concluded that the present status of the herbaceous layer in Choti Zareen, Dera Ghazi Khan district, is satisfactory. But in the future, a lot of challenges will be faced with the diversity of herbs if grazing and anthropogenic activity continue in their present form.

