

Introduction
Municipal Solid Waste Management (MSWM) has become a critical environmental challenge for countries worldwide, particularly in the European Union (EU). The EU has taken significant steps to address this issue through the Waste Framework Directive (WFD) – Directive 2008/98/EC, amended by Directive (EU) 2018/851 [1]. These directives aim to promote waste prevention, recycling, and sustainable environmental waste management practices across EU member states.
The WFD has introduced several key stipulations that EU member states must implement in their national waste legislation. These include measures to increase waste incineration with energy recovery, enhance recycling techniques, and minimize landfilling. Furthermore, the directive encourages the design, production, and use of products that are resource-efficient, durable, repairable, reusable, and updatable. A guiding principle in EU waste legislation and policy is the ‘waste hierarchy,’ which prioritizes waste prevention, preparation for re-use, recycling, other recovery (e.g., energy recovery), and disposal as a last resort.
In line with the circular economy transition, the WFD, Article 11 M4, has set ambitious municipal waste recycling targets: 55% by 2025, 60% by 2030, and 65% by 2035. Additionally, it mandates limiting landfilling to a maximum of 10% of municipal waste by 2035 and strengthens the obligation for separate collection of hazardous household waste, biological waste, and textiles.
Slovakia, as an EU member state, has transposed these directives into its national legislation, primarily through the Waste Act No. 79/2015 Coll. [2] and strategic documents such as the Waste Management Program of the Slovak Republic for 2021-2025 [3] and the Greener Slovakia: Strategy of Environmental Policy of the Slovak Republic until 2030 [4]. However, there are slight variations in the targets set by these national strategies compared to the EU targets [5]. For instance, WMP SR aims for a 60% sorted collection rate and a 55% recycling rate by 2025, while Envirostrategy 2030 targets a 60% recycling rate and less than 25% landfilling by 2035 [3, 4]. Additionally, a national program should be implemented in the Regional Waste Management Programs prepared by all Slovak district offices in the seat of the regions.
In Slovakia, the responsibility for MSWM lies with local self-governments or municipalities. According to Act No. 79/2015 Coll. on waste [2], municipalities are responsible for managing municipal waste, which includes mixed waste, separate collection of waste from households and other sources, as well as small construction waste. The financing of MSWM is regulated by Act No. 582/2004 Coll. [6], which stipulates that natural and legal persons residing or registered within the municipality must pay local fees for municipal waste and small construction waste. These fees are exclusively used by the municipality for the collection, transport, recovery, and disposal of waste.
To optimize resources and efficiency, municipalities, especially smaller ones, are encouraged to cooperate in waste management. Act No. 369/1990 Coll. [7] allows municipalities to form associations or establish legal entities for specific tasks like waste management. A notable example is the Ponitrian Association of Municipalities for Separate Collection and Waste Management [8], comprising 57 municipalities in the Nitra Region, which aims for comprehensive and effective waste management.
Despite these efforts, landfilling remains the most common waste disposal method in Slovakia, with some of the lowest landfill fees in the EU [9]. To address this, strategies like [4] propose gradually introducing volume-based waste collection fees to incentivize waste sorting and prevention.
Given this context, the primary objective of this study is to assess the efficiency of municipal solid waste management (MSWM) across all 2,887 municipalities in Slovakia for the period 2017 to 2021, with a specific emphasis on evaluating compliance with European Union (EU) and national waste targets set for 2025 and 2035. To achieve this, the study develops a novel methodological framework by constructing composite efficiency indicators that directly incorporate these regulatory targets into the assessment process. This is accomplished through the application of Data Envelopment Analysis (DEA) with Assurance Regions Type I, ensuring a rigorous and systematic evaluation of MSWM efficiency.
Beyond efficiency assessment, the study aims to achieve the following specific objectives:
1. To analyze the impact of waste pricing mechanisms on MSWM efficiency, examining whether municipalities that adopt volume-based pricing systems demonstrate higher efficiency levels compared to those using flat-rate pricing models.
2. To evaluate the influence of municipality size on waste management performance, determining whether larger municipalities benefit from economies of scale and resource availability, leading to greater efficiency.
3. To investigate regional disparities in MSWM efficiency by assessing the role of variations in the implementation of national waste management programs across different regions.
4. To assess the effect of population education levels on MSWM efficiency, exploring whether higher levels of environmental awareness and knowledge contribute to improved waste disposal practices and higher recycling participation rates.
By addressing these research objectives, the study seeks to gain insights into how well Slovak municipalities are progressing toward EU and national waste targets and provide empirical evidence on the external determinants influencing MSWM performance. The findings will serve as a valuable resource for policymakers and local authorities in designing more effective waste management strategies that enhance operational efficiency and promote long-term sustainability across Slovak municipalities.
Literature Review
The body of literature on municipal waste management performance is extensive. Simões and Marques [10] conducted a comprehensive review of 107 studies published from 1965 to 2011, offering a thorough overview of the topic. In the subsequent decade, numerous studies have continued to explore various aspects of waste management performance.
The majority of these studies evaluate MSWM performance at the national or regional level, particularly within EU member countries or EU NUTS2 regions. These studies frequently use Eurostat or OECD datasets to compare geopolitical entities using partial or composite indicators. Examples of such studies include [11-19]. In addition to intra-EU comparisons, some studies extend the analysis to international contexts, comparing MSWM performance between the EU and other major economies such as China and the USA. These comparative studies highlight variations in waste management policies, efficiency levels, and technological approaches, reflecting differences in regulatory frameworks, economic conditions, and sustainability priorities. Notable examples of such research include [20-24].
While these studies provide valuable insights, the number of research studies focusing on MSWM performance at the municipal level is lower, primarily due to data limitations. Most studies at this level are based on samples of municipalities. Significant examples of such studies include [25-36]. Studies using data from entire populations of municipalities are rare, with [37] being a notable exception.
Published studies focused on MSWM efficiency employ a relatively wide range of methods for estimating efficiency measures. While waste treatment-specific indicators are frequently used, their ranking ambiguity has led to the adoption of more sophisticated methods that enable the estimation of composite indicators.
Multiple Criteria Decision Making (MCDM) methods are widely used across various fields, including waste management, due to their flexibility in handling multiple, often conflicting criteria. MCDM methods like AHP (Analytic Hierarchy Process), TOPSIS (Technique for Order Preference by Similarity to Ideal Solution), and PROMETHEE (Preference Ranking Organization Method for Enrichment Evaluations) are commonly used to evaluate and rank municipal waste management practices, technologies, and policies. The advantage of MCDM methods lies in their ability to incorporate expert judgment and assign importance weights to waste treatment methods, reflecting the waste hierarchy. However, a primary limitation is that they typically produce only a ranking of the analyzed units, without the ability to express the performance improvement potential of the analyzed units. Valuable insights into the use of MCDM methods in waste management are provided in review works [38-41]. Additionally, a recent study on MSWM performance in Slovakia is available in [42].
A mathematical programming approach to estimate MSWM performance composite indicators is one of the most prevalent in recent studies. Several standard nonparametric methods are included in this approach. Data Envelopment Analysis (DEA) is frequently used for its focus on efficiency and benchmarking. DEA and its derivatives have become important efficiency estimators both in cross-sectional and intertemporal analyses. They enable work with both desirable and undesirable variables, representing desirable and undesirable waste treatment methods, distinguishing weak and strong disposability, and controllable and non-controllable variables when dealing with waste inputs and/or outputs according to their managerial controllability. Notable studies of this nature are studies [17, 18, 26, 29, 43-50].
When alternative technologies are used in MSWM, the DEA metafrontier methodology is a useful tool to estimate their net impact. Notable applications of this methodology include [19, 35, 47, 51].
Another valuable but less commonly used method is the Benefit-of-Doubt (BoD) method, derived from the DEA. It corresponds to the DEA model only with outputs, without considering the input side. In assessing MSWM, it was used in [19, 52].
Directional Distance Functions (DDF) is a useful methodology when dealing with undesirable outputs under alternative assumptions of their disposability. DDF can be estimated using DEA, and this approach was applied in [19, 26, 27, 35, 49, 51].
Free Disposal Hull (FDH) is less restrictive compared to DEA because it does not require a convexity assumption, which makes it suitable for complex processes. By using actual observed data points to construct the frontier, FDH provides realistic benchmarks based on best practices. In MSWM, FDH was employed in [18, 53].
All the aforementioned methods are non-parametric. However, a substantial body of research on MSWM efficiency also utilizes parametric approaches, primarily regression analysis and a key parametric alternative to DEA known as Stochastic Frontier Analysis (SFA). Regression analysis is frequently used in the second stage to examine the impact of endogenous factors on estimated efficiency measures [54]. In recent years, the two-stage DEA has gained popularity, particularly with the adoption of the double-bootstrap procedure introduced by Simar and Wilson [55], with applications in the MSWM sector found in [36, 56-59]. SFA, in contrast, integrates both stages into a single framework. It relies on a predefined functional form of the production function and is more complex to implement and interpret than DEA. Notable studies applying SFA in MSWM efficiency analysis include [60, 61].
Key discussions in modeling MSWM performance focus on incorporating the waste hierarchy through appropriate weighting of output variables [44, 62], classifying model variables as desirable or undesirable, free disposable or weak disposable [48], and distinguishing between controllable and non-controllable factors [26]. While previous studies have addressed these aspects individually, our research makes a significant contribution by integrating all these critical elements simultaneously. By applying the DEA AR-I model, as proposed by Thompson et al. [63], we provide a novel approach that embeds waste hierarchy principles directly into the efficiency assessment model via output weights. This advancement not only bridges a key gap in the existing literature but also offers a more comprehensive and robust framework for evaluating MSWM performance, setting a new standard for efficiency analysis in the field.
Materials and Methods
Methodology
In this study, we conceptualize the municipal solid waste management system as a dynamic process that involves the conversion of the total municipal solid waste (MSW) generated by the residents of a municipality into four primary waste treatment streams (Fig. 1). This transformation is a result of waste sorting activities conducted both at the household level and within the municipal infrastructure. Following the waste hierarchy and strategic goals outlined by the EU and Slovakia, we classify waste treatment processes as either desirable (all types of recycling, incineration with energy recovery) or undesirable (landfilling). Waste strategies aim for a minimum recycling rate of 60% and a maximum landfilling rate of 10%.
We posit that the performance of the municipal solid waste management system is determined by the waste sorting rates and costs, and influenced by external factors.
As a primary measure for evaluating the performance of municipal solid waste management, we utilize the composite indicator of technical efficiency, employing Data Envelopment Analysis (DEA). To assess changes in solid waste management performance between 2017 and 2021, we utilize Malmquist DEA-based metrics, including total performance (productivity).
In our DEA analysis, depicted in Fig. 1, we presume 2 inputs and 4 outputs. The first input encompasses the total municipal solid waste generated by the municipality, managed within the municipality’s waste management system. We assume that the total municipal waste generation is, from a short-term perspective, a non-controllable variable, meaning that municipality managers lack direct control over it. Management and processing of municipal waste incurs costs, which we classify as the second input, primarily consisting of expenses related to the collection and processing of residual waste. These costs are covered by fees paid by the municipality’s residents, directly influencing the level of waste sorting within the municipality.
The four DEA outputs represent the primary waste treatment methods for processing municipal solid waste (MSW): material recycling, composting and digestion (biological recycling), incineration with energy recovery, and landfilling. Each of these outputs is considered controllable, as municipal management can regulate waste distribution among these treatment streams. This controllability justifies the use of an output-oriented DEA model.
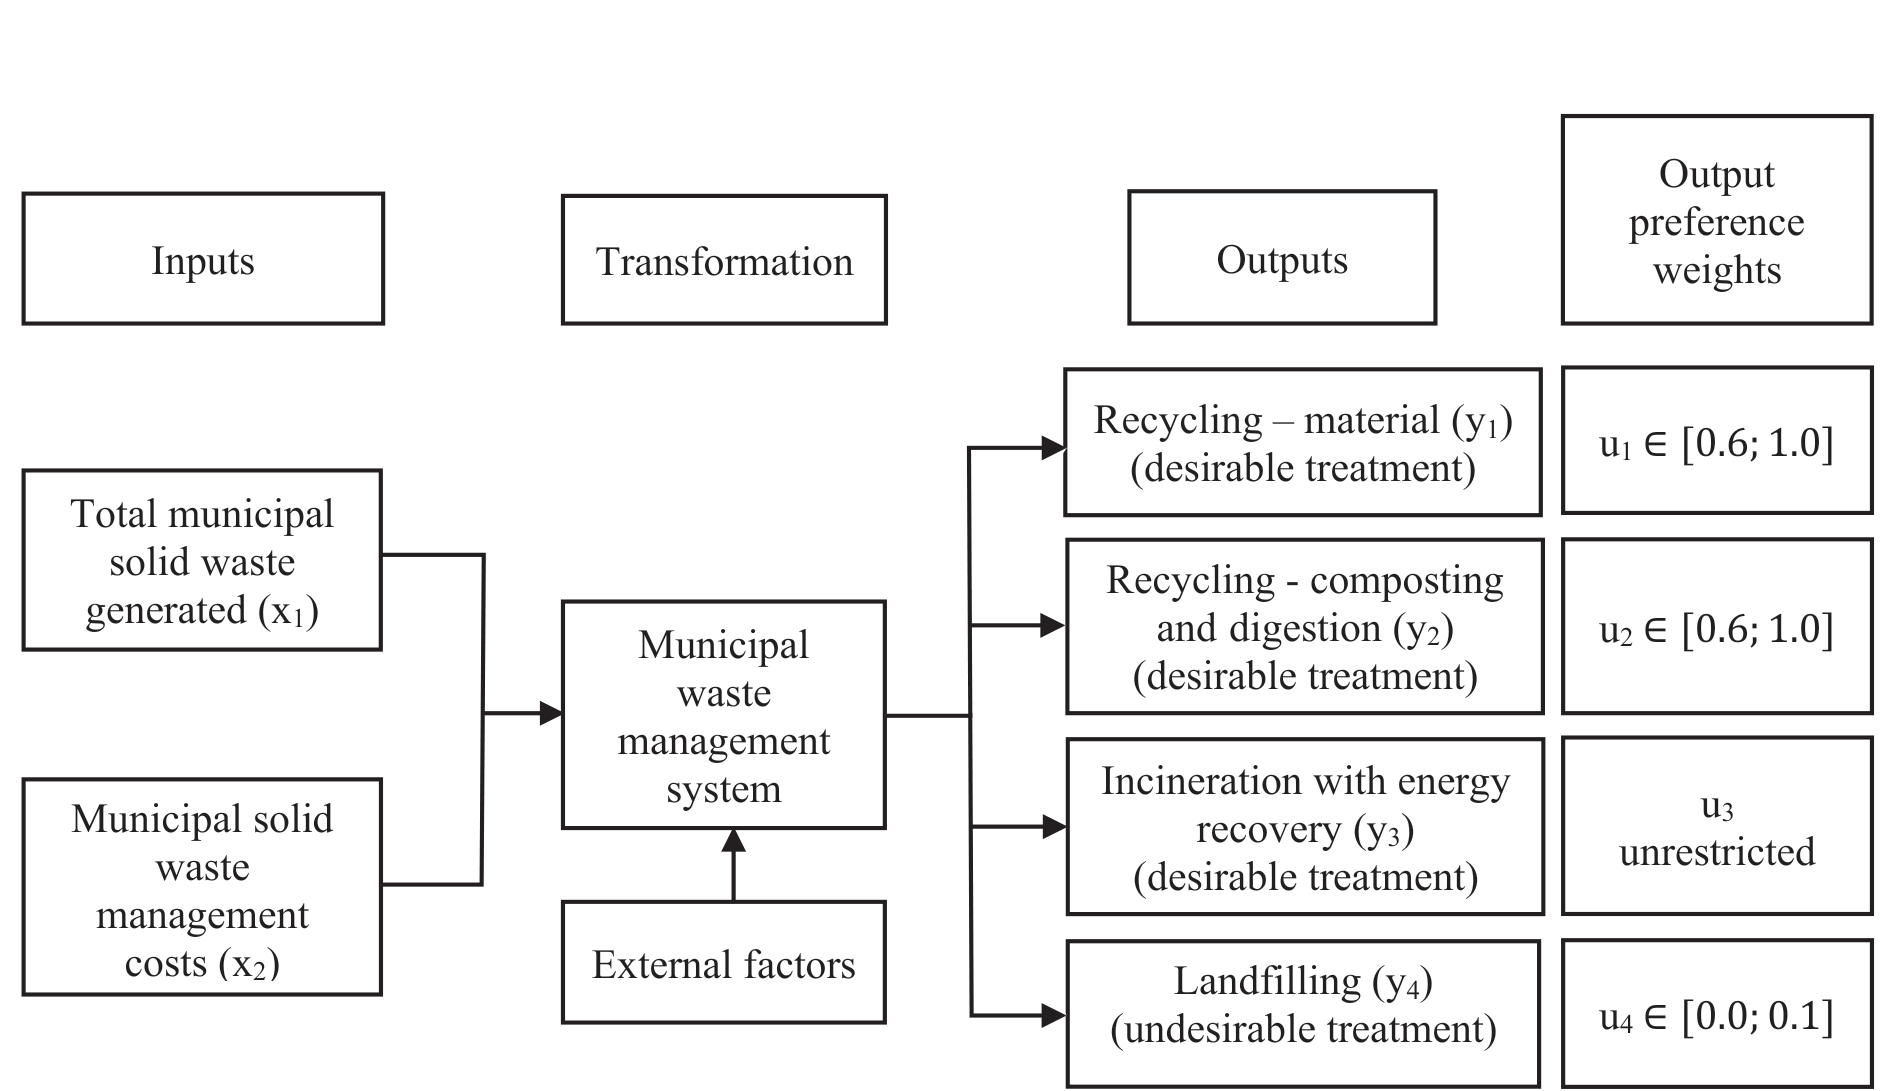
According to the waste hierarchy outlined in the Waste Framework Directive 2008 [1], waste treatment operations are classified as either recovery (desirable) or disposal (undesirable). Following this classification, we categorize our outputs into desirable treatments - material recycling, biological recycling (composting and digestion), and incineration with energy recovery - and the undesirable treatment, landfilling.
Character of output variables led us to select a DEA model that combines desirable and undesirable outputs. In standard DEA, we assume the minimization of inputs and the maximization of outputs. In order to maximize only desirable outputs and to minimize undesirable outputs, the undesirable output of landfilling is subjected to a linear monotone decreasing transformation (Eq. (1)) as proposed by Seiford and Zhu [64].
where y̅ r is the undesirable output vector, w is a proper translation vector that makes yr>0. That is, we multiply each undesirable output by (-1) and find a proper translation vector w to convert all negative undesirable output’s data to positive data.
Since a reduction in undesirable output (landfilling) does not lead to a reduction in desirable outputs (recycling and incineration with energy recovery), we assume strong disposability of the undesirable output.
To evaluate the efficiency of waste management in municipalities with respect to EU and Slovakia waste targets, we introduce a novel approach that translates waste hierarchy preference information into the DEA output variable weights. For this purpose, we employ the DEA Assurance Region model, which combines the original multiplier CCR DEA model proposed by Charnes, Cooper, and Rhodes [65] with constraints for weight restrictions. In Eq. (2), we present the formal notation of the original CCR DEA model in its output-oriented form.
We assume that we have n municipalities (MUN), each using m inputs and generating s outputs. Let X∈ℜ+m×n (xij>0, i = 1, 2, …, m, j = 1, 2, …, n) and Y∈ℜ*s×n (yrj≥0, r = 1, 2 ,…, s, j = 1, 2,…, n) be the matrices, consisting of positive and non-negative elements, containing the observed input and output quantities for the municipalities, respectively. We denote by xj (the jth column of X) the vector of inputs consumed by MUNj, and by xij the quantity of input i consumed by MUNj. A corresponding notation is used for outputs. Index “o” is associated with the municipality under observation (MUNo).
To capture preference information on waste target rates for specific waste treatment methods, we incorporate weight restrictions for outputs into the DEA model. In absolute form, these weight restrictions are expressed in Eq. (3):
The first and second restrictions correspond to the EU 2030 target to recycle at least 60% of municipal waste. The third restriction considers the EU 2035 target to landfill a maximum of 10% of municipal waste [1]. Incineration with energy recovery is generally considered as a desirable waste treatment method, but is not restricted in the EU/Slovakia target rates.
Due to the likelihood of DEA models with absolute weight restrictions resulting in infeasible solutions [66, 67] in our analysis, we implemented weight restrictions in the form of weight relations, known as Assurance Regions Type I (AR-I), as proposed by Thompson et al. [63]. This approach is formally articulated in Eq. (4):
Here, uh denotes multipliers that act as “numeraires” in establishing the upper and lower bounds, represented by Lr,h and Ur,h, for the multipliers associated with outputs r = 1, ..., s.
We utilize the AR-I constraints (4) rewritten to a linearized form, as expressed in Eq. (5):
The optimal values of technical efficiency scores, φ, in the CCR AR-I DEA model (Equations (1) and (4)), are greater than or equal to unity. In this study, we interpret their reciprocals, 1/φ, which vary within the range of 0 (indicating the worst-performing MUN) to 1 (indicating the best-performing MUN). When multiplied by one hundred, this measure indicates, in percentage terms, the extent to which the municipality under observation, MUNo, is achieving MSWM performance compared to the best-performing municipalities and in relation to waste targets.
In our study we analyze MSWM performance development within the 5-year period 2017-2021. The performance change of each municipality is measured by Malmquist productivity index (MPI) introduced by Caves, Christensen, and Diewert [68], here referred as CCD, which is based on estimation of the Shephard [69] output distance functions.
We assume that for each time period t = 1, ..., T, the production technology St models the transformation of inputs, xt∈ℜn+, into outputs, yt∈ℜm+, St = {(xt, yt): xt can produce yt}
The output distance function is defined at t as Dot (xt, yt) = (sup{φ: (xt,φyt)∈St})∈–1
This distance function is defined as the reciprocal of the TEo = φ, expressed in model (2).
In this study we employ output-oriented MPI developed by Färe et al. [70] as a geometric mean of two CCD-type indexes. For that purpose we estimate four distance functions with respect to two different time periods such as Dot (xt, yt), Dot+1 (xt+1, yt+1), Dot (xt+1, yt+1), and Dot+1 (xt, yt). Then Malmquist productivity index is given by the Eq. (6):
An equivalent notation of the Eq. (6) is given in the Eq. (7):
(7)
We decompose MPI into 2 components. The ratio outside the brackets measures the change in efficiency (i.e., the change in how far observed productivity is from maximum potential productivity) between years t and t + 1. Here, it is referred to as technical efficiency change (TEC). The geometric mean of the 2 ratios inside the brackets of Eq. (7) captures the shift in technology between the 2 periods. It is known as technical or technological change (TC) and refers to an improvement or worsening of the state of technology. It can be interpreted as providing evidence of innovation for the MUN considered.
A municipality has improved its productivity over time if MPI>1; whereas it has suffered deterioration in productivity if MPI<1. An MPI = 1 means that productivity is stagnating over time. For the components of the MPI, i.e., TEC and TC, the same interpretation applies.
In the second stage of our analysis, we examined the impact of several external factors on MSWM performance. We utilized nonparametric statistical techniques such as the Mann-Whitney test and Kruskal-Wallis test to test for differences, and regression analysis to examine relationships. The factors analyzed include: pricing method for waste collection, municipality size, regional MSWM programs, education level of the municipality population.
Data and Variables
In this study, we analyzed data from 2,887 municipalities out of a total of 2,890 municipalities in Slovakia (excluding three municipalities in military districts). We utilized two primary sources of data. The first source was the dataset created from annual reports on municipality waste “ŽP 6-01”, obtained upon request from the Statistical Office of the Slovak Republic (SOSR). These reports are outcomes of annual surveys conducted under the title “Annual questionnaire on municipality waste ŽP 6-01” [71], in accordance with Decree No. 291/2013 Coll. of the SOSR on the Program of State Statistical Surveys for the years 2015 to 2017 [72]. The second source comprises open data of the Slovakia 2021 Population and Housing Census, accessible on the website of the SOSR [73].
In the analysis, we utilized 7 variables from the Report ŽP 6-01 for the years 2017 to 2021, and 4 variables were extracted from the Slovakia 2021 Census. Table 1 presents all variables used in the analysis. To address missing data on the costs of 54 municipalities, we conducted a simulation, using panel data spanning the 5-year period, employing simple regression analysis. Table 2 displays the descriptive statistics of the variables used in the analysis.
Results and Discussion
Composite Indicators of MSWM Performance
First, we present the results obtained in the initial stage of our analysis, which focused on the calculation of composite indicators of MSW management performance of municipalities in Slovakia. All indicators align with strategic targets set for recycling and landfilling in the EU and Slovakia for the years 2025 and 2030. Table 3 presents descriptive statistics of the technical efficiency scores and Malmquist indices of the 2,887 municipalities under examination for the years 2017 and 2021.
The mean technical efficiency score in 2017 is relatively low (TE = 0.304), suggesting that municipalities, on average, had almost 70% potential for improvement to reach the level of efficient, or best-performing, municipalities in Slovakia. Within our sample, 30 municipalities were identified as efficient. By 2021, the mean technical efficiency score had increased to 0.473, and the number of efficient municipalities had risen by 5. Despite this improvement, municipalities on average still achieved less than 50% of their potential performance.
Table 1.
List of variables used in the analysis.
Table 2.
Descriptive statistics of quantitative variables used in the analysis, years 2017 and 2021, n = 2887 municipalities.
The Malmquist productivity index (MPI = 1.764) suggests an overall improvement in MSW management performance by an average of 76.4%, primarily driven by a technical efficiency improvement of 89.4% on average (TEC = 1.894). It is noteworthy that the majority of municipalities (78.5%) experienced total productivity improvement, while 21.4% experienced a decline. This improvement indicates that more waste was treated using desirable methods, resulting in less waste being sent to landfills.
However, the technological change index (TC = 0.925) reflects a regressive shift in the efficiency frontier, indicating that the top-performing municipalities experienced a 7.5% decline in productivity from 2017 to 2021.
Table 3.
Descriptive statistics of the technical efficiency scores and Malmquist indices of MSWM of municipalities in Slovakia (n = 2887).
The efficiency scores are significantly influenced by the unrestricted variable of incineration with energy recovery. As shown in Table 4, in 2017, municipalities with access to incineration technology had significantly higher mean technical efficiency scores (0.528) compared to those without access (0.296), as confirmed by the Mann-Whitney test (Z = 6.128, p<0.0001). Additionally, among the 30 technically efficient municipalities (TE = 1), 19 had access to incineration technology, while only 11 technically efficient municipalities were found among those without access.
In 2021, this disparity widened further. Municipalities with access to incineration technology displayed substantially higher mean technical efficiency scores (0.822) compared to those without access (0.460), with a significant Mann-Whitney test result (Z = 12.974, p = 0). Furthermore, the total number of technically efficient municipalities increased to 35, with 32 of these municipalities having access to incineration technology, whereas only 3 technically efficient municipalities were observed among those without access.
These findings suggest that access to waste incineration technology with energy recovery enhances municipal efficiency scores. However, this improvement may be influenced by the unrestricted weighting of the incineration variable in the analysis. According to the waste hierarchy outlined in the Waste Framework Directive [1], incineration without energy recovery, along with landfilling, is classified as “disposal” and subject to a maximum threshold of 10%. In contrast, incineration with energy recovery is categorized as “recovery” and is not explicitly restricted by EU regulations. Grosso et al. [74] argue that incineration with energy recovery should be positioned one step above landfilling in the waste hierarchy. Some studies, such as [38], even propose a specific target of 35% for incineration with energy recovery. However, the literature remains divided on its overall impact [75, 76]. While it often contributes to a reduction in landfill use [77], inefficient incineration technology can result in the release of harmful substances, potentially undermining circular economy principles and sustainable waste management [38].
Factors Influencing MSWM Performance
In the second-stage analysis, we explored several exogenous factors that could explain variations in waste management performance among the municipalities under examination. Based on the available data, we identified 4 key factors: (1) the pricing method for waste collection, (2) the size of the municipality, (3) the regional MSWM programs, and (4) the education level of the municipality population.
Pricing Method for Waste Collection
In Slovakia, 3 pricing methods for municipal waste collection are utilized across municipalities. The predominant method is a flat annual fee per resident, accounting for over 80% of municipalities (group G1). Volume-based pricing, based on the bin volume and collection interval, is employed in fewer than 10% of municipalities (G2), while the utilization of combined pricing is declining, comprising only 5% of municipalities (G3) in 2021 (refer to Table 5).
An analysis of the impact of waste pricing methods on MSWM efficiency was conducted for the years 2017 and 2021. In both years, municipalities employing volume-based pricing demonstrated the highest average efficiency scores.
The Kruskal-Wallis test conducted on the 2017 results indicated a non-significant difference in efficiency among the three groups of municipalities, with no significant differences observed between the mean ranks of any group pair. However, the same test conducted on the 2021 results revealed a significant difference in efficiency among the 3 groups of municipalities (Table 5). Multiple comparisons of pairs of municipality groups demonstrated significant differences in efficiency scores between pairs G1 and G2, as well as G1 and G3. Further details are provided in Table 6. These findings suggest that both volume-based and combined pricing methods tend to yield superior MSWM efficiency compared to the flat annual fee pricing method within the analyzed 5-year period.
Table 4.
Descriptive statistics of the technical efficiency scores of municipalities with respect to access to the technology for waste incineration with energy recovery and Mann-Whitney test results.
Table 5.
Technical efficiency scores with respect to the pricing method for the collection of waste, and Kruskal-Wallis test results (n = 2887).
Using Malmquist indices, we sought to examine which group of municipalities demonstrated the most significant enhancement in MSWM performance during the period from 2017 to 2021. All 3 groups of municipalities exhibited improvements in their total productivity and technical efficiency. As illustrated in Table 7, Group 2 showed the highest average increase in technical efficiency (109.8%), followed by Group 3 with 105.4%, while municipalities in Group 1 improved by 86.2%. This suggests that municipalities implementing either fully or partially volume-based pricing are better at catching up to the best-performing municipalities. A similar trend was observed in the total productivity change indicator, as represented by the Malmquist productivity index. Productivity in G2 municipalities improved on average by 99.4%, and in group G3 by 94.5%, whereas group G1 experienced only 73.4% productivity growth. The technological change index in all 3 groups is below unity, indicating technological regression, i.e., the best-performing municipalities experienced, on average, a decline in productivity from 2017 to 2021. A Kruskal-Wallis test conducted on the above results revealed significant differences in all three Malmquist indices among the 3 groups of municipalities. The post-hoc Dunn’s multiple comparisons test between pairs of municipality groups showed significant differences between G1-G2 and G1-G3 in all 3 Malmquist indicators. These findings confirm that both volume-based and combined pricing methods led to more substantial performance improvement over time, primarily due to enhancements in technical efficiency.
Our findings align with a more detailed study on the impact of unit-based waste pricing in Slovakia from 2010 to 2018, as presented in [37]. It is important to note that the volume-based pricing system in Slovakia operates as a flat fee per container volume, regardless of the actual amount of waste present at the time of collection. Nevertheless, our analysis indicates that municipalities using this volume-based pricing approach tend to manage waste more efficiently. Transitioning to a more advanced weight-based pricing system – often referred to as a unit-based or pay-as-you-throw (PAYT) system - could lead to substantial reductions in residual waste quantities, as demonstrated in studies [78-80].
Table 6.
The post-hoc Dunn’s test results for pairs of groups of municipalities according to technical efficiency and the pricing method for the collection of waste.
Table 7.
Malmquist indices with respect to the pricing method for the collection of waste and Kruskal-Wallis test results.
Municipality Size
The structure of municipalities in Slovakia is one of the most heterogeneous among EU countries, characterized by a high degree of fragmentation and a large number of small municipalities. As indicated in Table 8, more than 65% of these municipalities have populations of less than 1,000. Small municipalities face challenges in generating sufficient tax revenues and often rely heavily on financial transfers from central government budgets. Additionally, it is also known that inhabitants of small municipalities tend to have different waste treatment habits in comparison to those of large municipalities. Especially, biological and food waste is usually largely recycled within households. This fact leads to an assumption that there might be significant differences in MSWM efficiency with respect to the municipality size.
Our findings, as presented in Table 8, corroborated by the Kruskal-Wallis test, revealed a significant difference in technical efficiency between the various size classes of municipalities, both in the years 2017 and 2021. In both periods, municipalities with populations of 100,000 or more consistently demonstrated the highest average efficiency scores. Conversely, the lowest average technical efficiency in 2017 was observed for the C4 size class, comprising municipalities with populations ranging from 1,000 to 1,999 inhabitants, while in 2021, it was noted among municipalities with populations below 200 inhabitants.
Table 8.
Technical efficiency scores with respect to the municipality size by population and Kruskal-Wallis test results (n = 2887).
The post-hoc Dunn’s test, conducted on 2017 results, indicates that the mean ranks of the following pairs are significantly different: C1-C2, C1-C3, C1-C4, C1-C5, C2-C3, C2-C4, C2-C56, C3-C9, C4-C9, and C5-C9. In 2021, significantly different pairs are C1-C4, C2-C4, and C3-C4.
Table 9 summarizes MSWM performance change indexes between the years 2017 and 2021. A positive finding is that there was an overall enhancement in total factor productivity across all size classes of municipalities. Particularly noteworthy is the substantial improvement observed in municipalities classified under C4 (1,000-1,999), with an average increase of 106.9%. This improvement was primarily due to a significant enhancement in technical efficiency, which rose by 120.7%. Interestingly, despite being the top performers in terms of technical efficiency, municipalities belonging to the C10 class (100,000 or more) exhibited the lowest performance improvement. Differences in all three Malmquist indices among the 10 size classes of municipalities were significant. The post-hoc Dunn’s test between pairs of municipality size classes showed significant differences between the following pairs:
TEC: C1-C2, C1-C3, C1-C4, C1-C5, C1-C6, C2-C3, C2-C4, C2-C5, and C3-C4
TC: C1-C4, C1-C5, C1-C6, C1-C7, C1-C8, C2-C4, C2-C5, C2-C6, C2-C7, C2-C8; C3-C4, C3-C5, C3-C6, C3-C7, C3-C8, and C4-C6
MPI: C1-C4, C2-C4, and C3-C4
The relationship between municipality size and the performance and efficiency of municipal solid waste management has been extensively studied. The results of our study align with those of other studies that consistently show that larger municipalities tend to achieve higher efficiency in MSWM, mostly due to economies of scale. For instance, a study of Italian municipalities found that larger cities demonstrated higher efficiency scores in waste service outsourcing [81] (Benedetti et al., 2023). Similarly, research in Brazil revealed that municipalities with populations over 500,000 inhabitants had the highest efficiency scores, ranging from 0.8 to 0.9 [82] (Costa et al., 2024). In contrast, smaller municipalities often face efficiency challenges due to limited resources and operational scale. A study of 940 Brazilian municipalities, for example, found that those with populations under 10,000 had efficiency scores as low as 0.5 [82] (Costa et al., 2024). The significant performance differences across municipality size categories in our study suggest the potential influence of additional factors, such as political, socio-economic, and demographic variables, as noted in [53]. However, further research is needed to explore these factors in greater depth.
Table 9.
Malmquist indices with respect to the municipality size by population and Kruskal-Wallis test results (n = 2887).
Regional MSWM Programs
The Waste Management Program of the Slovak Republic serves as a binding directive guiding the decision-making processes of state administrative bodies regarding waste management. It mandates that district offices, located in regional centers, are obliged to formulate waste management programs tailored to the unique conditions of their respective regions, adhering to the objectives and measures outlined in this document. Slovakia is divided into 8 regions, each with its own distinct characteristics, resulting in the development of 8 regional programs. In this section, we present the outcomes of our analysis examining whether these regional programs have resulted in significant disparities in MSWM performance among municipalities belonging to territories within the jurisdiction of each region.
Table 10.
Technical efficiency scores with respect to regions and Kruskal-Wallis test results (n = 2887).
Table 10 presents technical efficiency scores for MSWM in all regions of the Slovak Republic for the years 2017 and 2021. The Kruskal-Wallis test results indicate statistically significant differences in technical efficiency scores among regions for both years, highlighting disparities in waste management performance across Slovak municipalities. In 2017, Prešov, Košice, and Banská Bystrica regions exhibited municipalities with relatively higher mean and median technical efficiency scores, while Trnava, Bratislava, and Trenčín regions displayed lower scores. Notably, Košice showed the highest standard deviation, indicating greater variability in technical efficiency scores within municipalities. In 2021, there was a significant shift in the ranking of regions. While the Košice region maintained relatively high technical efficiency scores, Prešov and Banská Bystrica saw a decline in their rankings. Notably, the Bratislava region showed the most significant improvement. Furthermore, the Košice region consistently demonstrated the highest number of efficient municipalities across both years.
Table 11 presents Malmquist indices and Kruskal-Wallis test results for various regions of Slovakia, focusing on technical efficiency change, technological change, and Malmquist productivity index from 2017 to 2021.
The first part of Table 11 evaluates the change in technical efficiency over the specified period. The mean values indicate the average increase in technical efficiency for each region. Notably, Bratislava exhibits the highest mean increase, suggesting significant improvement in waste management performance. However, Košice shows the highest variability (SD) in technical efficiency change, indicating diverse outcomes across municipalities within this region.
In the second part of Table 11, the change in technological factors influencing waste management efficiency is presented. The mean values represent the average change in technology over the period. While most regions show relatively minor technological regress, Košice and Prešov regions display more pronounced declines. In contrast, the Žilina region is the only one demonstrating technological progress.
The Malmquist productivity index provides an overall measure of productivity change over time. Bratislava (BA) once again demonstrates the highest mean index, indicating substantial overall productivity improvement. Conversely, Banská Bystrica and Prešov regions show lower mean values, suggesting slower productivity growth compared to other regions. Additionally, Košice displays the highest variability in productivity change, indicating diverse outcomes within this region.
Table 11.
Malmquist indices with respect to the regions and Kruskal-Wallis test results (n = 2887).
The Kruskal-Wallis test results indicate statistically significant differences in all three Malmquist indices among regions. The Post-hoc Dunn’s test indicated the following pairs were significantly different:
TEC: BA-BB, BA-KE, BA-PO, BA-ZA, BB-NR, BB+TN, BB-TT, BB-ZA, KE-NR, KE-TN, KE-TT, KE-ZA, NR-PO, NR-TT, PO-TN, PO-TT, PO-ZA, TN-TT, TN-ZA
TC: BA-BB, BA-KE, BA-PO, BB-KE, BB-NR, BB-PO, BB-TN, BB-TT, BB-ZA, KE-NR, KE-TN, KE-TT, KE-ZA, NR-PO, NR-ZA, PO-TN, PO-TT, PO-ZA, TN-ZA
MPI: BA-BB, BA-KE, BA-NR, BA-PO, BA-ZA, BB-NR, BB-PO, BB-TN, BB-TT, BB-ZA, KE-NR, KE-TN, KE-TT, KE-ZA, NR-PO, NR-TT, PO-TN, PO-TT, PO-ZA, TN-TT, TT-ZA
In summary, the regional MSWM programs in Slovakia have led to significant disparities in MSWM performance among municipalities of the 8 regions. The tailored programs, influenced by the unique conditions and characteristics of each region, have contributed to these differences. Regions such as Bratislava and Košice have shown notable improvements and high efficiency scores, respectively, while other regions have experienced varied levels of success. As documented in other studies, reducing disparities in regional MSWM efficiency requires a balanced approach - waste management policies should be harmonized at both regional and national levels to promote best practices while also accounting for local differences when setting management targets [83]. Factors such as infrastructure, access to efficient technology, economic development, population density, public awareness, and education should all be carefully considered when designing regional MSWM programs.
Education Level of the Municipality Population
In our analysis of the impact of the education level of the municipality population on MSWM performance, we hypothesized that higher education might lead to more eco-responsible behavior of municipality residents. To quantify the educational level, we utilized the Mean Years of Schooling (MYS), which represents the average number of years of education completed by individuals aged 15 and above. Mathematically, MYS is expressed by Eq. (8):
where Pi is the proportion of the population aged 15 and older that has attained education level i, Di is the official duration (in years) of educational level i. MYS was calculated using data from the Slovakia 2021 Census and is related only to the 2021 MSWM performance results.
Given the specific distribution of technical efficiency scores, which range from 0 to 1, we conducted a simple beta regression analysis to explore the relationship between MSWM efficiency (2021) and MYS (2021). The regression model was fitted using the “betareg” function in R [84] and the results are presented in Table 12.
The results indicate a statistically significant positive relationship between the education level of the municipal population (MYS) and MSWM efficiency in 2021. Higher levels of education within the population are associated with increased efficiency in waste management practices. The coefficient for MYS suggests that, on average, for each additional unit increase in municipal population education (expressed in mean years of schooling), municipal solid waste management efficiency is expected to increase by approximately 0.25446 units. However, it is important to note that the model explains only a moderate proportion of the variation in waste management efficiency (Pseudo R-squared = 0.02736), indicating that other factors not accounted for in the model may also influence the efficiency.
Our findings, represented by composite indicators of MSW management performance, align with other studies indicating that education level positively impacts both total MSW generation [16, 85] and recycling rates [86].
Conclusions
This paper analyzes municipal solid waste management (MSWM) efficiency across 2,887 Slovak municipalities from 2017 to 2021. We conceptualized MSWM as a dynamic process transforming total municipal solid waste into four primary waste streams, categorized as desirable (recycling and incineration with energy recovery) and undesirable (landfilling) based on EU and Slovak targets.
We evaluated MSWM efficiency using composite indicators of technical efficiency and Malmquist indices with a Data Envelopment Analysis (DEA) estimator. Our DEA model included 2 inputs (total MSW processed and associated costs) and 4 outputs (recycling - material, recycling - composting/digestion, incineration with energy recovery, and landfilling). We applied an innovative approach by converting waste hierarchy preferences into DEA output variable weights using the Assurance Region DEA model.
We examined four external factors’ impact on MSWM efficiency: pricing method for waste collection, municipality size, regional MSWM programs, and population education level.
Analysis revealed significant improvements in technical efficiency and overall productivity of MSWM, with productivity improving by 76.4% on average, primarily due to an 89.4% technical efficiency improvement. However, the average technical efficiency score of 0.473 indicates potential for further enhancement. Municipalities with access to incineration technology showed statistically significant higher efficiency scores.
External factor analysis yielded several findings:
1. Volume-based and combined pricing methods for waste collection resulted in higher average efficiency scores compared to flat annual fees.
2. Larger municipalities generally showed higher efficiency scores.
3. Significant efficiency differences existed among some regions in Slovakia.
4. Population education level had a weak but statistically significant impact on waste management efficiency.
While this research significantly contributes to the existing body of knowledge on assessing MSWM performance at the municipal level, there are several limitations that future studies could address. One major finding is that the efficiency scores of municipalities are significantly influenced by their access to incineration technology with energy recovery. Future models should incorporate more detailed specifications of incineration technology, reflecting environmental advancements.
Municipality size also proved to be a significant factor, with smaller municipalities showing lower efficiency. Future research could investigate whether inter-municipal cooperation in contracting waste services improves MSWM efficiency for smaller municipalities.
Expanding the analysis to evaluate regional program differences could better explain efficiency disparities.
All the above recommendations are significantly dependent on data. Unfortunately, limited data availability for the municipalities of Slovakia prevented further examinations beyond those that have been analyzed in this study.
The introduction of the deposit return scheme in Slovakia on January 1, 2022, significantly altered the flow of PET bottles and metal and aluminum cans. By 2023, the deposit return rate reached 93%, substantially reducing the amount of waste collected for material recycling at the municipal level. Future research should explore these changes and evaluate their impact on MSWM efficiency.
This study represents the first comprehensive analysis of MSWM efficiency across all municipalities in Slovakia. It results in the following policy recommendations:
1. Adopt incentivized pricing mechanisms for waste collection through encouraging municipalities to implement volume-based or combined pricing methods for waste collection. These pricing mechanisms align financial incentives with waste reduction goals, motivating households to recycle and reduce waste generation.
2. Expand access to incineration facilities equipped with energy recovery technology, especially in municipalities currently reliant on landfilling.
3. Expand public education programs on sustainable waste practices, emphasizing the importance of recycling, composting, and reducing landfill dependency.
4. Strengthen regional waste management programs to address regional disparities in MSWM efficiency by enhancing the scope and funding of regional waste management programs.
By implementing these recommendations, Slovak municipalities can address the identified inefficiencies in MSWM, achieve greater compliance with EU waste management targets, and foster a more sustainable waste management system.

