

Introduction
Human activities such as industrial combustion, metal smelting, and excessive use of chemical fertilizers have led to increasingly serious heavy metal contamination in farmland soils [1]. Among these contaminated heavy metals, cadmium (Cd) is the most serious [2], and the paddy fields are also contaminated by Cd to varying degrees [3-5]. The Cd content in rice (Oryza sativa L.) is positively correlated with the soil Cd concentration in paddy fields [6], which may lead to the accumulation of Cd in rice grains and harm human health through the food chain [7]. Therefore, methods for treating Cd contamination are urgently needed.
Rice is the main food crop for more than half of the world’s population, especially in Asian countries, and it is of vital importance to ensure the food security of rice [8]. However, due to paddy fields being contaminated by Cd, the Cd contamination in rice is becoming increasingly severe [9]. There are various remediation methods for Cd contamination in paddy soils, including the physical, chemical, and biological methods, but these methods can’t be applied on a large scale in production for various reasons [10]. The absorption of Cd by rice roots is mainly mediated by the iron and manganese transporters, with OsNramp5 being a key gene for Cd absorption in rice roots [11]. In Indica rice, there is an 18-bp insertion-deletion variation in the promoter region of OsNramp5, leading to a 40% reduction in its transcriptional level compared to Japonica rice, resulting in reduced Cd absorption [12]. The translocation of Cd from rice roots to shoots depends on the xylem loading process, which is related to the expression of genes such as OsHMA2 and OsLCT1 [13, 14]. Additionally, the final accumulation of Cd in rice grains is regulated by vacuolar compartmentalization [15, 16]. Due to differences in genetic background and environment, the absorption and accumulation of Cd in rice exhibit variations across different varieties [17], and the variation in Cd accumulation among different rice varieties can be more than two-fold [18, 19]. So, screening out low-Cd accumulation rice varieties as main cultivated varieties can be applied on a large scale in production to achieve safe rice production. In this study, 20 different rice genotypes were planted under Cd stress conditions, and the growth and Cd accumulation characteristics of these rice materials were studied. The aim of this study was to screen the low-Cd accumulation rice materials or their combinations and provide a reference for rice breeding and safe production in Cd-contaminated paddy fields.
Materials and Methods
Materials
20 rice genotypes were used in this experiment (Table 1). These rice materials were provided by the Mianyang Academy of Agricultural Sciences. The seeds were soaked in deionized water at room temperature and germinated in sand in a greenhouse with a daytime temperature of 25ºC, a relative humidity of 70%, light intensity of 10,000 Lux, and a 14-hour duration. During the nighttime, the temperature was maintained at 20ºC, with a relative humidity of 90%, light intensity of 0 Lux, and a 10-hour duration. Once the seedlings of rice emerged, they were irrigated with the Hoagland nutrient solution every three days. When the seedlings of rice reached a height of 10 cm (at the three-leaf stage), they were transplanted for further growth.
Experimental Design
In June 2024, the seedlings of rice were transplanted into square pots with dimensions of 6.5 cm (height) × 11 cm (length) × 8 cm (width). Each pot was planted with four seedlings of rice at the four corners. The pots were filled with sand and placed in a rain shelter. Two treatments were applied to each rice material: (1) control (CK), without Cd treatment; (2) 1 mg/L Cd treatment (Cd treatment) [20]. Each treatment was replicated thrice for each rice material, with one pot serving as a replicate. Hoagland nutrient solution containing 1 mg/L Cd (in the form of CdCl2·2.5H2O) was irrigated every 3 days for Cd treatment, while Hoagland nutrient solution without Cd was irrigated every 3 days for CK. The Hoagland solution was irrigated until it completely submerged the sand. After 1 month of treatment, the seedlings of rice were harvested to determine various parameters.
Table 1.
Rice materials used in this experiment.
Determination of Parameters
In July 2024, the plant height and root length were measured using a tape measure. Subsequently, the entire plants were harvested, separated into roots and shoots, and dried at 80ºC until a constant weight to determine the dry weight (biomass) [21]. Afterwards, 0.500 g of the dried and finely ground samples were weighed, nitric and perchloric acids were added, and digestion was carried out using a microwave digestion instrument. The digestion solution was used to determine the Cd content using an iCAP 6300 ICP-MS spectrometer (Thermo Fisher Scientific, Waltham, MA, US) [22]. The resistance index and translocation factor were calculated using the following formulas [23]:
Statistical Analysis
The data with triplicate were analyzed using SPSS 20.0.0 software (IBM, Inc., Armonk, NY, USA). After normalization and homogeneity testing, one-way analysis of variance and Duncan’s Multiple Range Test (p<0.05) or Student’s t-test (0.01≤p<0.05 and p<0.01) were conducted. Pearson’s correlation was employed to examine the relationships among different parameters under Cd stress. Cluster analysis was employed to classify the various rice materials under Cd stress.
Results and Discussion
Plant Height and Root Length of Rice Seedlings
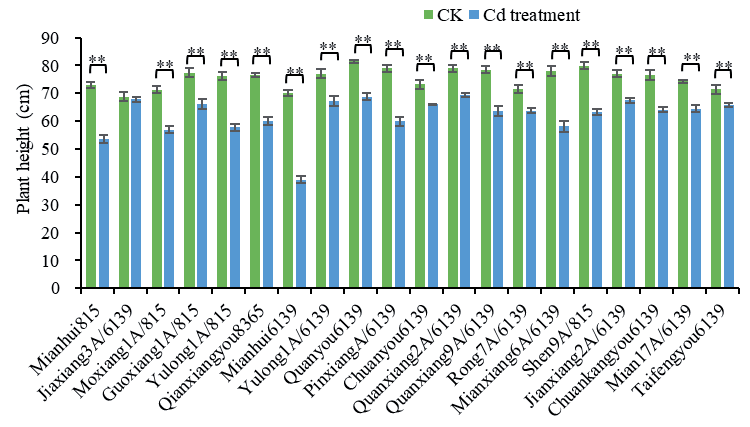
The plant height and root length reflect the morphology of plant growth, and it was observed that when the soil Cd concentrations were 0.25 mg/kg and 0.50 mg/kg, the plant height and root length of rice seedlings decreased [24]. Another study showed that as the culture medium Cd concentration increased, the root length of rice decreased, reaching its lowest point when the culture medium Cd concentration was 100 μmol/L. However, the root length of rice material “PA64s” and its recombinant inbred lines increased when the culture medium Cd concentration was 10 μmol/L [25]. In this study, except for “Jiaxiang3A/6139”, Cd treatment decreased the plant height of the other 19 rice materials compared to their respective CK (Fig. 1). Cd treatment did not affect the plant height of “Jiaxiang3A/6139” compared to CK, suggesting that “Jiaxiang3A/6139” had a higher tolerance to Cd stress than other rice materials. For the other 19 rice materials, Cd treatment decreased the plant height of rice seedlings by 7.75% to 44.46% compared to their respective CK. The largest reduction in plant height was shown in “Mianhui6139”, while the smallest reduction was observed in “Taifengyou6139”. These results are consistent with the previous study [24], which indicates that Cd stress may inhibit the growth and reduce the height of plants [25].
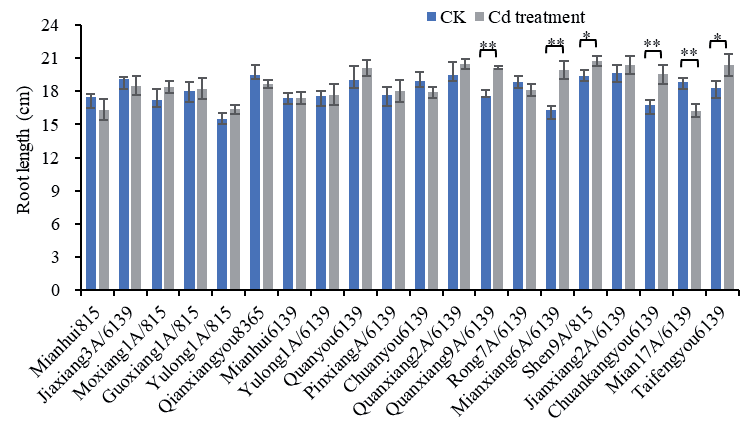
In addition, Cd treatment only decreased the root length of “Mian17A/6139” by 13.67% and increased the root length of “Quanxiang9A/6139”, “Mianxiang6A/6139”, “Shen9A/815”, “Chuankangyou6139”, and “Taifengyou6139” when compared to their respective CK (Fig. 2). However, Cd treatment did not have an effect on the root length of the other 14 rice materials. These results are consistent with the results of the previous study [26], suggesting that both different rice materials and culture medium Cd concentration can impact the root length of rice. The reason is that the treatment of Cd destroys the cell membrane of plants, reduces the root number, and inhibits the growth of roots [27].
Biomass of Rice Seedlings
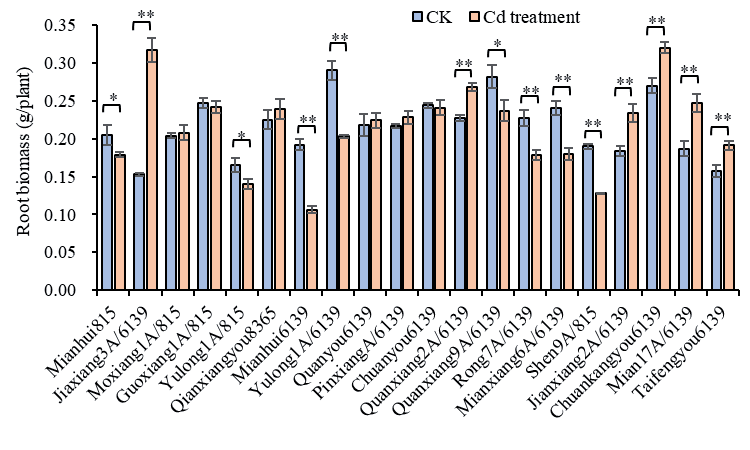
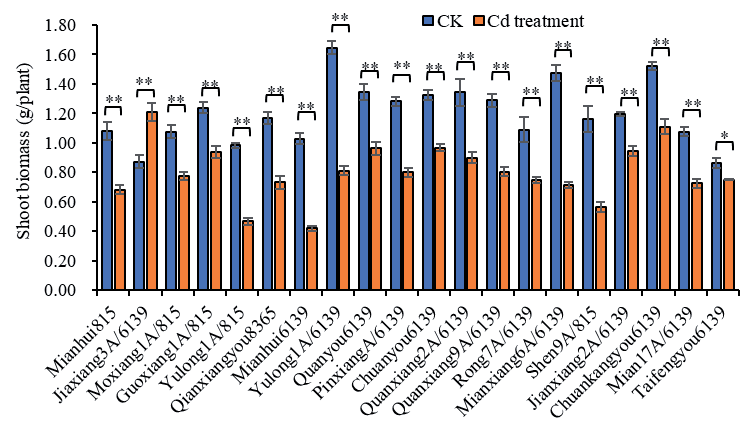
Biomass reflects the accumulation of dry matter and growth quality of plants, and it was noted that in Cd-contaminated soil with concentrations of 0.25 mg/kg and 0.50 mg/kg, the root and shoot biomass of rice increased [24]. Furthermore, a study revealed that 200 μmol/L Cd treatment inhibited the root growth of rice seedlings [26], while 100 μmol/L Cd treatment decreased rice biomass [27]. In this experiment, Cd treatment increased the root biomass of “Jiaxiang3A/6139”, “Quanxiang2A/6139”, “Jianxiang2A/6139”, “Chuankangyou6139”, “Mian17A/6139”, and “Taifengyou6139” compared to their respective CK (Fig. 3). On the other hand, Cd treatment decreased the root biomass of “Mianhui815”, “Yulong1A/815”, “Mianhui6139”, “Yulong1A6139”, “Quanxiang9A/6139”, “Rong7A/6139”, “Mianxiang6A/6139”, and “Shen9A/815” compared to their respective CK. Cd treatment had no effect on the root biomass of the other six rice materials. In terms of shoot biomass, Cd treatment only increased the shoot biomass of “Jiaxiang3A/6139” by 38.72% compared to CK (Fig. 4). The shoot biomass of the other 19 rice materials all decreased with Cd treatment, with a reduction range of 12.98% to 59.18% compared to their respective CK. So, “Jiaxiang3A/6139” had the highest tolerance to Cd stress, which may be related to the hybrid combination producing recombinant genes with strong tolerance to Cd stress in this material. These results highlight the varying responses of different rice materials to Cd-induced stress, which are likely connected to their Cd resistances [28].
Resistance Index of Rice Seedlings
The resistance index is the ability of a plant to resist the Cd stress, which reflects the changes in plant biomass [29]. The resistance index of “Jiaxiang3A/6139” was higher than 1.00, while the resistance indexes of 19 other rice materials were lower than 1.00 (Fig. 5), further indicating that “Jiaxiang3A/6139” had strong tolerance to Cd stress. The resistance indexes of “Jianxiang2A/6139” and “Taifengyou6139” were 0.80-1.00, while “Mianhui815”, “Moxiang1A/815”, “Guoxiang1A/815”, “Qianxiangyou8365”, “Quanyou6139”, “PinxiangA/6139”, “Chuanyou6139”, “Quanxiang2A/6139”, “Quanxiang9A/6139”, “Rong7A/6139”, “Chuankangyou6139”, and “Mian17A/6139” were 0.60-0.80. Additionally, “Yulong1A/815”, “Mianhui6139”, “Yulong1A/6139”, “Mianxiang6A/6139”, and “Shen9A/815” had resistance indexes between 0.40-0.60. These findings suggest that the Cd resistances of the 20 rice materials used in this study vary, further indicating differences in genetic backgrounds among these materials, consistent with previous studies [28, 30].
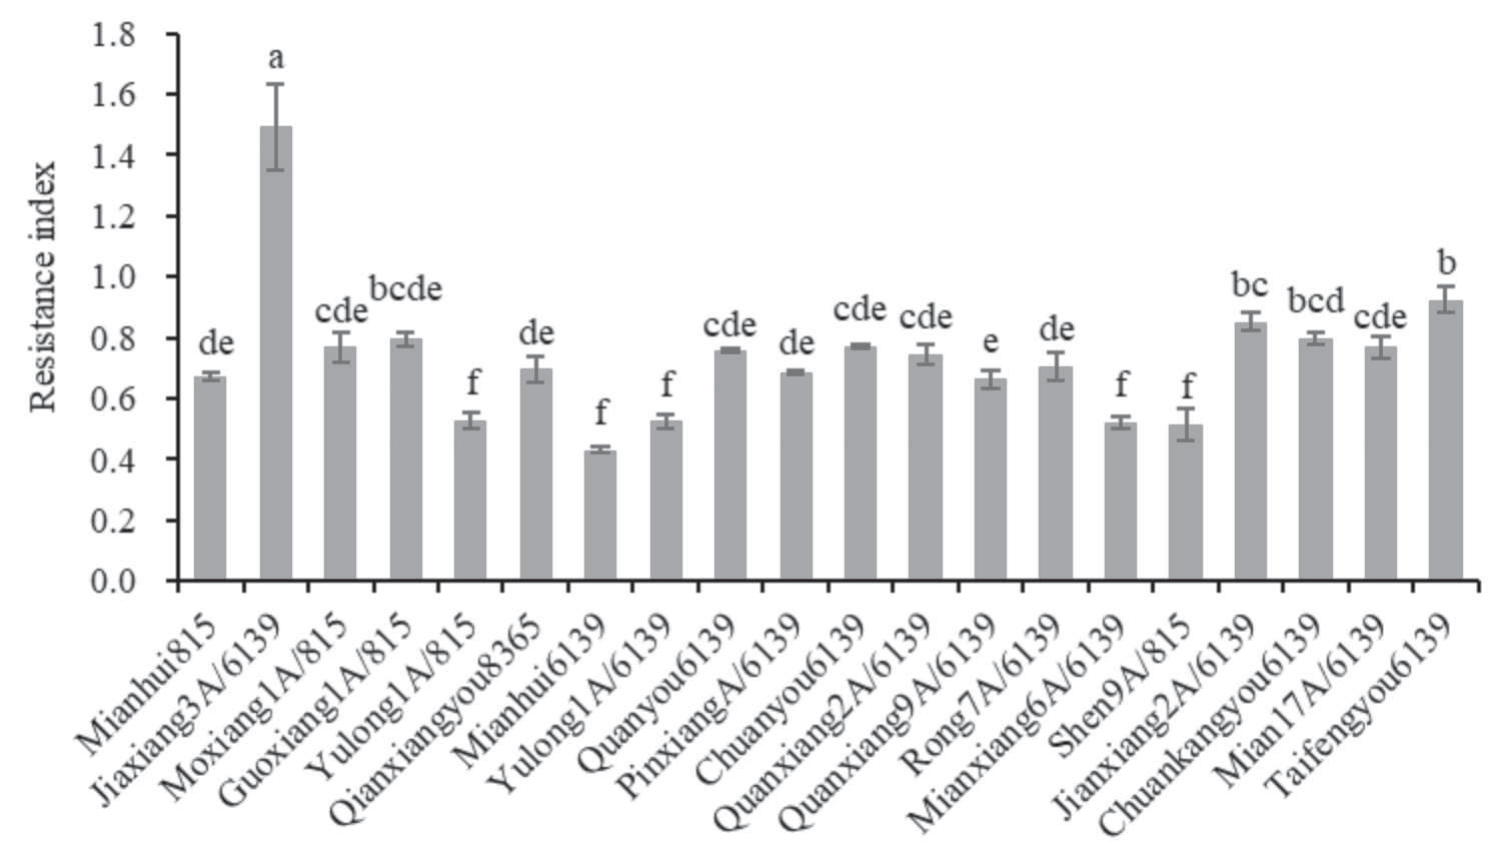
Cd Content and Translocation Factor of Rice Seedlings under Cd Stress
The abilities of different plants to accumulate Cd are diverse, and the Cd primarily accumulates in rice roots [28, 30, 31], a trend seen in other crops as well [32-34]. When exposed to a 2 μmol/L Cd condition, the root Cd contents in rice variety “Zhonghua 11” and its derivative line 2B range from 46.9-70.9 mg/kg [35]. The root Cd content can reach 285.4 mg/kg under a treatment with a 100 μmol/L Cd condition [27]. The shoot Cd content in rice falls between 82.86-159.01 μg/kg when the soil Cd concentration is 151.97-242.13 μg/kg [36]. In this study, the root Cd contents in different rice materials ranged from 267.49 to 540.84 mg/kg under Cd stress (Fig. 6). The root Cd contents in “Yulong1A/815” and “Shen9A/815” exceeded 400.00 mg/kg, measuring 491.39 and 540.84 mg/kg, respectively. On the other hand, the root Cd contents in “Jiaxiang3A/6139”, “Qianxiangyou8365”, “Mianhui6139”, and “Chuankangyou6139” fell between 200.00-300.00 mg/kg. The root Cd contents in the remaining 14 rice materials ranged from 300.00-400.00 mg/kg. Under Cd stress, the shoot Cd contents in various rice materials ranged from 38.20-121.76 mg/kg (Fig. 7). Among them, “Mianhui6139” showed the highest shoot Cd content at 121.76 mg/kg, while “Jiaxiang3A/6139” had the lowest at 38.20 mg/kg. The shoot Cd contents in “Mianhui815”, “Yulong1A/815”, and “Rong7A/6139” were within the range of 60.00-70.00 mg/kg. The shoot Cd contents in the remaining 15 rice materials ranged from 40.00-60.00 mg/kg. These results revealed the higher Cd content in rice roots compared to shoots, aligning with previous findings [28, 30, 31]. This suggests varying Cd absorption capacities among different rice materials. The reason may be that different rice materials have different mechanisms of Cd uptake because of regulation by multiple genes [32]. Cd is not an essential element for rice, and as an active organ in rice organs, the accumulation of Cd in roots is often higher than in above-ground parts [33]. In addition, “Jiaxiang3A/6139” may obtain recombinant genes with strong tolerance to Cd during the hybridization process, and have stronger antioxidant capacity under Cd stress to reduce the Cd uptake. Its mechanism of low Cd uptake needs to be further studied.
Fig. 6.
Root Cd content in rice seedlings under Cd stress. Values are means±SD of 3 replicates. Different lowercase letters indicate significant differences among the treatments (Duncan’s Multiple Range Test, p<0.05).
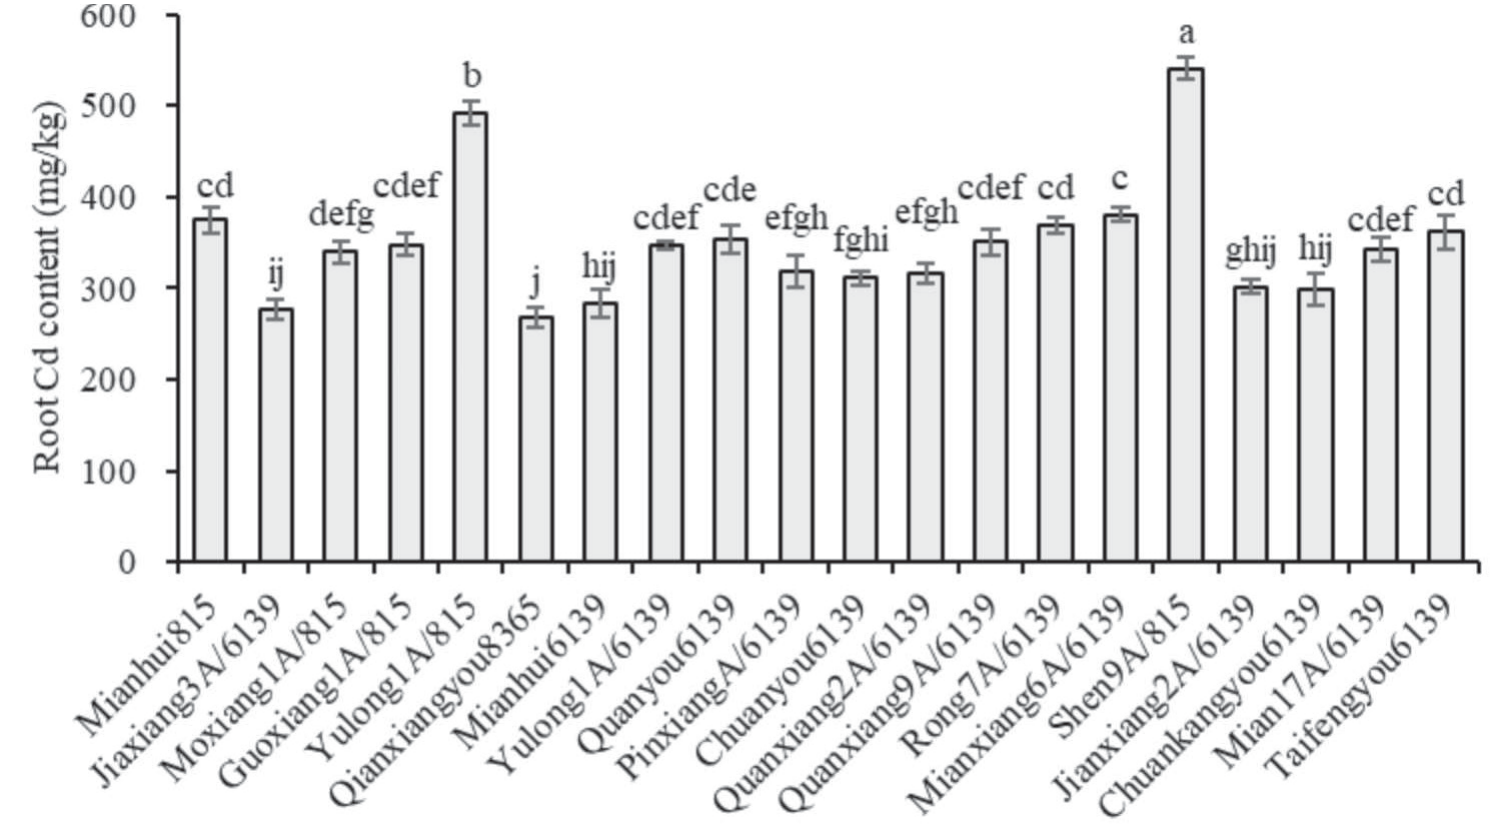
Fig. 7.
Shoot Cd content in rice seedlings under Cd stress. Values are means±SD of 3 replicates. Different lowercase letters indicate significant differences among the treatments (Duncan’s Multiple Range Test, p<0.05).
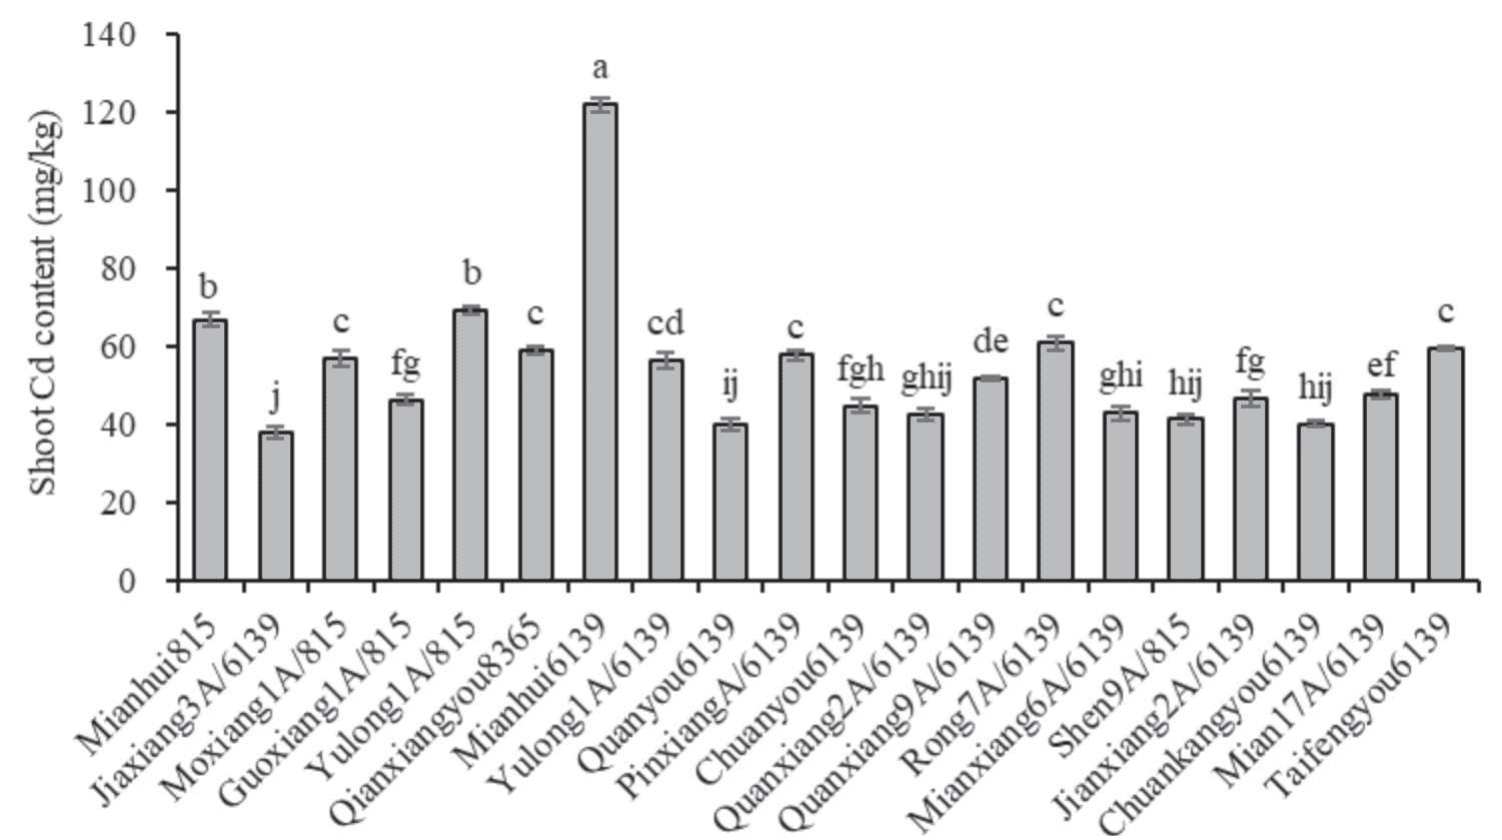
Fig. 8.
Translocation factor of rice seedlings under Cd stress. Values are means±SD of 3 replicates. Different lowercase letters indicate significant differences among the treatments (Duncan’s Multiple Range Test, p<0.05).
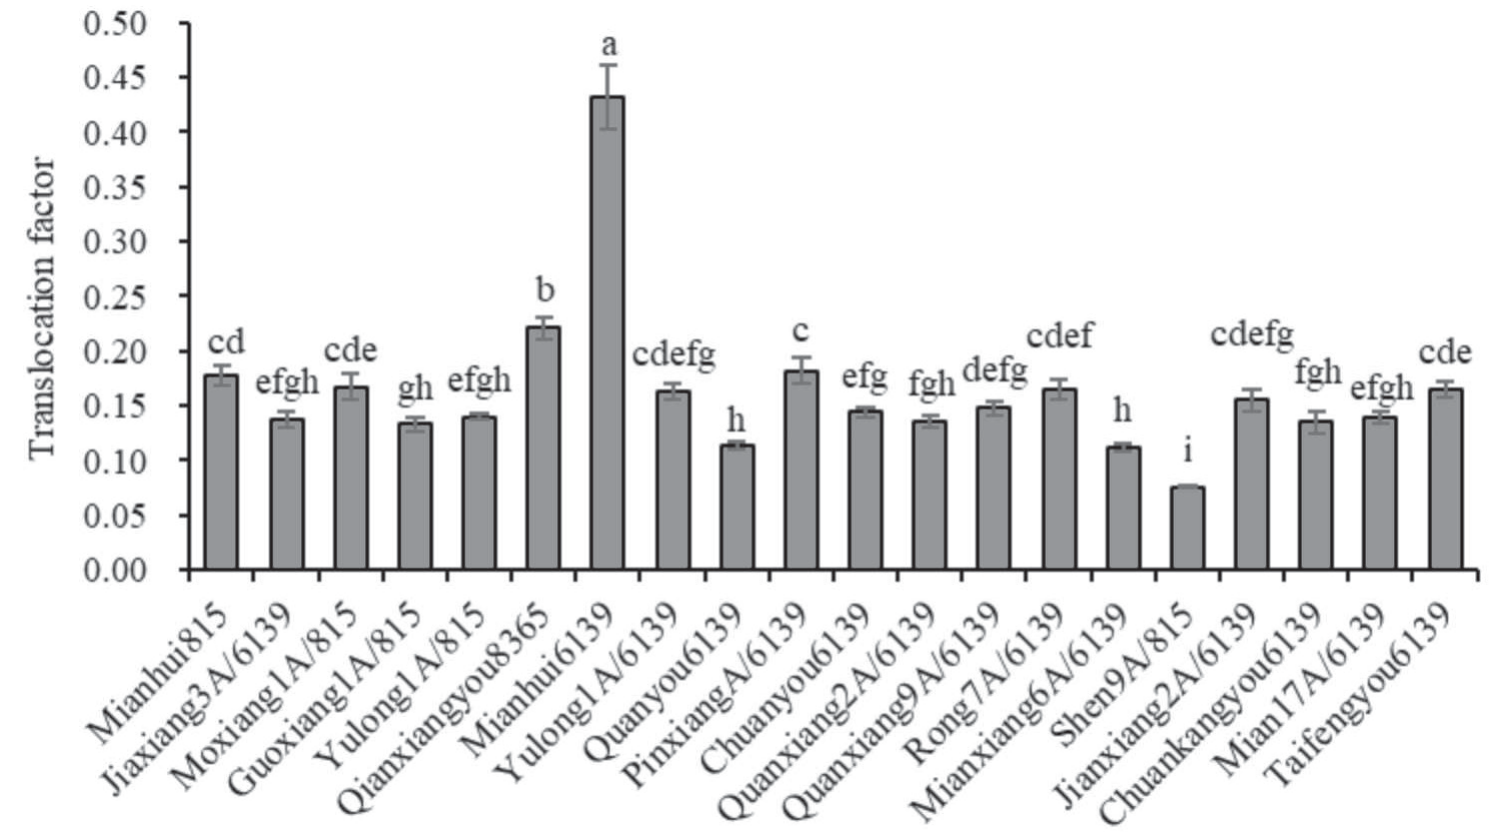
To evaluate the ability of different rice materials to translocate Cd from roots to shoots, the translocation factor was used in this experiment. The translocation factors of different rice materials under Cd stress ranged from 0.076-0.431 (Fig. 8). “Mianhui6139” exhibited the highest translocation factor, while “Shen9A/815” had the lowest. The translocation factor of “Qianxiangyou8365” was 0.221. The translocation factors of the other 17 rice materials ranged from 0.100-0.200. These results are consistent with previous studies [34, 37]. There are 3 transport pathways for Cd in rice, namely xylem transport, phloem transport, and xylem transport to phloem [38, 39], and the transport mode adopted depends on the Cd concentration and growth period of rice [40]. So, the diverse pathways for Cd transport from roots to shoots were also in this study, and the specific transport pathway of each rice material needs to be further studied.
Correlation, Linear Relationship, and Cluster Analyses
To analyze the relationships among different parameters under Cd stress, correlation analysis was used in this experiment (Table 2). The root biomass showed a positive correlation with the shoot biomass and plant height, and a negative correlation with the root Cd content and shoot Cd content. The shoot biomass showed a positive correlation with the plant height and root length, and a negative correlation with the root Cd content and shoot Cd content. Additionally, the shoot Cd content was negatively correlated with the plant height and root length. These findings align with earlier research [41]. The effect of Cd on plant biomass is mainly to reduce the production of photosynthates by inhibiting photosynthesis [42], and to reduce the output and distribution of assimilate products by inhibiting amylase and isozyme in leaves, thus negatively regulating photosynthesis and ultimately leading to the decline of biomass [43].
Table 2.
Correlation coefficients among the different parameters under Cd stress.
Fig. 9.
Linear relationships among the resistance index, translocation factor, shoot Cd content, and root Cd content. a) linear relationship between resistance index and root Cd content; b) linear relationship between resistance index and shoot Cd content; c) linear relationship between translocation factor and root Cd content; d) linear relationship between translocation factor and shoot Cd content.
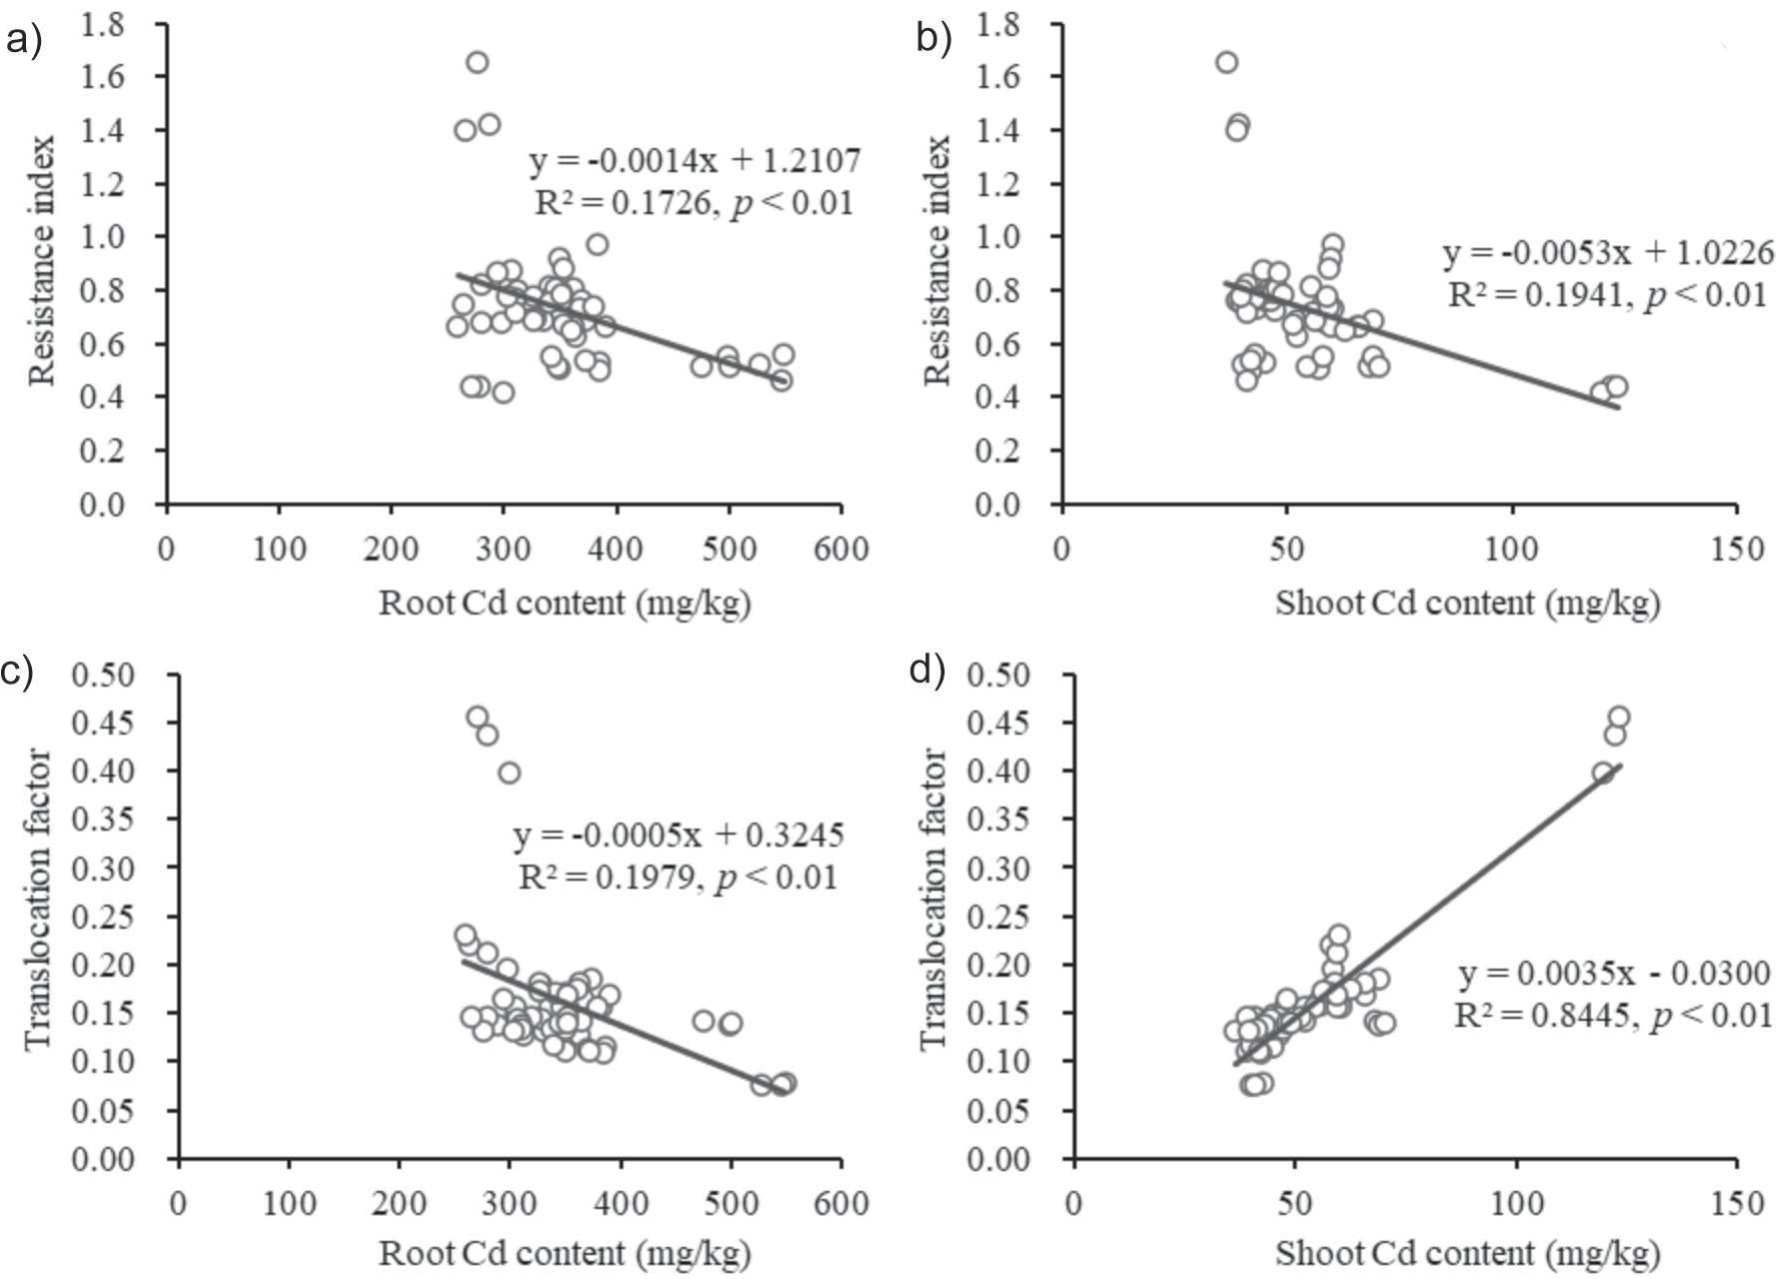
To further reveal the relationships among different parameters, linear relationships among the resistance index, translocation factor, shoot Cd content, and root Cd content were analyzed (Fig. 9(a-d)). The resistance index exhibited linear relationships with the root Cd content and shoot Cd content, while the translocation factor showed linear relationships with the root Cd content and shoot Cd content.
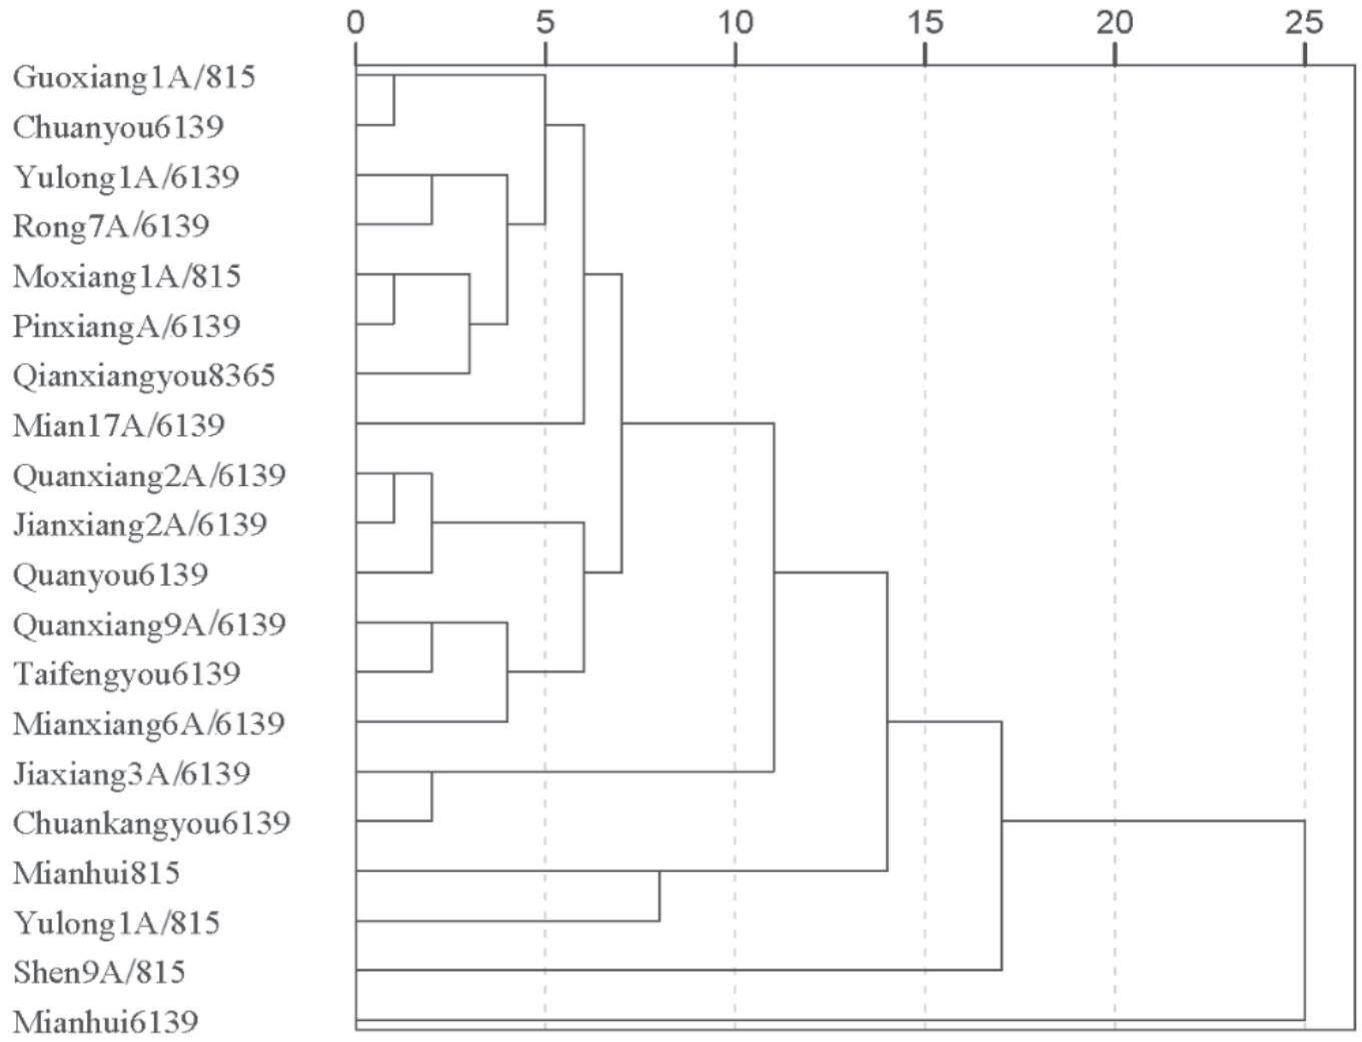
Moreover, cluster analysis was conducted to classify the various rice materials under Cd stress (Fig. 10). With a distance of 10, 5 categories were identified. The first category comprised “Mianhui6139”, the second category comprised “Shen9A/815”, the third category comprised “Yulong1A/815” and “Mianhui815”, the fourth category comprised “Chuankangyou6139” and “Jiaxiang3A/6139”, and the fifth category included 14 other rice materials. It may be related to the different absorption pathways of Cd in rice materials, including the pathways of exocytosomal, symplastid, and both [44]. The differing mechanisms of Cd accumulation in these rice materials warrant further investigation.
Conclusions
The study examined the varied differences among 20 rice materials in terms of resistance to Cd accumulation and translocation under 1 mg/L Cd treatment. The resistance index ranged from 0.40 to 1.49. The root Cd contents varied from 267.49 to 540.84 mg/kg, while the shoot Cd contents ranged from 38.20 to 121.76 mg/kg. The highest shoot Cd content was found in “Mianhui6139”, while the lowest was in “Jiaxiang3A/6139”. The translocation factor of rice ranged from 0.076 to 0.431. Future research should focus on understanding the different mechanisms of Cd accumulation among these rice materials.

