

Introduction
Quercus acutissima Carruth. is a deciduous tree species in the genus Quercus of the family Fagaceae, and it is one of the important tree species unique to China. It is widely distributed in the subtropical and temperate regions of China [1, 2]. Due to its strong adaptability and ecological functions, it occupies an indispensable position in the forest ecosystem. Q. acutissima has a well-developed root system, is drought-tolerant and able to grow in barren soil, and has a strong sprouting ability. It can be planted in mountainous areas, hilly areas, and uplands [3]. It is a pioneer tree species for barren mountains and wasteland, and an excellent tree species for soil and water conservation.
The wood of Q. acutissima is of excellent quality. Its mechanical properties, such as compressive strength along the grain, flexural elastic modulus, and flexural strength, belong to the medium-high-grade material level, and it has a wide range of uses. In addition, Q. acutissima grows fast, and the charcoal made from it has a high calorific value, produces no smoke, and has a high carbon content, making it an important raw material for high-quality charcoal.
However, with the continuous change of the global climate, key ecological factors such as temperature and precipitation are changing significantly, which has a profound impact on the living environment and distribution pattern of Q. acutissima [4-6]. Therefore, accurately predicting the potential distribution area of Q. acutissima under climate change is of great significance for formulating effective protection strategies, maintaining ecological balance, and promoting the sustainable development of forestry.
Species distribution models (SDMs) are tools for predicting species distribution. They infer the suitable areas for species by using the relationship between the current distribution of species and environmental variables. Currently, common species distribution models include the Generalized Additive Model (GAM) [7], the Genetic Algorithm for Rule - Set Prediction Model (GARP) [8], the Biological Climatic Model (BIOCLIM) [9], the Domain Model (DOMAIN), the Match Climate and Compare Location Model (CLIMEX) [10], the Ecological Niche Factor Analysis Model (ENFA) [10], the Classification and Regression Tree Model (CART) [11], and the Maximum Entropy Model (MaxEnt), etc.
The MaxEnt model can use species occurrence records and environmental variable data to effectively predict the potential distribution area of species. Compared with other models, it has the advantages of requiring fewer samples, being easy to operate, and having stable and accurate prediction results [12, 13]. The MaxEnt model has been widely applied in research such as predicting the potential distribution area of species, assessing the risk of invasive alien species, and studying the impact of climate change on species distribution areas and biodiversity [14-20].
At present, domestic and foreign research on Q. acutissima mainly focuses on its ecological characteristics and wood properties. However, there is a lack of reports regarding the potential suitable habitats, limiting factors, and possible responses of Quercus acutissima to future climate change in China. Therefore, based on the MaxEnt model, this study deeply analyzes the internal relationship between the current distribution pattern of Q. acutissima and climate factors, and predicts the change trend of the potential distribution area of Q. acutissima according to the future climate scenario data. Specifically, this study focuses on several key issues: What are the main environmental factors restricting the distribution of Q. acutissima? Under different climate scenarios, how will the area and geographical distribution pattern of the potential suitable areas of Q. acutissima change? In different climate scenarios, what are the climate-abnormal areas and the environmental variables with the highest degree of abnormality in the potentially suitable areas of Q. acutissima? How will the center of gravity of the potential suitable areas of Q. acutissima shift from the past to the future? The research on these issues is expected to provide a solid theoretical basis for the protection, rational development, and utilization of Q. acutissima resources, and contribute to forestry ecological construction and sustainable development.
Materials and Methods
Sample Point Data Collection and Processing
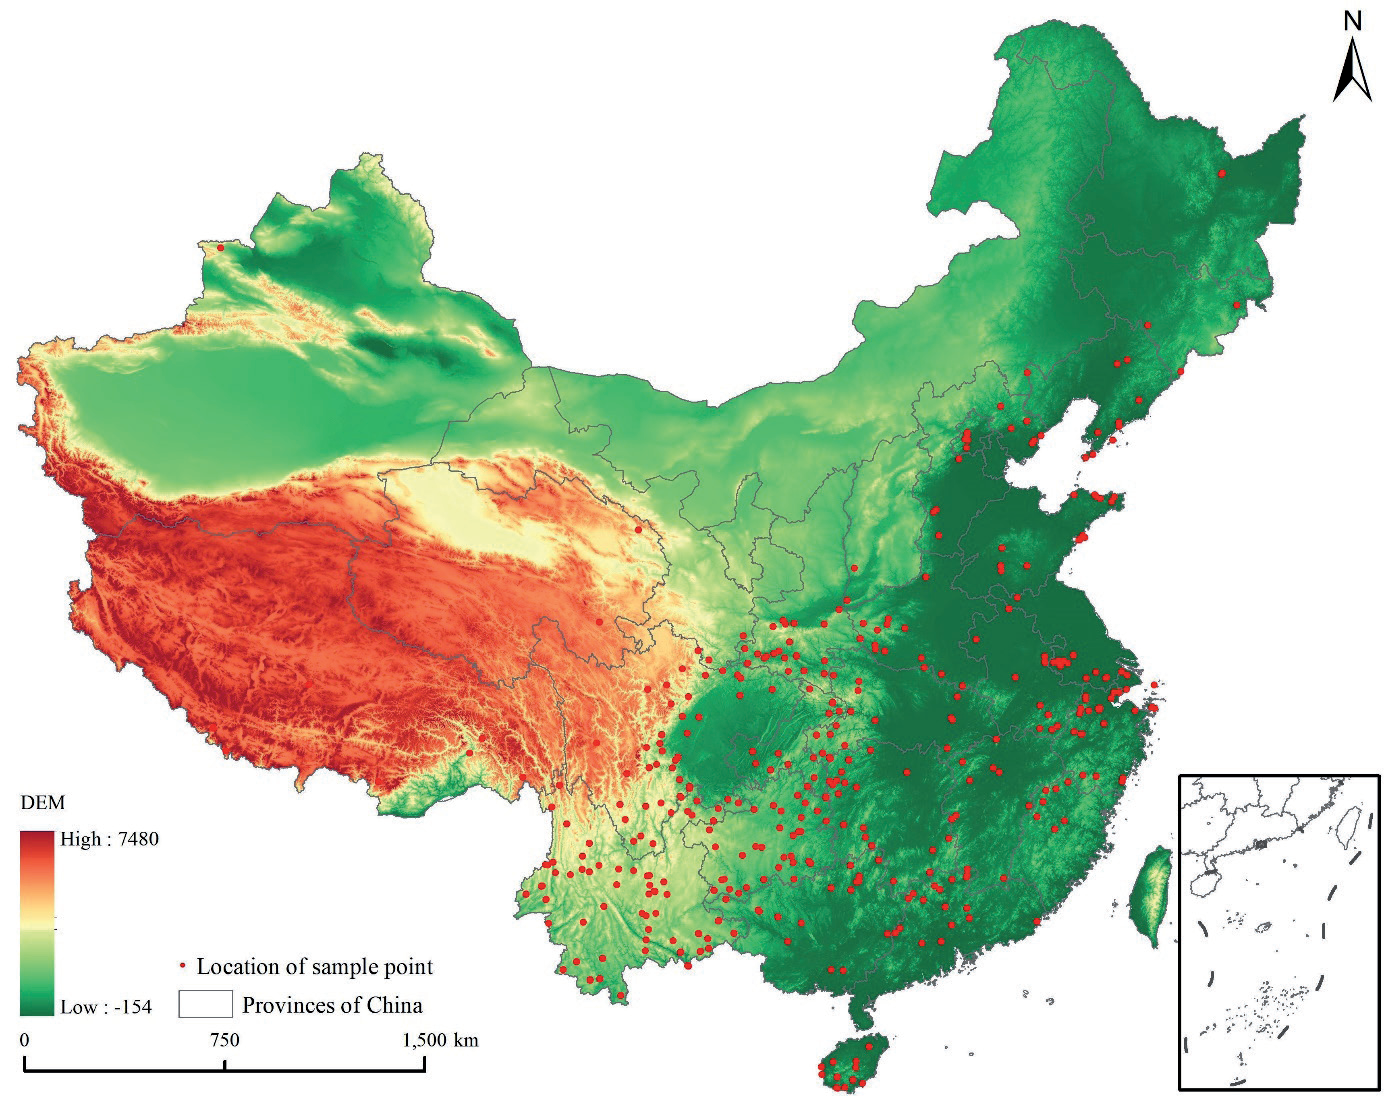
The distribution points of Q. acutissima were mainly obtained from the Global Biodiversity Information Facility (http://www.gbif.org/), Chinese Virtual Herbarium (https://www.cvh.ac.cn/), and National Specimen Information Infrastructure (http://www.nsii. org.cn/) (Fig. 1).
Environmental Variables and Processing
The bioclimatic variables (bio1-bio19) under the current climate were obtained from the WorldClim website (www.worldclim.org), representing average values from the years 1970 to 2000. The bioclimatic variables under four scenarios of future conditions (SSP126, SSP245, SSP370, and SSP585) were obtained from the Beijing Climate Center Climate System Model version 2 (BCC-CSM2). The model participated in CMIP6 historical test simulations and is better suited to the Chinese region. Each scenario was categorized into four periods: the 2030s (2021-2040), the 2050s (2040-2060), the 2070s (2060-2080), and the 2090s (2080-2100). In addition, topographic variables such as elevation, slope, and aspect were used for modeling. A total of 22 environmental variables were converted to ASCII format under ArcGIS 10.5.
Firstly, all the variables were analyzed by MaxEnt to get the contribution rate, and the correlation between the variables was obtained in SPSS. Then, variables with |r|≥0.8 and contribution rate less than 1 were excluded, and finally, 9 variables were kept. The 9 variables are bio2 (mean diurnal range), bio3 (isothermality), bio6 (minimum temperature of coldest month), bio7 (temperature annual range), bio12 (annual precipitation), bio14 (precipitation of driest month), bio15 (precipitation seasonality), slope, and aspect.
Model Construction and Evaluation
The MaxEnt model was constructed based on the sample points of Q. acutissima and environmental variables. Randomly select 75% of the species distribution points as training data, and the remaining points as test data. The cross-validation method was used to randomly divide the species distribution data into ten equal parts, one of which was arbitrarily selected as the test set, and the remaining nine as the training set, and the simulation was repeated for ten times, and the average of the results of the ten runs was taken as the output. The simulation results were output in logistic form. The area under curve (AUC) of the receiver operating characteristic curve (ROC) was calculated to evaluate the prediction accuracy of the model. The value of AUC is from 0 to 1, with the larger value indicating the higher credibility of the prediction results [21]. Based on the output of the MaxEnt model, the potential suitable areas of Q. acutissima were categorized into four levels: unsuitable area (p<0.2), low-suitable area (0.2≤p<0.4), medium-suitable area (0.4≤p<0.6), and high-suitable area (p≤0.6).
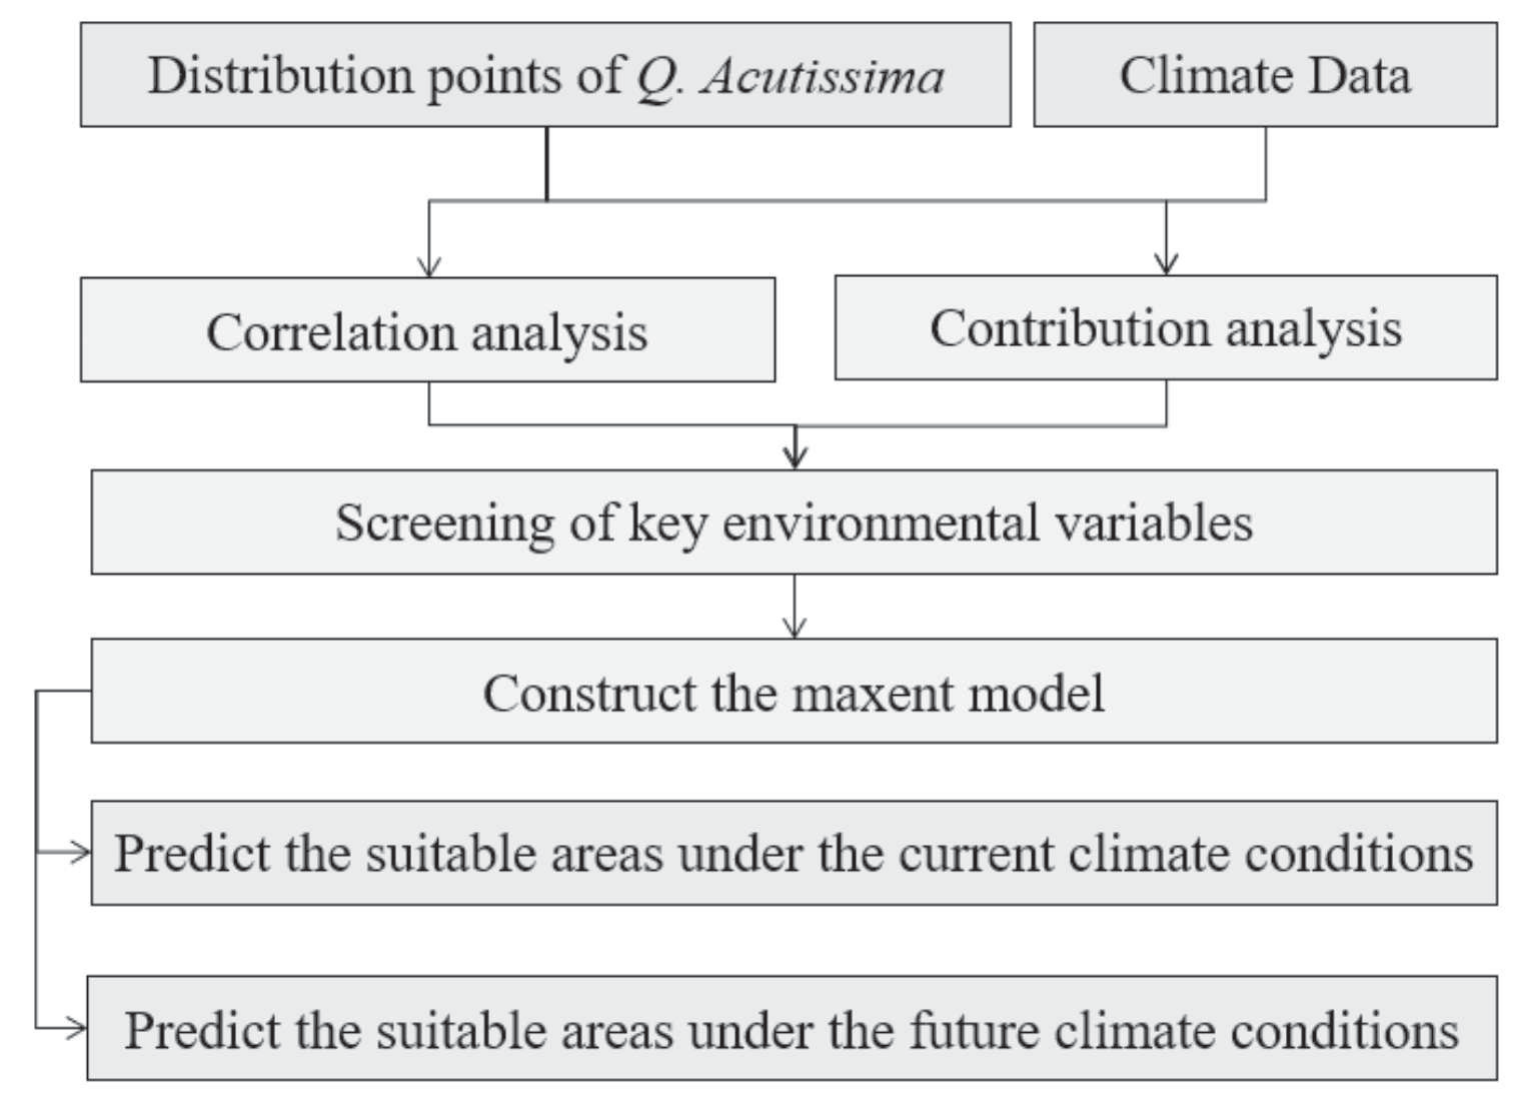
To provide a more intuitive and comprehensive understanding of the entire research process, especially the flow from data input to model construction and finally to result generation, we have created a research flowchart (Fig. 2). It serves as a visual guide, helping readers better follow the logical progression of our research and facilitating the understanding of the relationships between different components of the study.
Results
Analysis of Dominant Environmental Variables
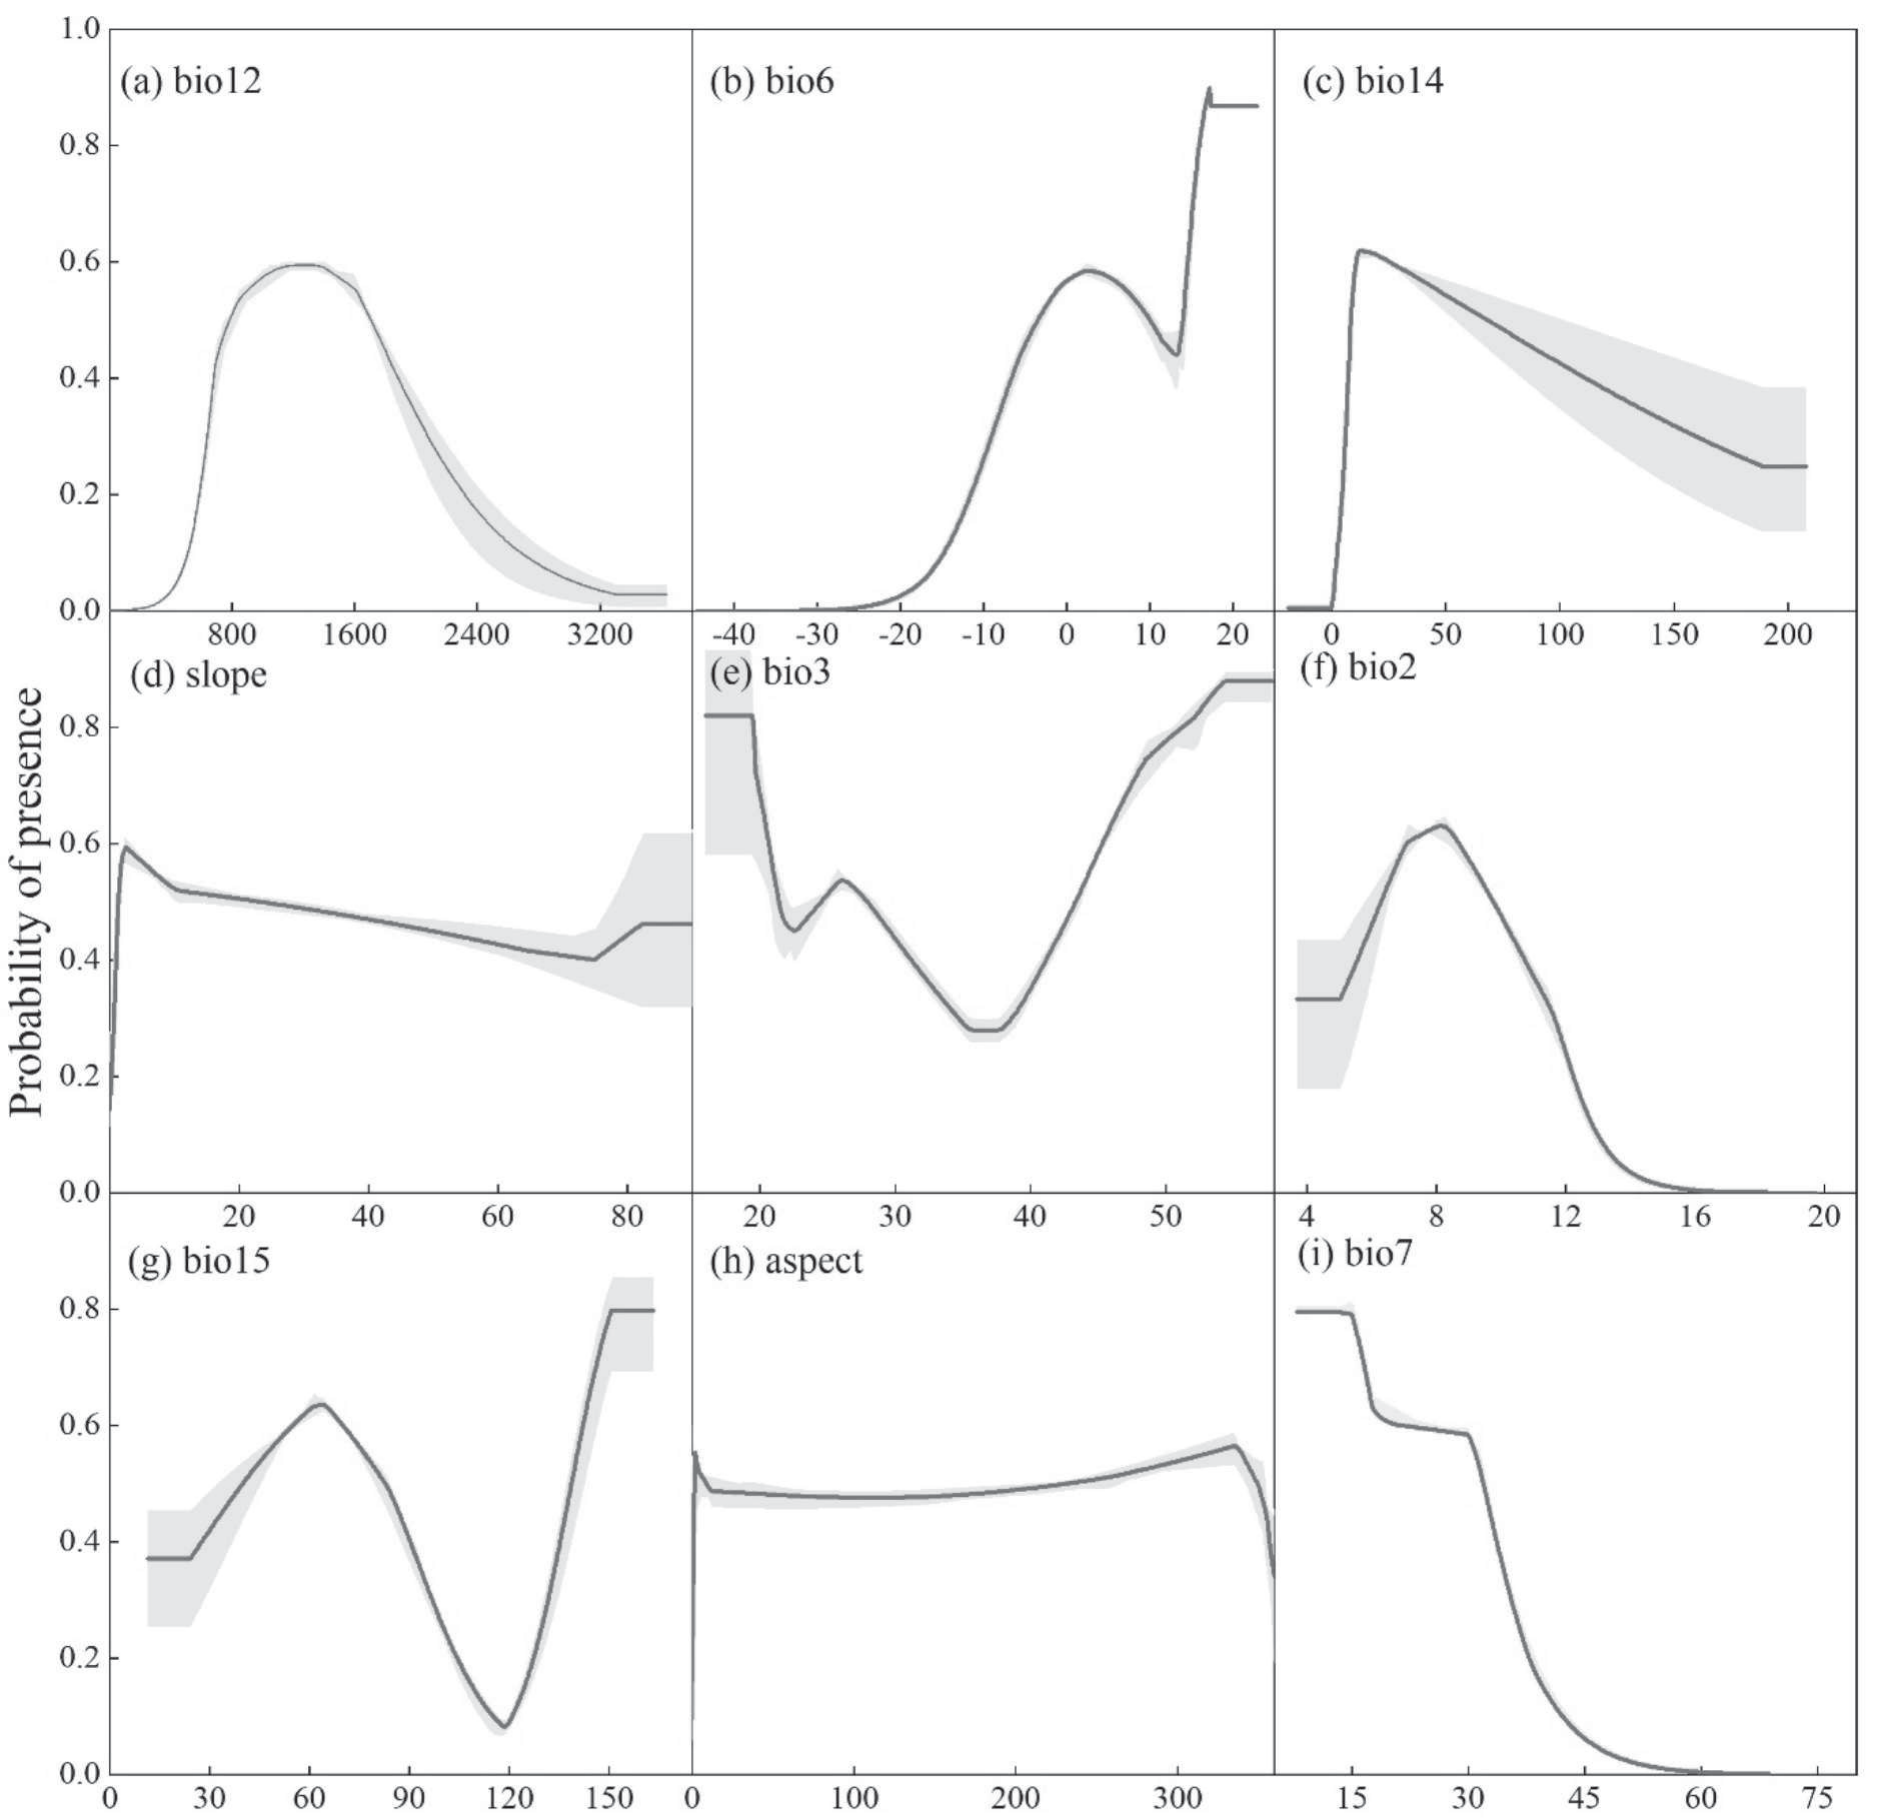
In terms of the contribution of environmental variables, the top six environmental factors were bio12 (38.7%), bio6 (15.1%), bio14 (13.7%), slope (7.5%), bio3 (4%), and bio2 (2.7%), with a cumulative contribution of 81.7%. From the perspective of importance value, the top six environmental factors were bio12 (45.4%), bio7 (10.7%), slope (6.4%), bio3 (5.7%), bio2 (2.6%), bio15 (2.4%), with a cumulative importance value of 73.2%. Among them, the contribution and importance of bio12 were significantly higher than those of other environmental factors, indicating that annual precipitation is the most important environmental factor influencing the potential geographic distribution of Q. acutissima. The response curve reflects the dependence of Q. acutissima on environmental variables. The single-factor response curve was plotted according to the modeling results, as shown in Fig. 3.
The environmental response curves of the MaxEnt model quantify the environmental variables. As can be seen from Fig. 3, when the annual precipitation (bio12) is between 400-1200 mm, the probability of the existence of Q. acutissima rises rapidly. After reaching the peak value (>0.6), it decreases with the increase of precipitation and remains stable after reaching 3200 mm. When the minimum temperature of the coldest month (bio6) is below -25ºC, the probability of the existence of Q. acutissima approaches 0. As the temperature rises, the probability of existence increases rapidly, decreases after reaching 5ºC, rises again when reaching 14ºC, slightly decreases after reaching the peak value (>0.8), and then tends to be stable. When the precipitation in the driest quarter (bio14) is between 0-20 mm, the probability of existence increases rapidly, decreases with the increase of precipitation after reaching the peak value (>0.6), and tends to be stable after the precipitation reaches 170 mm. Within different slope ranges, the probability of the existence of Q. acutissima is above 0.4. The lower the slope is, the (slightly) higher the probability will be. When the isothermality (bio3) is less than 20, the probability of existence is at a relatively high value and is relatively stable, with a specific value exceeding 0.8. When the isothermality is greater than 20, the probability of existence shows a significant downward trend. When the isothermality reaches 23, the probability of existence rises again and then decreases again. After the isothermality reaches 35, the probability of existence tends to be stable. When the isothermality reaches 38, the probability of existence rises again, and gradually tends to be stable after reaching the peak value of 0.89. When the average daily temperature range is between 4-5ºC, the probability of existence remains stable. Then the probability of existence increases with the increase of the daily temperature range difference, and gradually decreases after reaching the peak value. After the daily temperature range reaches 16ºC, the probability of existence gradually approaches 0. When the precipitation seasonality (bio15) is below 30, the probability of existence remains stable, and then increases with the increase of precipitation seasonality. When the probability of existence reaches 0.65, it decreases with the increase of precipitation seasonality. When the precipitation seasonality reaches 120, the probability of existence reaches the minimum value, then rises again, and tends to be stable after reaching the peak value (>0.8). When the aspect is less than 0, the probability of the existence of Q. acutissima also approaches 0. As the aspect increases, the probability of existence rises rapidly, slightly decreases after reaching the peak value, and then remains stable. After the aspect reaches 350, the probability of existence decreases and remains stable after dropping below 0.4. When the annual temperature range (bio7) is below 15ºC, the probability of existence is at the peak value and remains stable. After the annual temperature range is greater than 15ºC, the probability of existence gradually decreases and tends to be stable after reaching 0.6%. As the annual temperature range continues to rise, the probability of existence decreases again. After the annual temperature range reaches above 55, the probability of existence gradually approaches 0.
Spatial Distribution of Suitable Areas for Q. acutissima under Current Climate Conditions
The suitable areas for Q. acutissima are shown in Fig. 4, and the distribution areas and proportions of each suitable area are presented in Table 2. Under the current climate situation, the total suitable area for Q. acutissima in China is 250.7 km2, accounting for approximately 26% of the total land area of the country. The distribution of suitable areas is relatively concentrated, mainly in the central and southeastern coastal regions. The highly suitable areas are mainly distributed in regions such as Yunnan, Hubei, and Sichuan, with an area of approximately 25.6 km2, accounting for 2.7% of the total area. The moderately suitable areas are mainly distributed in regions such as Jiangxi, Hunan, and Guizhou, with an area of approximately 109.9 km2, accounting for 11% of the total area. The low-suitable areas are mainly distributed in regions such as Fujian, Zhejiang, and Shanxi, with an area of approximately 115.2 km2, accounting for 12% of the total area.
Spatial Distribution of Suitable Areas for Q. acutissima under Future Climate Change Scenarios
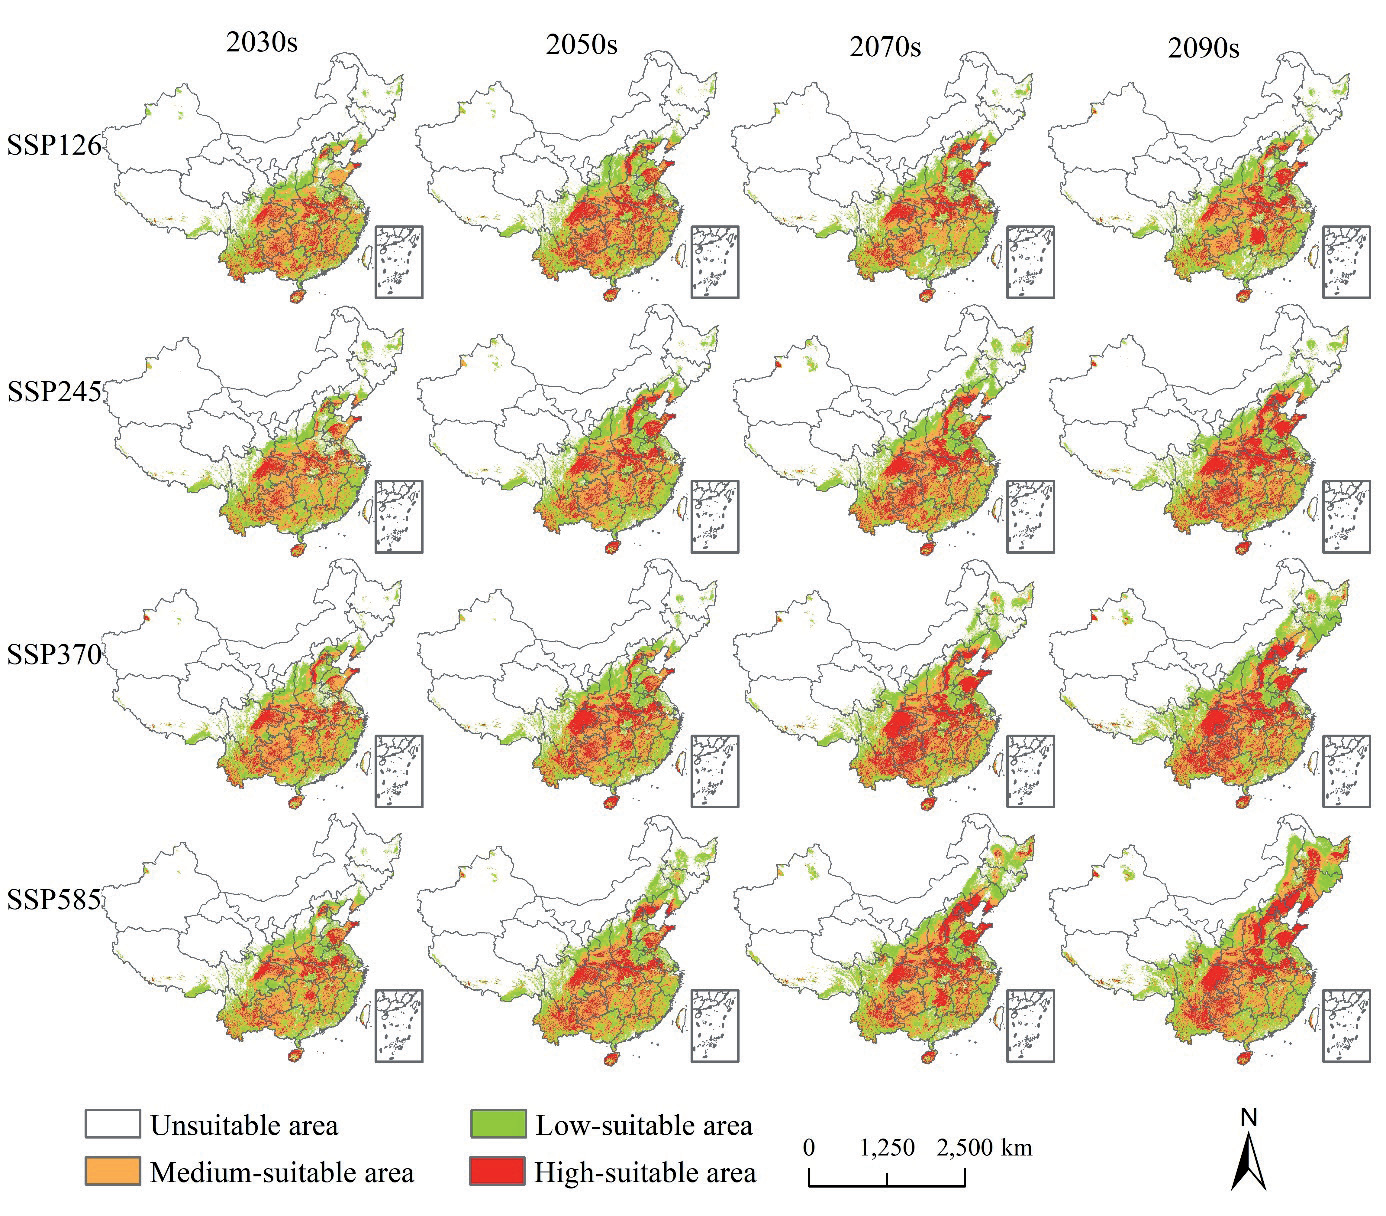
Based on the future climate variables, the MaxEnt model was established. The average AUC values of the results are all greater than 0.89 (Table 2), indicating a high model accuracy. The suitable distribution areas of Q. acutissima in China under the future climate scenarios are shown in Fig. 5. Under different SSP scenarios, the suitable distribution areas of Q. acutissima show certain changing patterns over time. In general, there is a trend of northward expansion in the suitable areas, and the areas and distribution ranges of each suitable area have also changed. Among them, the changes are the most significant under the SSP585 scenario. The highly suitable area and moderately suitable area expand significantly northward with a substantial increase in area, and the low suitable area almost covers most parts of the country. The changes under the SSP126 scenario are relatively gentle.
Table 1.
Environmental variables used for modeling.
Under the SSP126 scenario, the total suitable areas of Q. acutissima in the 2030s, 2050s, 2070s, and 2090s are approximately 285.92 km2, 306.96 km2, 295.82 km2, and 298.32 km2 respectively, representing an increase of 12.34%, 18.35%, 15.27%, and 15.98% compared with the same period. Under the SSP245 scenario, the total suitable areas of Q. acutissima in the 2030s, 2050s, 2070s, and 2090s are approximately 287.02 km2, 318.34 km2, 343.68 km2, and 342.49 km2 respectively, representing an increase of 12.67%, 21.26%, 27.07%, and 26.82% compared with the same period. Under the SSP370 scenario, the total suitable areas of Q. acutissima in the 2030s, 2050s, 2070s, and 2090s are approximately 293.25 km2, 313.85 km2, 362.47 km2, and 405.86 km2 respectively, representing an increase of 14.53%, 20.14%, 30.85%, and 38.24% compared with the same period. Under the SSP585 scenario, the total suitable areas of Q. acutissima in the 2030s, 2050s, 2070s, and 2090s are approximately 293.23 km2, 351.04 km2, 393.07 km2, and 462.14 km2 respectively, representing an increase of 13.64%, 28.6%, 36.23%, and 45.76% compared with the same period. Under the future climate scenarios, the unsuitable areas will decrease compared with the present, while the low suitable areas, moderately suitable areas, and total suitable areas will increase compared with the present.
Centroid Migration in the Suitable Area for Q. acutissima under Climate Change Scenarios
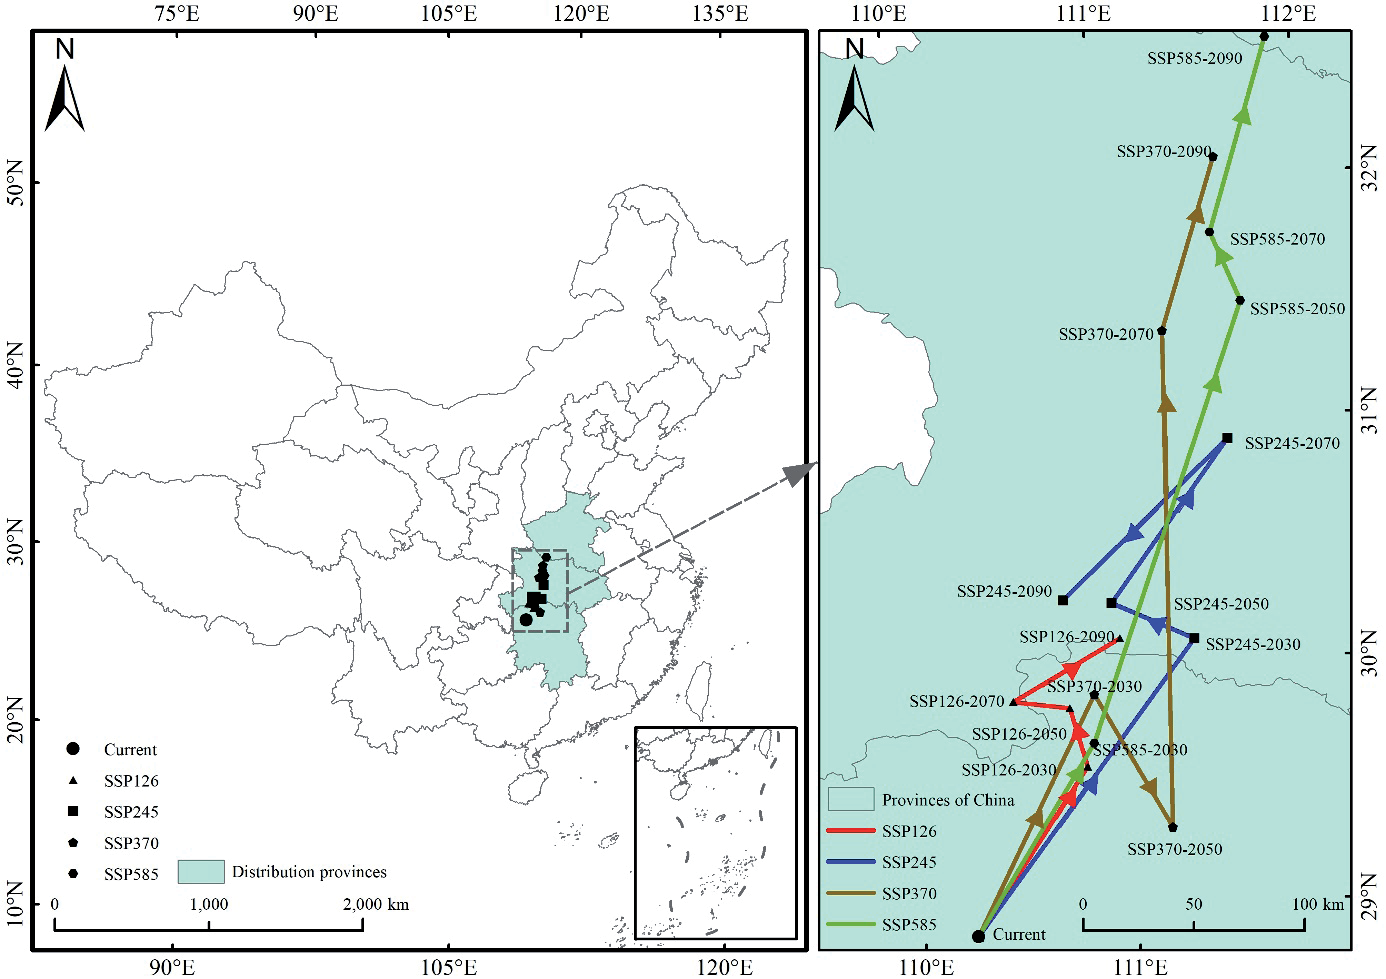
Under different climate conditions, the migration of the distribution center of the suitable areas for Q. acutissima in different periods is shown in Fig. 6. Under the current climate conditions, the center is located in Zhangjiajie City in the northwestern part of Hunan Province (110.25ºE, 28.93ºN). Under the future SSP126 scenario, the center moves northeast in the 2030s (110.81ºE, 29.61ºN), and then moves northwest in the 2050s (110.74ºE, 29.85ºN). In the 2070s, it moves in the northwest direction (110.47ºE, 29.89ºN), and in the 2090s, it migrates in the northeast direction (110.99ºE, 30.12ºN). The distribution center moves from Hunan Province to Hubei Province. Under the SSP245 scenario, the center moves northeast in the 2030s (111.35ºE, 30.11ºN), and then moves northwest in the 2050s (110.97ºE, 30.27ºN). In the 2070s, it moves in the northeast direction (111.57ºE, 30.92ºN), and in the 2090s, it moves southwest (110.73ºE, 30.29ºN), migrating from Hunan Province to Hubei Province. Under the SSP370 scenario, the center moves northeast in the 2030s (110.86ºE, 29.9ºN), and then moves southwest in the 2050s (111.59ºE, 32.09ºN). In the 2070s and 2090s, it keeps moving north and finally reaches the northern part of Hubei Province (110.73ºE, 30.29ºN), migrating from Hunan Province to Hubei Province. Under the SSP585 scenario, the center moves north all the way. In the 2050s, it moves from Hunan Province to Hubei Province, and in the 2090s, it moves to Henan Province (111.88ºE, 32.57ºN).
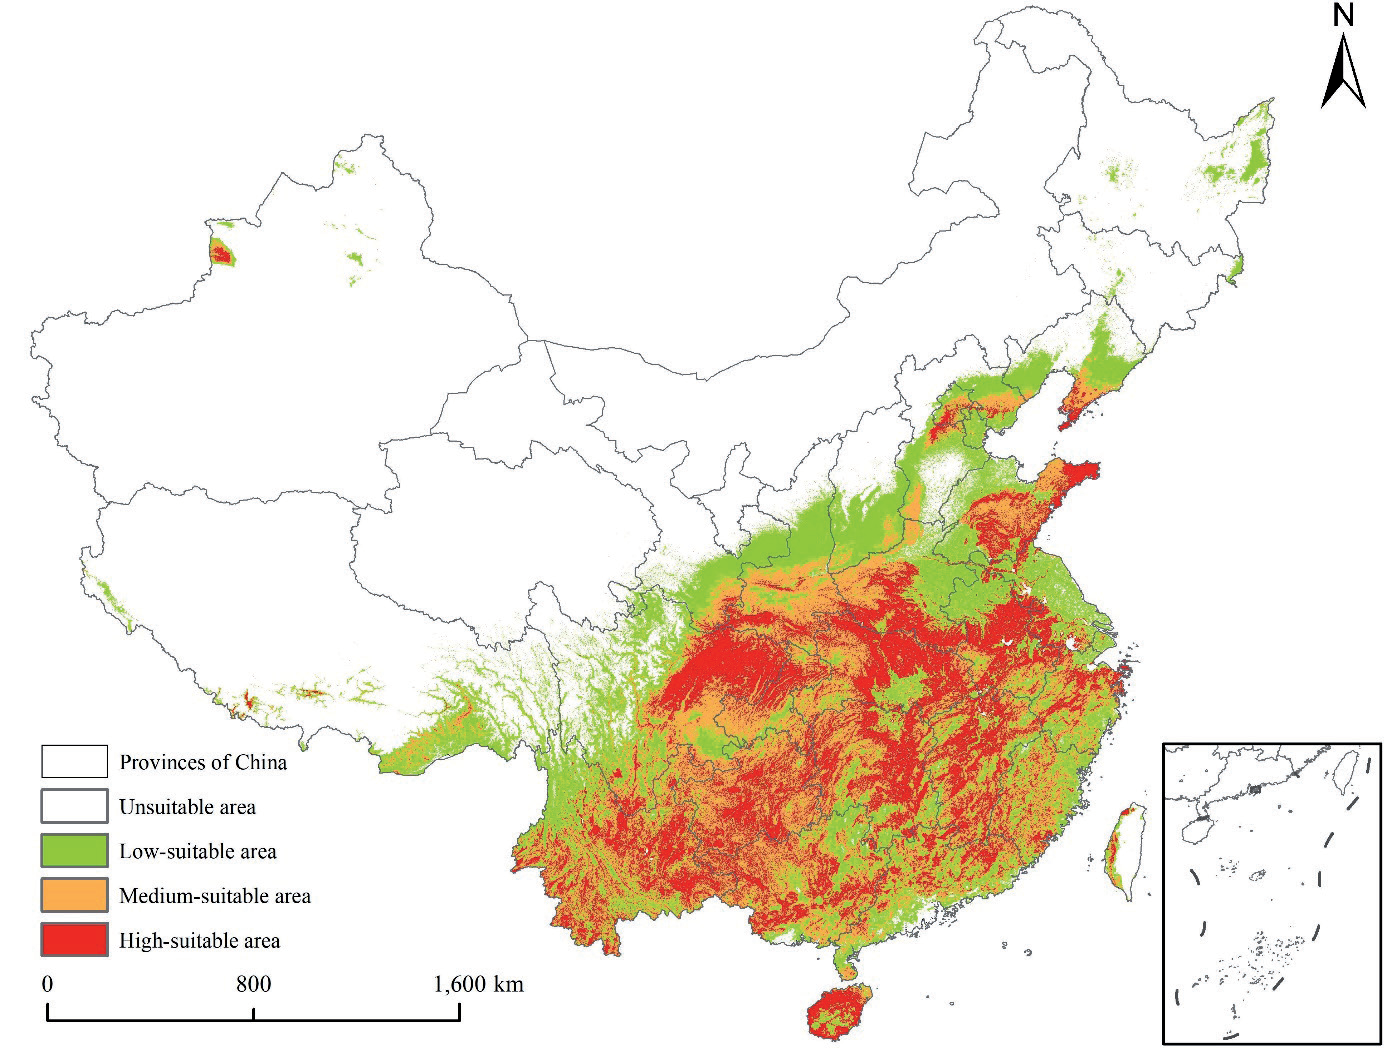
Table 2.
Areas of Q. acutissima suitable areas under different climate scenarios.
Discussion
Main Environmental Factors Affecting the Distribution of Q. acutissima
Annual precipitation (bio12) emerged as the dominant environmental factor influencing Q. acutissima’s distribution, with a high contribution rate and importance value. This corroborates prior studies on other tree species where precipitation played a crucial role in determining suitable habitats. The response curve of bio12 indicates an optimal precipitation range of 400-1200 mm for Q. acutissima’s existence probability to peak. This could be attributed to the tree’s physiological requirements for water during growth, germination, and reproduction processes. Adequate precipitation ensures proper photosynthesis, nutrient uptake, and turgor pressure maintenance in cells.
Fig. 6.
Changes in geographical distribution of centroids in potential suitable areas for A under different climate scenarios.
The minimum temperature of the coldest month (bio6) also significantly impacts distribution. Temperatures below -25ºC pose a severe threat to the species’ survival, likely due to the risk of frost damage to cells and tissues, disrupting metabolic processes. As temperature rises within a certain range, the existence probability increases, but it decreases after reaching 5ºC and shows fluctuations thereafter. This implies that Q. acutissima has adapted to specific temperature thresholds and variations, with its physiological mechanisms fine-tuned to respond to temperature changes. Annual precipitation (bio12) stands out as the most critical environmental factor dictating the distribution of Q. acutissima, with its substantial contribution rate and importance value. The response curve of bio12 reveals that when the annual precipitation lies between 400-1200 mm, the probability of Q. acutissima’s presence surges and reaches its peak. This is because water is essential for the tree’s physiological processes, such as photosynthesis, nutrient transportation, and maintaining cell turgidity during its growth and development stages. Adequate precipitation ensures the normal operation of these processes, thereby facilitating the survival and reproduction of Q. acutissima.
The precipitation of the driest month (bio14) also exerts a significant influence. When the precipitation in the driest month is within the range of 0-20 mm, the existence probability of Q. acutissima ascends rapidly. This indicates that Q. acutissima has a certain tolerance to dry conditions during this period. However, as the precipitation increases beyond the peak value (>0.6), the probability tends to decline and stabilizes when it reaches 170 mm. This suggests that excessive precipitation in the driest month might lead to waterlogging or other adverse effects, affecting the species’ survival. It could be related to the root system’s oxygen supply being affected by excessive soil moisture or the alteration of soil nutrient availability under such conditions.
The mean diurnal range (bio2) is another factor worthy of attention. When the average daily temperature range is between 4-5ºC, the probability of Q. acutissima’s existence remains relatively stable. Subsequently, as the daily temperature range difference expands, the probability initially increases and then gradually decreases after reaching the peak value. Once the daily temperature range exceeds 16ºC, the probability approaches zero. This implies that Q. acutissima has adapted to a specific temperature variation range. A moderate temperature variation might be beneficial for promoting certain physiological activities, like enhancing the tree’s stress resistance. However, excessive temperature fluctuations could disrupt its metabolic balance and physiological functions, thus restricting its distribution.
The precipitation seasonality (bio15) also plays a role in determining the distribution. When the precipitation seasonality is below 30, the probability of existence remains relatively stable. As it increases, the probability first rises until it reaches 0.65 and then declines. When the precipitation seasonality reaches 120, the probability hits the minimum value before rising again and stabilizing after reaching the peak value (>0.8). This indicates that Q. acutissima has adapted to a certain degree of precipitation seasonality variation. A relatively stable precipitation pattern within a certain range is favorable for its growth. However, extreme precipitation seasonality changes could pose challenges to its survival, such as periods of drought or excessive rainfall concentrated in specific seasons, which may affect the tree’s water use efficiency and nutrient uptake rhythm.
To further evaluate the robustness of these findings, we compared our MaxEnt model results with the Random Forest (RF) model. For the influence of environmental variables, the RF model also identified annual precipitation as an important factor. In terms of variable-response relationships, the response curves generated by RF were smoother, suggesting a more continuous and less abrupt change in the probability of Q. acutissima’s existence with respect to precipitation changes. This comparison highlights the differences in how different models represent the relationships between environmental variables and species distribution, and emphasizes the need for a comprehensive understanding when interpreting model results.
Variation of Distribution of Potential Suitable Areas of Q. acutissima
Under future climate change scenarios, the northward expansion of Q. acutissima’s suitable areas indicates its potential to adapt to new climate conditions. The SSP585 scenario shows the most significant changes, suggesting that under high-emission scenarios, the shift in climate factors creates more favorable habitats in northern regions. This could be due to increased precipitation and temperature changes that fall within the species’ adaptable range. However, such expansion also brings challenges. New habitats may have different ecological communities and soil conditions, potentially leading to competition with native species or difficulty in establishing stable populations due to soil nutrient imbalances.
The migration of the distribution center’s gravity reflects the dynamic nature of Q. acutissima’s distribution in response to climate change. The movement from Hunan Province to Hubei Province and even further northward implies that conservation strategies need to be adjusted accordingly. Conservation efforts should not only focus on existing distribution areas but also consider potential new habitats. Monitoring and research in these newly emerging areas are essential to understand the species’ adaptation process and to develop appropriate management measures. Additionally, the decrease in unsuitable areas and the increase in suitable areas call for a reassessment of land use planning in forestry and agriculture. For example, in regions where Q. acutissima is expected to expand, forestry plantations could be planned in advance to promote ecological restoration and economic development while ensuring the species’ survival and growth.
Furthermore, the changes in potentially suitable areas also have implications for biodiversity. The expansion or contraction of Q. acutissima’s distribution may affect associated species in the ecosystem, such as insects, birds, and other plants that rely on it for food or habitat. Understanding these ecological interactions is crucial for maintaining overall ecosystem stability and biodiversity. Future research could focus on studying these complex ecological relationships and developing comprehensive conservation strategies that consider the entire ecosystem rather than just the target species.
Conclusions
This study represents a significant step forward in understanding the potential distribution of Q. acutissima under climate change. The key contributions are as follows: (1) We identified annual precipitation as the dominant factor influencing its distribution, along with other important factors like precipitation in the driest month, mean diurnal range, and precipitation seasonality. By analyzing their relationships with the species’ existence probability through response curves, we gained a detailed understanding of its environmental requirements. (2) We accurately mapped the current suitable areas of Q. acutissima in China, which account for about 26% of the land area, and determined their regional distribution characteristics. We also predicted the northward expansion of suitable areas under future climate scenarios, with the SSP585 scenario showing the most significant changes, providing a basis for understanding the species’ response to climate change.
(3) We tracked the migration of the centroid of the suitable areas for Q. acutissima under different climate scenarios. This helps us understand the dynamic changes in its distribution and provides crucial information for adjusting conservation strategies and land-use planning.
(4) Methodologically, we constructed a reliable MaxEnt model using multi-source distribution data and advanced model environmental variables. Through statistical analysis, we screened influential variables to improve the model’s accuracy, offering a reference for similar studies on other tree species. (5) Our research provides essential theoretical support for the protection, rational development, and utilization of Q. acutissima resources. It also contributes to forestry ecological construction and sustainable development by guiding the formulation of conservation strategies and land-use plans in the context of climate change. Overall, our research fills the knowledge gap regarding Q. acutissima’s response to climate change in China and emphasizes the importance of integrating multi-source data and advanced modeling techniques in predicting species distribution changes.
In future research on Quercus acutissima, multiple directions are worth exploring. Firstly, it’s crucial to study its complex ecological interactions with other species in the ecosystem, including how its distribution changes affect associated organisms, and analyze its ecological niche and relationships with other tree species for better forest ecosystem protection. Secondly, as the interactions among environmental factors are complex, advanced statistical methods like SEM should be used to comprehensively consider the effects of climate, topography, soil, etc., to accurately reveal the driving mechanisms of its distribution. Thirdly, with technological development, more precise and high-resolution data, combined with GIS technology, can improve model accuracy, and exploring or integrating advanced species distribution models can better simulate their distribution dynamics under different climate change scenarios. Finally, research on its adaptive strategies to climate change, including its physiological and ecological adaptability and the role of artificial interventions, as well as assessing genetic diversity among populations, is necessary for resource protection. Overall, our current research fills knowledge gaps and provides methodological references, and future research in these areas will further enhance understanding of its distribution and ecological functions, and support climate change response, forest ecosystem protection, and sustainable forestry development.

