

Introduction
With the acceleration of global urbanization, land use change and climate change have become key factors affecting the regional ecological environment and socio-economic development [1]. Urbanization, as a major driver of land-use change, has not only led to large-scale land-type transformations, but also triggered changes in ecosystem functions and the exacerbation of environmental problems [2]. At the same time, climate change is having an increasingly significant impact on ecosystems, especially changes in temperature and precipitation, which have far-reaching effects on vegetation growth and cover conditions [3]. These changes not only reflect the complex interactions between human activities and the natural environment but also bring new challenges for regional sustainable development.
The impacts of land use change on ecosystems and socio-economics have become a global research hotspot. The Normalized Difference Vegetation Index (NDVI) is widely used as a key tool for monitoring ecosystem changes [4]. International studies have confirmed a general upward trend in global vegetation activity [5], with particularly prominent changes in vegetation cover in Eurasia [6], China [7], and the eastern part of China [8]. Land use change not only changes the spatial pattern and type of terrestrial ecosystems, but also has far-reaching impacts on socio-economic development and ecological evolution [9, 10]. Such changes reflect the complex interactions between socio-economic systems and ecosystems, and the intensity of land-use activities directly reflects the degree of disturbance from human activities [11, 12]. For example, urbanization-and industrialization-driven reduction of arable land has led to a systematic decline in vegetation cover [13], and there are significant effects of different land use practices on seasonal changes in vegetation cover [14]. At the level of driving mechanism, the roles of human factors and policy regulation in regional vegetation cover changes have become increasingly prominent [15]. Empirical analyses in the Yangtze River Basin have shown that anthropogenic activities contributed 20.68% to vegetation change [16], which spatially aligns with the conclusion that anthropogenic activities dominate land-use type transformation and vegetation cover change, as revealed by studies in the Yellow River Basin [17, 18]. Comparison of cross-regional studies showed that the decrease in NDVI due to anthropogenic activities such as intensive farming and deforestation in Okitipupa, Nigeria [19], and the degradation of ecosystem services triggered by agricultural expansion in Ponorogo, Indonesia, and Pangari watershed, India, corroborated the decisive influence of human activities on NDVI changes [20, 21]. The two-factor decomposition model of the Poyang Lake Basin was used to analyze the compound effects of natural and anthropogenic factors on the change of vegetation cover, while the MODIS-NDVI time-series analysis of Guangdong Province presented the whole picture of the ecosystem dynamics in the region [22, 23]. Furthermore, the 1990-2018 study shows that land cover change is one of the main drivers of changes in terrestrial ecosystem services over the last 50 years [24, 25], especially the transformation of natural ecosystems into agroecosystems [26]. These studies provide important references for ecological conservation and sustainable development strategy formulation.
Climate change, especially changes in temperature and precipitation, plays a decisive role in the long-term evolution of vegetation growth and cover [27]. Studies have shown that vegetation cover is on an upward trend in most regions of China, reflecting the response of vegetation to climate change [28]. Moderate warming and increased precipitation can promote vegetation activity, but temperature rises beyond thresholds or sharp precipitation fluctuations can have negative impacts [29]. The IPCC reported that the global temperature increased by about 0.85ºC during the 20th century, and the total amount of the potential global vegetation increased by 13% [30]. Meanwhile, some scholars using biogeochemical modeling have found that in the last two decades of the 20th century, the high latitudes of the Northern Hemisphere experienced a 0.8ºC temperature increase and a trend of greening in vegetation [31]. However, excessive warming accelerates soil moisture evaporation, leading to reduced soil moisture and increased drought, especially in the Southern Hemisphere and at low and middle latitudes in the Northern Hemisphere [32]. In addition, if the alpine Grassland of the Tibetan Plateau warms up to 2.2ºC in the next 10 years, the aboveground biomass of alpine meadows and alpine grasslands will decrease by 6.8% and 4.6%, respectively [33]. Similarly, reduced or unevenly distributed precipitation can exacerbate drought and expose vegetation to water stress [34]. For example, in subduction zones such as the Greater and Lesser Xing’anling Mountains and the Changbai Mountains in China, reduced precipitation can significantly inhibit vegetation growth [35]. Excessive changes in precipitation may also trigger flooding and increase the uncertainty of vegetation growth [36], which adversely affects vegetation growth [37]. A typical example is the heavily desertified areas in eastern and northern Inner Mongolia, where reduced precipitation leads to lower vegetation cover and further worsens the land degradation problem [38]. In different regions of China, there are significant regional differences in the relationship between NDVI changes and climate factors. For example, climate warming over the past 30 years has promoted vegetation recovery in the central and southeastern parts of the Loess Plateau of China, whereas it has inhibited vegetation recovery in the northwestern part of the country [39]. The response of global vegetation growth to climate change varies spatially and temporally. For example, in the arid regions of the Northern Hemisphere, especially Central Asia [40], South Africa, and Australia [41], vegetation growth is mainly affected by precipitation, and there is a time delay in the response of NDVI to precipitation [42, 43]. The key factor driving vegetation change in the south-central region of the Northern Hemisphere is temperature [44]. The greening of vegetation in the Northern Hemisphere over the past 30 years is associated with climate warming and increasing CO₂ levels [45]. Analyses of NDVI data from 1982 to 2013 in the Horn of Africa showed that NDVI changes in the region were positively correlated with precipitation and negatively correlated with temperature [46]. In addition, NDVI in the northern high latitudes and the Tibetan Plateau region exhibited a significant positive phase, with its maximum temperature in a unified time series [47]. Conversely, in the Northern Hemisphere, NDVI was negatively correlated with its corresponding daily minimum temperature [48]. Taken together, these studies reveal the complexity of the impact of climate change on NDVI and the sensitivity and adaptation of different regions and ecosystems to climate factors.
Globally, the impacts of land use and climate change on NDVI have been a hotspot of ecological and climatological research. Studies in this field have broadly covered different land use types such as forest, grassland [49], i.e., focusing on the role of land use change on climate, but also exploring the feedbacks of climate change on land use patterns and the combined impacts of the two on NDVI. International studies have pointed out that the combined effects of land use change and climate change can lead to significant declines in biodiversity, especially in the absence of climate mitigation policies [50]. For example, habitat modification triggered by human land use change is a key factor in current biodiversity loss, and this effect is expected to increase further in this century [51]. Currently, most of the relevant research in China is focused on the Northeast [52], Yangtze River Delta [53], Pearl River Delta [54] and other regions, as well as the Loess Plateau [55], Qinghai-Tibetan Plateau [56], and the southwestern Karst region [57] with a fragile natural ecosystem. Studies for Tianjin have focused on the main urban area of Tianjin [58], Tianjin Port [59], and the Binhai New Area [60], while there are fewer similar studies on land use and climate change in Tianjin as a whole.
As a key port city and core of the Beijing-Tianjin-Hebei synergistic development, Tianjin has experienced rapid urbanization and significant climate change in recent years. Its land-use and climatic spatio-temporal heterogeneity make it an ideal location for research on NDVI dynamics. Tianjin is located in the Haihe River Basin with a fragile ecosystem, studying how land use and climate change impact on NDVI is crucial for the regional ecological restoration and sustainable development. Meanwhile, there are relatively few studies on the combined effects of land use and climate change on vegetation cover in Tianjin. Therefore, this study focuses on Tianjin (2000-2020), quantitatively assessing their impacts on NDVI through spatio-temporal analysis and exploring underlying driving mechanisms.
The perspective of this study emphasizes that urbanization not only reshapes land use patterns but also exacerbates climate change, which in turn poses challenges to the ecological balance and sustainable development of cities. Taking into account the specific situation of Tianjin, this study will focus on the following questions: first, what are the significant land use changes in Tianjin during 2000-2020, and how does it impact vegetation cover patterns (e.g., urban expansion converting agricultural/natural land to built-up areas)? Secondly, how does climate change, especially changes in temperature and precipitation, affect the growth and coverage of vegetation in Tianjin? Thirdly, what is the correlation between temperature and precipitation, and NDVI? Finally, under urbanization, how can effective urban and land management strategies be developed to protect the ecosystem and rationally utilize land resources? Answering these will provide a scientific basis for ecological protection and land management in Tianjin and other rapidly urbanizing cities.
Study Area and Data Sources
Study Area
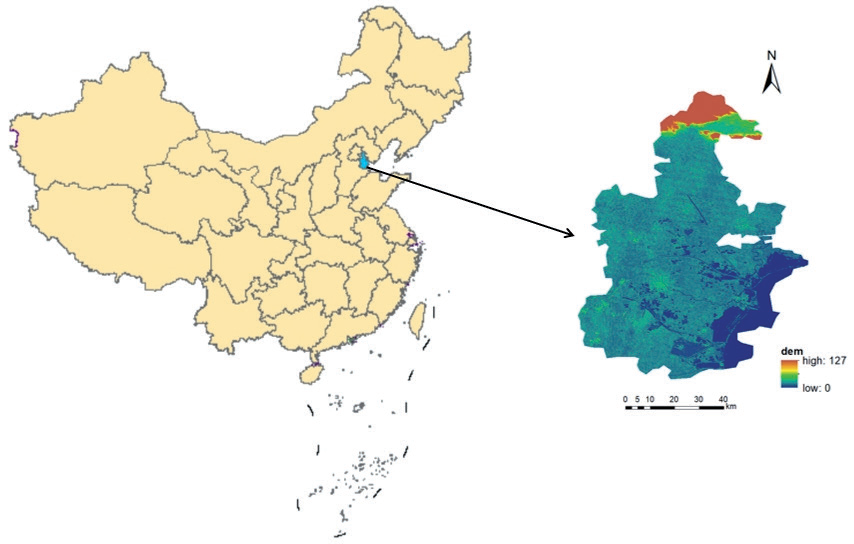
Tianjin is located in North China, in the northeastern part of the North China Plain, in the lower reaches of the Haihe River Basin, between latitudes 38°34′ and 40°15′ north and longitudes 116°43′ and 118°04′ east. Its geographic location is shown in Fig. 1. The city has a total area of 11,966,000 square kilometers and 16 districts. Tianjin has a warm-temperate, semi-humid continental monsoon climate [61], characterized by rich soil types, predominantly tidal soils and salt soils. Vegetation changes significantly with the seasons, with vegetation gradually recovering in spring, growing luxuriantly in summer and autumn, and being relatively sparse in winter. The average annual temperature is about 12ºC, the average annual precipitation is between 360-970 mm, the annual sunshine hours are about 2500-2900 hours, the altitude is generally between 2-5 meters, the terrain is high in the northwest and low in the southeast, the northern part is the southern foothills of the Yanshan Hills, and the rest of the area belongs to the alluvial plains, and there is a lot of wetlands, and it is known as the ‘Nine Rivers Under the Tip’. As the largest port city in northern China and an important core city for the coordinated development of the Beijing-Tianjin-Hebei region, Tianjin is experiencing strong development dynamics. The pace of urbanization continues to accelerate, along with economic growth and population convergence, resulting in a rising demand for building land. By the end of 2023, Tianjin will have a resident population of 13.63 million, with an urbanization rate of 84.88%. The concentration of population and the rapid pace of urbanization have profoundly affected the urban climate of the region, making the heat island effect more and more obvious, and the demand for natural resources has also increased significantly, with changes in the pattern of vegetation cover, continued expansion of the urban area, and the gradual transformation of some of the surrounding agricultural land into building land.
Data Sources
All remote sensing image data used in the study area were obtained from the geospatial data cloud platform, and the Landsat5 TM and Landsat 8OLI_TIRS remote sensing image datasets of Tianjin from 2000 to 2020 were selected, with a spatial resolution of 30 m, a temporal resolution of 16 d, and a unified coordinate system of WGS_1984. In order to improve the data quality, the study was carried out through the Google Earth Engine platform to de-cloud the images and calculate the annual average NDVI of Tianjin from 2000 to 2020 based on the processed images. The land use data were obtained from the China Multi-Period Land Use Remote Sensing Monitoring Dataset published by the Centre for Resource and Environmental Sciences and Data of the Chinese Academy of Sciences (CRESD). The above data were used to study the analysis of spatial and temporal evolution patterns of land use and vegetation index in Tianjin.
The main climatic factors affecting vegetation changes include temperature and precipitation, which tend to have a high correlation. Considering the sensitivity of the study area to these climatic variables, air temperature and precipitation were chosen as the indicators for assessing climate impacts in this study. 2000-2020 annual average air temperature and precipitation data were obtained from the China Statistical Yearbook, and individual missing values were supplemented by linear interpolation. All the above data span from 2000 to 2020, because a 20-year study period can fully reflect the long-term evolutionary characteristics of land use and vegetation cover, and at the same time capture important cyclical patterns of change.
Research Methodology
Evaluation of Land Use and Classification Accuracy
According to the secondary classification of Chinese Academy of Sciences (CAS), combined with the geographical characteristics of the study area, the remote sensing images were spatially cropped and reclassified by Arcgis 10.8 software, and the land use types in Tianjin were divided into six primary types: agricultural land, forest land, grassland, waters, building land and unused land. The spatial distribution data of land use types in the study area in 2000, 2005, 2010, 2015, and 2020 were obtained for five periods. In order to ensure the classification accuracy, the Random Forest algorithm was used to verify the classification results of each period, and the results showed that the overall accuracy of the classification results of the five-phase images was above 85%, and the Kappa coefficient was above 0.8, so the accuracy of the classification results met the requirements. The reasons for choosing a 5-year interval for the study of land use change are: firstly, this time scale can effectively capture the dynamic characteristics of land use change and ensure the availability of data; secondly, a 5-year interval reflects the evolutionary trend of land use and facilitates the systematic collection and analysis of data; and lastly, this time span coincides with the cycle of the socio-economic development planning in the study area, which is beneficial to revealing the impacts of human activities on land use. Finally, this time span coincides with the socio-economic development planning cycle of the study area, which is conducive to revealing the impact of human activities on land use patterns.
Normalized Difference Vegetation Index (NDVI)
NDVI is a simple and efficient metric for analyzing satellite images to quantify vegetation by measuring the difference between near-infrared (strongly reflected by vegetation) and red light (absorbed by vegetation). NDVI can better reflect the growth status of vegetation, so it is widely used in the fields of vegetation dynamics change monitoring, crop growth estimation, and vegetation feature identification [62]. The calculation formula is:
In the formula, NDVI is the normalized vegetation index, NIR is the near-infrared reflectance value, R is the red-band reflectance value, the NDVI value ranges from -1 to 1, -1 means visible light is highly reflective, 0 means there are rocks or bare soil, etc., and greater than 0 means there is vegetation cover, the larger the value of NDVI, the more luxuriant the vegetation is, and 1 means that the vegetation cover is almost saturated, but in practice the value of NDVI will rarely reach 1 in reality, because even in very dense areas, the reflectance of the vegetation may not reach 100%, and some light will always be absorbed or scattered. However, in practice, the NDVI value rarely reaches 1 because even in very densely vegetated areas, the reflectance of vegetation cannot reach 100%, and some light is always absorbed or scattered [63].
Land Use Transfer Matrix
The conversion relationship between land uses can be described by a land use transfer matrix, which can not only show the conversion between different land types in a quantitative way, but also reveal the rate of conversion between these land use types [64]. The decoded land use/cover type maps were analyzed and calculated using ArcGIS 10.8 software, which in turn calculated the land use transfer matrix with the expression
In the expression, Sij denotes the area of pre-transfer land type i converted to post-transfer land type j, i and j denote the pre-transfer and post-transfer land use types, respectively, and n is the number of pre-transfer and post-transfer land use types.
Impact of Land-Use Change on NDVI
As one of the core indicators of vegetation cover, NDVI can effectively reflect the inter-annual and seasonal dynamics of vegetation growth activities, and thus has been widely used in the research fields of vegetation-climate relationship and vegetation-precipitation relationship. Among the changes in many environmental factors, the changes in vegetation cover are significantly associated with human activities and climate change, and the changes are mainly caused by the combined effects of these two driving factors [65, 66]. Among them, the impact of human activities is usually quantitatively characterized by land use change LUCC. Based on this, the total vegetation index change (ΔX) in the study area over a specific time period can be expressed as:
In Equation (3), Fni and Fnj denote the average vegetation index for a given land type n in periods i and j; Sni and Snj denote the area of a given land type n in periods i and j, with j>i; QLUCC denote changes in vegetation cover due to land use; and Qc denote changes in vegetation cover due to climate change.
If only the effects of human activities are considered, and assuming that the average NDVI in a given time period remains constant, the change in vegetation cover due to land use change and its proportion of the total change in vegetation cover can be expressed as [67], respectively:
The quantitative assessment of the contribution of a given land-use change type to vegetation cover change, i.e., its proportion of land-use-induced vegetation cover change, can then be expressed as follows:
A positive value of σ indicates an increase in vegetation cover as a result of a change in a land type, while a negative value indicates a decrease.
Results and Analyses
Analysis of Spatial and Temporal Evolution of Land Use
Changes in Land-Use Types
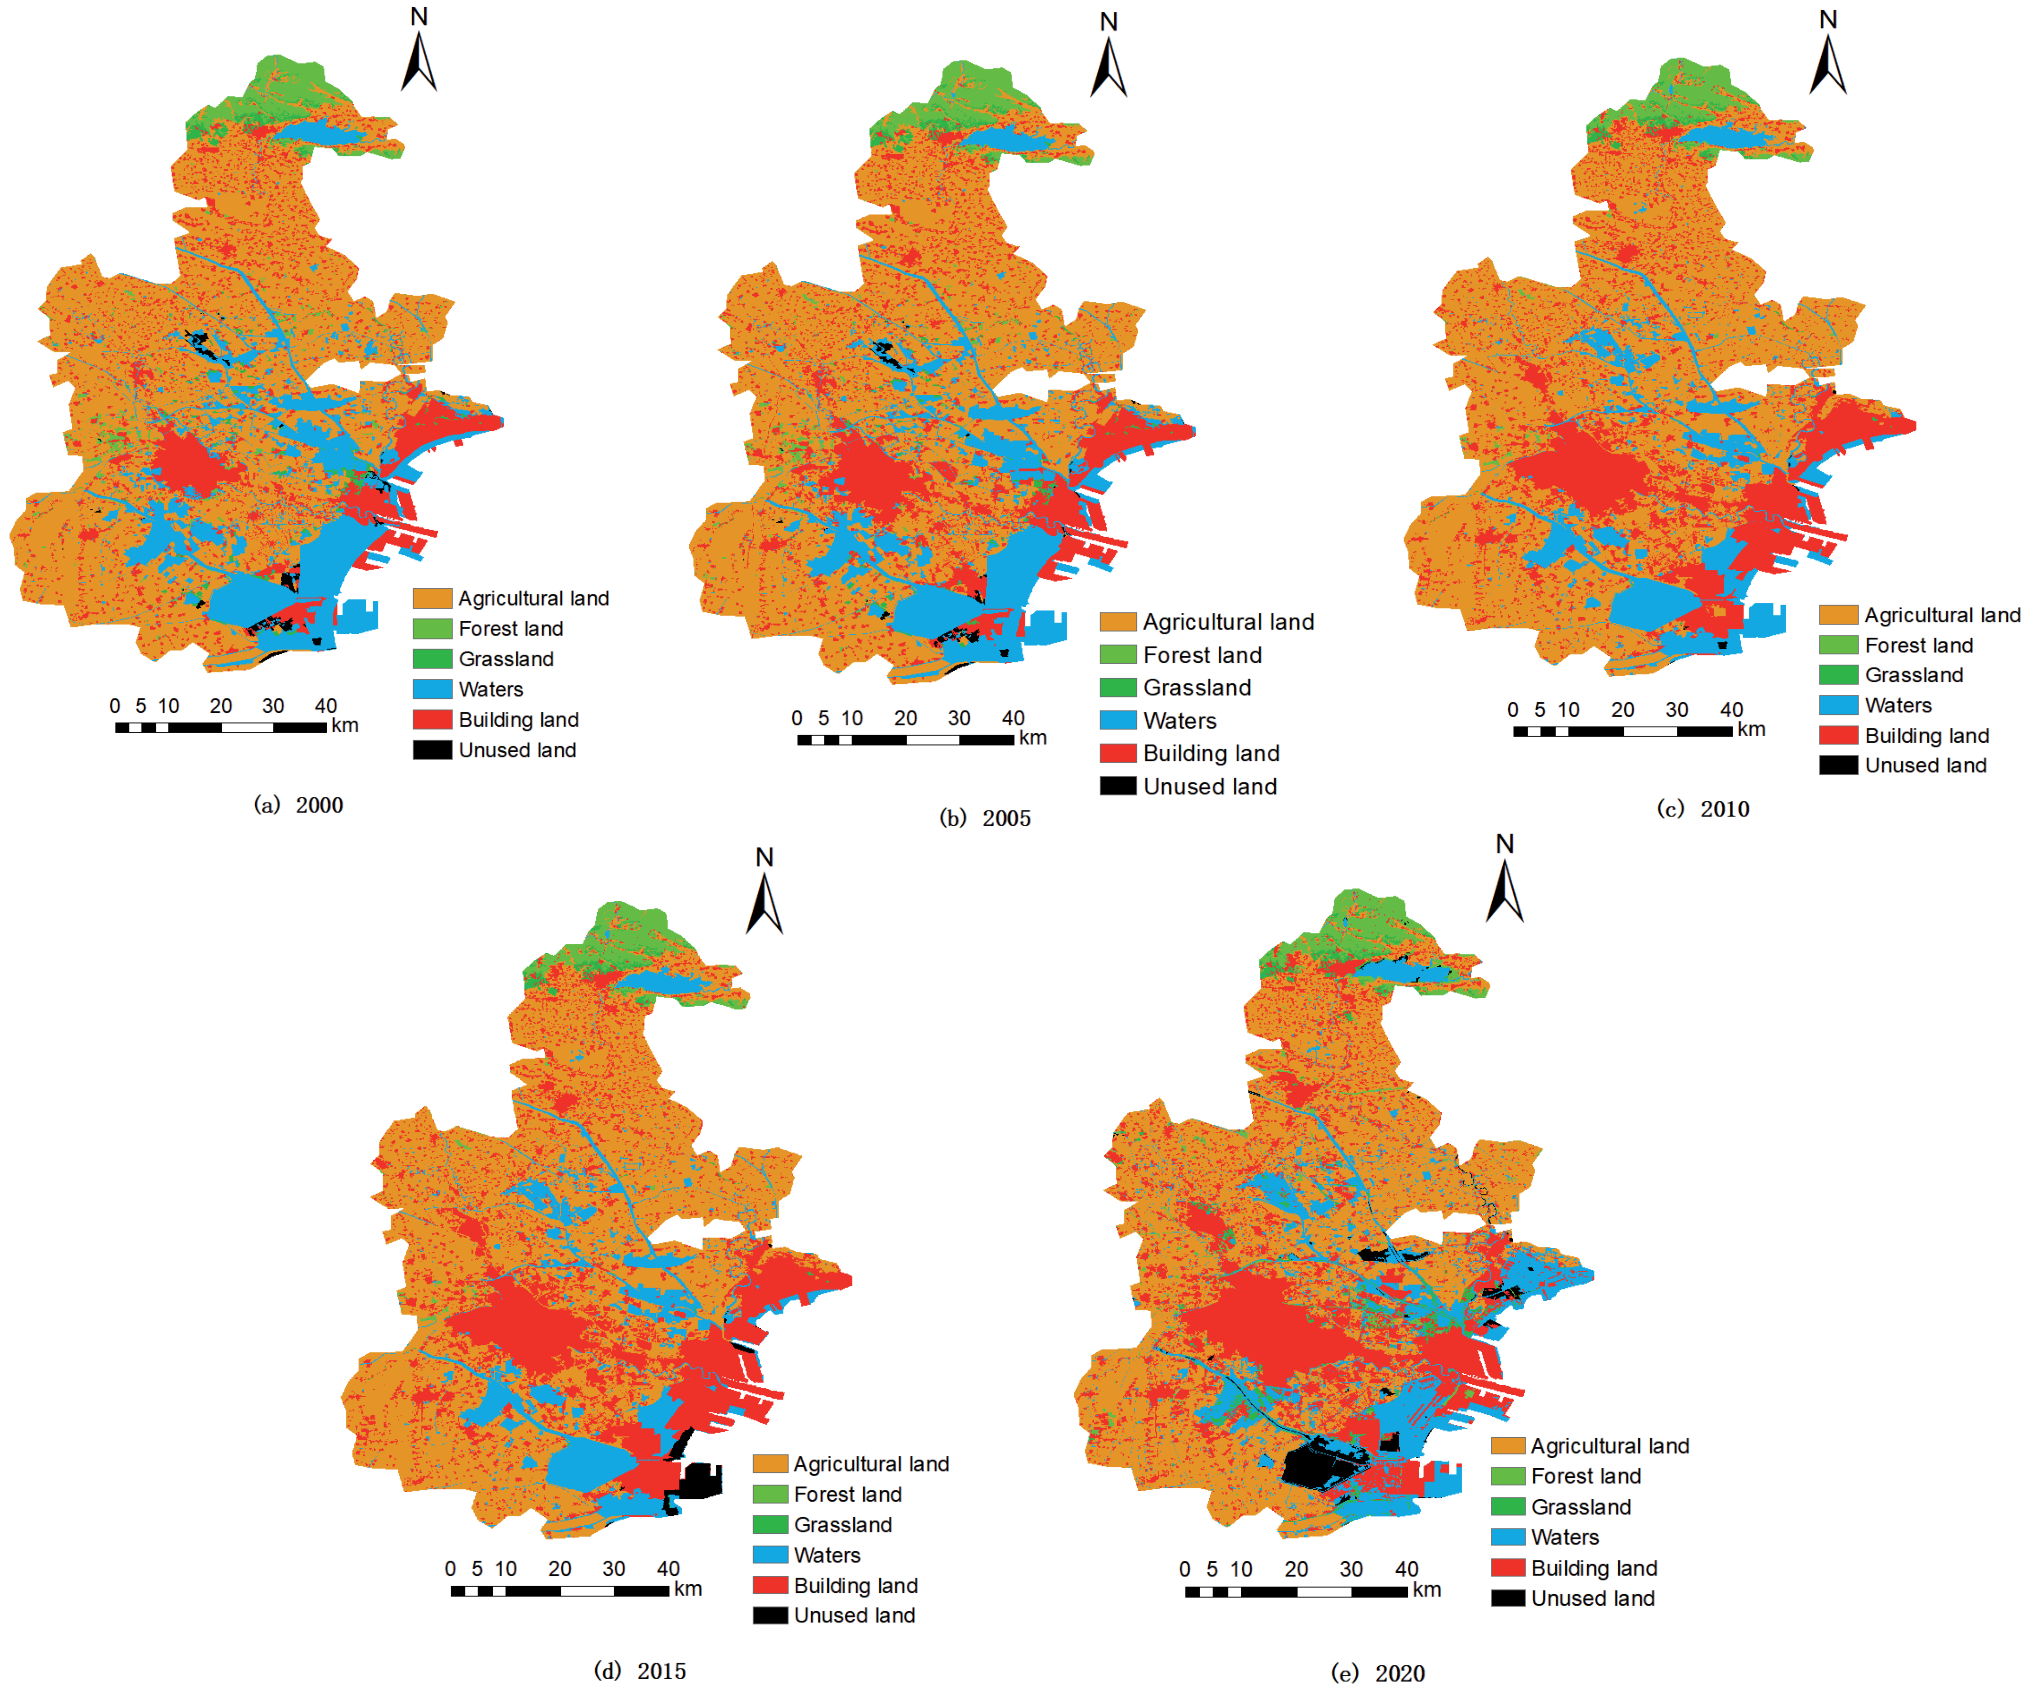
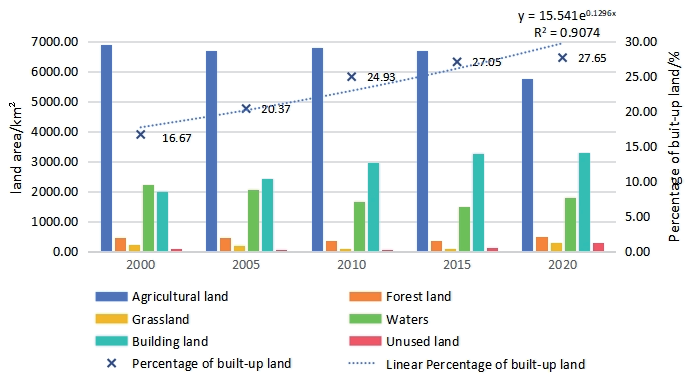
Land use changes in the study area from 2000 to 2020 are shown in Fig. 2, and the area and percentage of each land use type are shown in Table 1 and Fig. 3. Regarding land use structure, agricultural land was the dominant type of land use in Tianjin during the study period. From 2000 to 2020, the area and proportion of each land use type showed significant dynamic changes. Forest land area first decreased and then increased, from 2000 to 2010, forest land area decreased from 466.55 km² to 354.15 km², and its proportion decreased from 3.94% to 2.99%; from 2010 to 2020, forest land area rebounded to 473.15 km², and its proportion decreased from 3.94% to 2.99%; from 2010 to 2020, forest land area increased to 473.55 km². Forest land area rebounded to 473.32 km², accounting for 3.99% of the total. Grassland area shrunk significantly from 2000-2010, from 219.71 km² to 94.43 km², with a share of 1.86% to 0.80%; it increased slightly from 2010- 2015, and then increased significantly to 302.43 km², with a share of 2.55%, from 2015-2020, which may be attributed to the ecological restoration and the grassland protection policy. The area of waters continued to decrease from 2000-2015, from 2212.75km² to 1485.22 km², with a share of 18.69% to 12.35%, reflecting the crowding out of waters space by urban construction; it rebounded from 2015-2020, to 1777.90 km², with a share of 14.98%, indicating that waters This indicates that the protection and restoration measures have begun to bear fruit.
The area of building land showed a continuous growth during the study period, from 1974.10 km² in 2000 to 3280.90 km² in 2020, with the proportion of building land increasing from 16.67% to 27.67%. 16.67% to 27.65%, which is in line with the rapid urbanization process in Tianjin, where urban expansion, infrastructure construction, and industrial development have all contributed to the expansion of building land. Unused land is more complex, with a drastic decrease in the area from 2000 to 2010, from 85.92 km² to 7.29 km², with a share of 0.73% to 0.06%. 0.73% to 0.06%, mainly due to the increase in the intensity of land development and utilization; from 2010 to 2020, the area of unused land increased significantly to 285.99 km², accounting for 2.41%, probably due to the rational planning of land resources and the protection and control of part of the undeveloped areas. Meanwhile, as one of the major land use types in Tianjin, the area of agricultural land, as a whole, shows a decreasing trend during 2000-2020, decreasing from 6883.35 km² to 5744.96 km², with the proportion decreasing from 58.12% to 48.42%, and this change is mainly attributed to the competition for land resources in the process of urbanization, the expansion of building This change is mainly attributed to the competition for land resources in the process of urbanization, the expansion of building land and the restructuring of agriculture, which has taken up a large amount of agricultural land.
Land Use Transfer
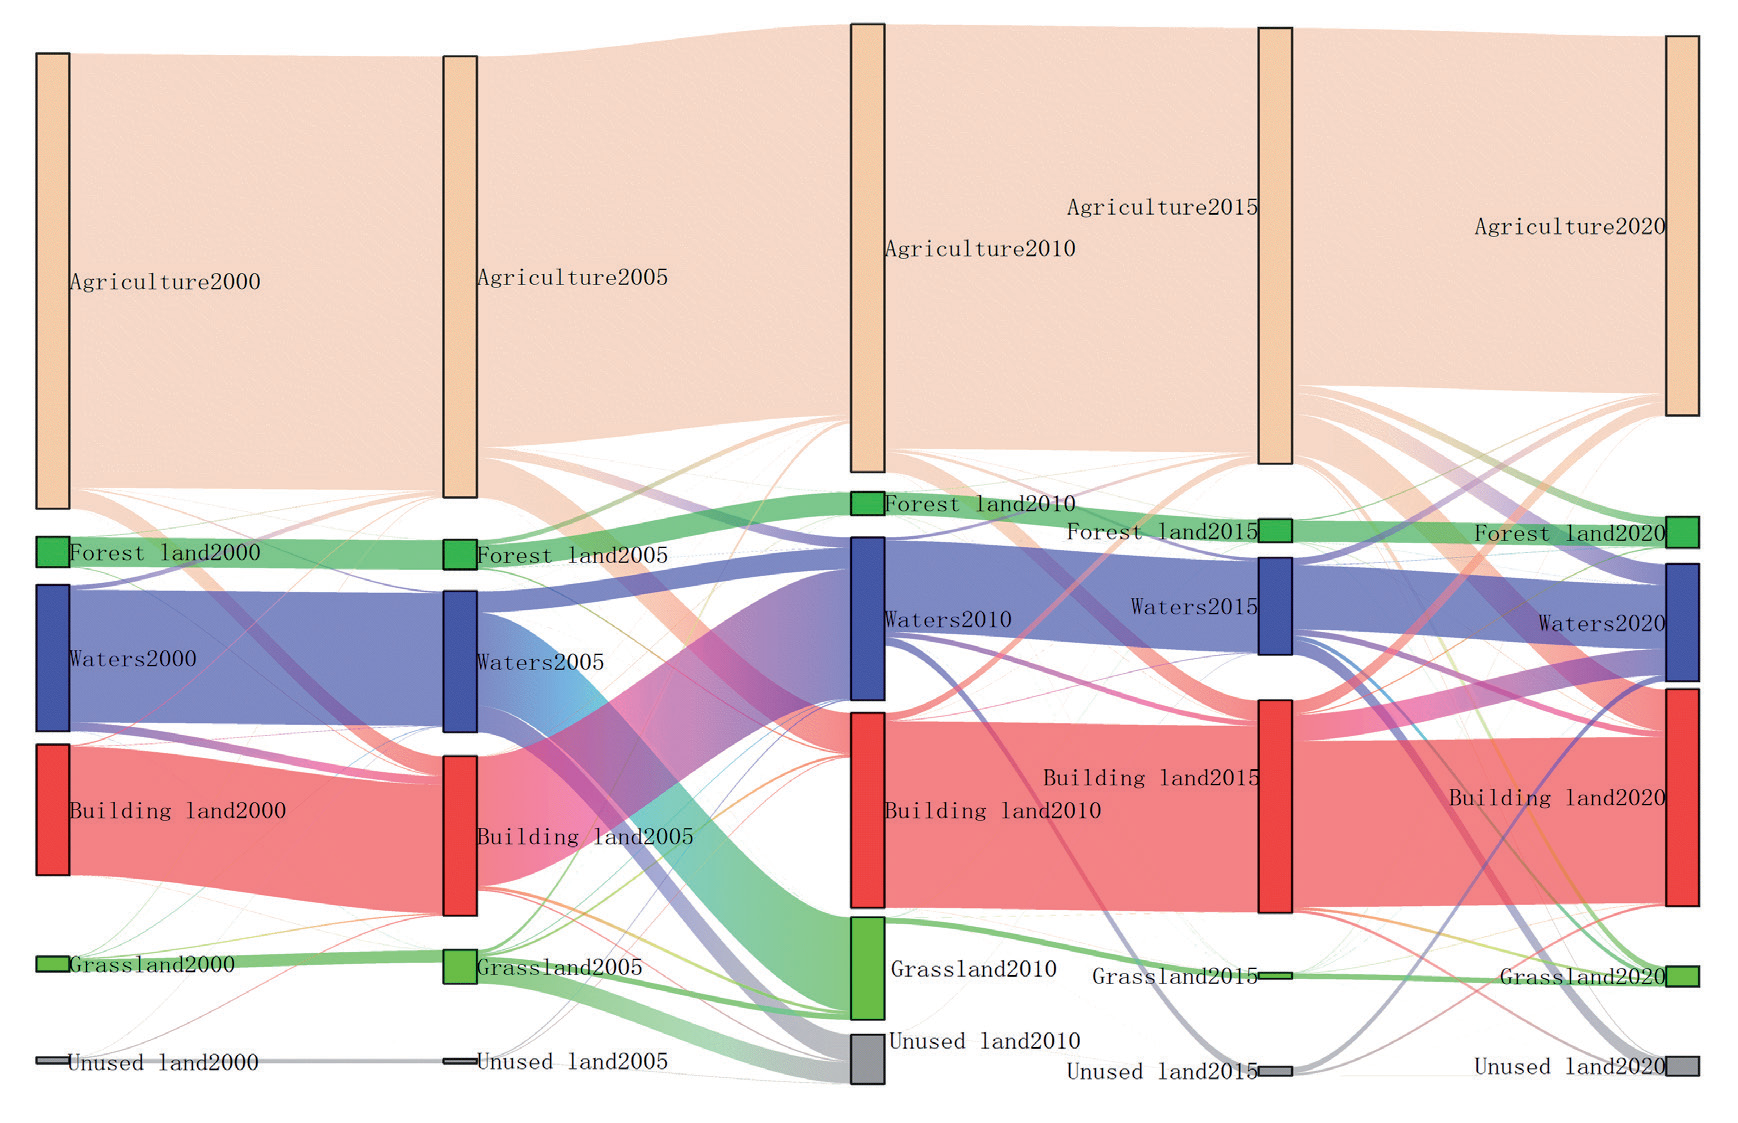
Based on the above data and charts, it can be observed that there is a turning point in land use in the study area around 2005, after which the area of forest land, grassland, and waters decreases sharply and is much smaller than that in the years before 2005. At the same time, building land shows a continuous growth trend. In order to analyze the land use transfer between 2000 and 2020 in more depth, we divide this period into four stages and analyze the land use transfer in each stage. The transitions between land use types in the two periods are represented by transfer matrices, as shown in Table 2. To make a more intuitive observation of these conversions, the data were visualized as shown in Fig. 4.
In the first phase, from 2000 to 2005, there was a certain scale of transfer out of agricultural land as the basic land use type, which was partly converted into forest land (2.461 km²), grassland (0.389 km²), waters (0.864 km²) and building land (2.822 km²), indicating the diversified demand for land in the early stages of urbanization. The area of forest land increased significantly in this period, mainly from the transfer of other land types, especially 287.804 km² from waters, showing the importance of forest land in ecological construction. The expansion of building land, on the other hand, relies mainly on the occupation of agricultural land and waters, which amount to 2.822 km² and 71.393 km² respectively, reflecting the encroachment of land resources by the process of urbanisation, and the rapid development of urban construction, which requires more land to satisfy the needs of infrastructure construction, housing and industrial development. The area of grassland decreased during this stage, primarily due to the conversion to forest land and building land, which totaled 11.884 km² and 0.041 km², respectively. This conversion is related to the dual needs of urbanisation and ecological construction. On the one hand, part of the grassland is used for afforestation in order to increase the area of forest land to improve the ecological environment; on the other hand, the urban expansion also occupies a certain amount of grassland resources. Unused land is mainly retained in this stage, and only a small amount is converted to building land (0.142 km²), indicating that the land development in this stage is still in the initial stage, and the development degree of unused land is relatively low.
Table 1.
Statistics on the area and area share of each land use type in Tianjin from 2000 to 2020.
The second phase spanned from 2005 to 2010. During this phase, agricultural land continued to be transferred out, mainly to forest land (4.694 km²), grassland (1.554 km²), and building land (0.224 km²). This phenomenon reflects the adjustment of land use structure under the double influence of urbanisation and ecological construction. Forest land area further increased in this period, with a large amount of conversion from water (602.698 km²) and grassland (23.197 km²). This indicates that Tianjin increased its efforts in ecological construction during this period by converting waters and grasslands to forest land, thereby increasing forest cover and improving the ecological environment. The rapid expansion of building land is one of the distinctive features of this stage, which is mainly derived from forest land (319.066 km²) and waters (317.472 km²), showing the urgent demand for space for urban construction. The grassland area continues to decrease in this stage, mainly being transferred to forest land and building land, which further highlights the competing nature of land use in the process of urbanization and ecological construction. Unused land is also partly developed into building land (0.448 km²) at this stage, but a certain proportion is still retained, indicating that land development is progressing gradually but has not yet reached the level of large-scale development.
The third phase spans the period from 2010 to 2015. At this stage, agricultural land remains the primary type of land transfer, primarily converted to forest land (1.865 km²), grassland (4.266 km²), and water (2.138 km²), reflecting the dynamic allocation of land resources among different uses. As urban development and ecological construction continue to advance, the demand for land becomes more diverse and refined. The area of forest land increased steadily during this period, mainly from the conversion of other types of land, such as water (115.674 km²). Building land continued to grow during this period, although the expansion trend slowed down, mainly from water (47.137 km²) and forest land (10.439 km²). The area of grassland decreased slightly during this period. Grassland decreased slightly during this period, partially converted to building land. Unused land appeared to be developed on a larger scale in this stage, mainly for building land (131.402 km²), which reflects that as urban development deepens, the intensity of development and utilization of land resources continues to increase, and unused land has become one of the most important sources to meet the demand for urban building land.
The fourth phase is between 2015 and 2020. During this phase, the trend of agricultural land transfer out continues, with major conversions to forest land (4.869 km²), grassland (2.261 km²), waters (5.854 km²), and building land (3.006 km²). The area of forest land increased further during the period, thanks to the conversion of waters (197.808 km²) and grassland (19.610 km²). The expansion of building land accelerated in this phase, mainly from forest land (395.905 km²), waters (313.187 km²), and grassland (2.061 km²). The area of grassland decreased sharply in this phase, and was mainly transferred out to forest land, building land, and waters, which is closely related to the dual needs of urbanization and ecological construction. Unused land is partly developed into building land (93.605 km²), while other land types are also transferred into it (e.g., forest land is transferred into it; 37.989 km²), which reflects the more complex dynamic change of land use. This suggests that the dynamic change in land use is more complex, and unused land plays a crucial role in both urban development and ecological protection. Therefore, its development and utilization require a comprehensive consideration of various factors.
Overall, land use in Tianjin has changed significantly during the period of 2000-2020, and the advancement of urbanization has led to the continuous expansion of building land, which mainly relies on the occupation of agricultural land, forest land, waters, grassland, and other land types. Meanwhile, the continuous development of ecological construction has led to an overall increase in the area of forest land, reflecting the trade-off and adjustment of land use between economic development and ecological protection. These changes have had a profound impact on the ecological environment, urban development pattern, and sustainable development of Tianjin.
Table 2.
Land-use area conversion matrix.
Analysis of the Spatial and Temporal Evolution of NDVI
Characteristics of the Inter-Annual Evolution of NDVI
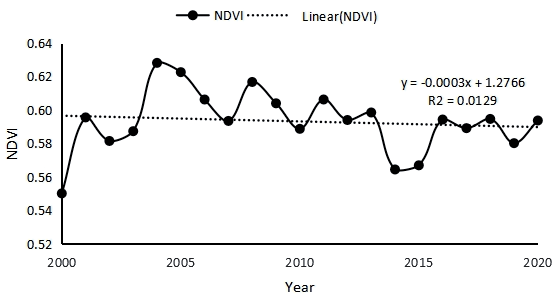
NDVI represents the sparseness of vegetation in an area, and when the level of urban development increases, NDVI values continue to decrease. In most cases, the NDVI values in urban areas are lower than those in non-urban areas, and as the average NDVI continues to decrease, the average surface temperature tends to increase. To explore the interannual change characteristics of vegetation cover in Tianjin, the raster NDVI data from 2000 to 2020 were processed to obtain the annual average NDVI folding map of the study area from 2000 to 2020, as shown in Fig. 5. The average NDVI values from 2000 to 2020 were 0.55, 0.62, 0.59, 0.57, and 0.59. The vegetation index was relatively stable between 2000 and 2020, fluctuating around 0.58, with an overall slow downward trend.
To further investigate the spatial and temporal evolution characteristics of vegetation cover over different periods, remote sensing inversion was employed to generate spatial pattern distribution maps of annual average NDVI for the study area across five periods, as illustrated in Fig. 6. Based on the overall trend, the NDVI values in certain regions exhibited a significant increase from 2000 to 2010. However, the NDVI values in some regions started to show a decreasing trend since 2010. Combined with Fig. 2, a clear expansion trend is evident in the area of building land in Tianjin between 2000 and 2020. In 2000, building land was mainly concentrated in a few core areas; in 2010, it began to expand outward; and in 2020, the expansion of building land was more significant, especially in the east and south areas of the city. At the same time, the area of agricultural land is gradually decreasing, and a large amount of agricultural land has been converted into building land. In addition, waters have been adjusted in some areas, and the distribution and area of forest land and grassland have also changed to some extent, with forest land and grassland being encroached upon by building land in some areas. Correspondingly, in the distribution map of NDVI spatial patterns, from 2000 to 2010, although the overall NDVI values in some areas have increased, which may be attributed to early ecological protection measures and urban greening construction, the NDVI values in some urban expansion areas have begun to show signs of decline. By 2020, in the region where building land is significantly expanding, the NDVI value decreases significantly, indicating that urbanization construction has negatively affected the vegetation growth condition. Especially in the eastern and southern regions where building land grows rapidly, the decreasing trend of the NDVI value is more obvious. This is closely related to the change in land use type and the land use type shift caused by human activities, such as the conversion of agricultural land and vegetation-covered areas to building land, which directly destroys the vegetation ecology and leads to a decrease in the vegetation index.
Through statistics, the average NDVI values of each land use type in Tianjin in different periods were obtained, as shown in Table 3. It can be seen that the NDVI of agricultural land, forest land, and grassland in the study area showed fluctuating trends during the study period. Among them, during the period of 2000-2010, the NDVI values of agricultural land, forest land, and grassland showed an overall upward trend, fluctuating within the ranges of 0.7251-0.7655, 0.7852-0.8099, and 0.6447-0.7521, respectively. Especially during the period of 2005-2010, the vegetation growth in the study area reached the best condition, and the NDVI values of agricultural land and forest land in some areas even exceeded 0.8. However, after 2010, the NDVI values of all land use types exhibited a significant downward trend, and the NDVI value of unused land reached its lowest point (0.0103) in 2015, then recovered slightly but remained significantly lower than the level in 2000 (0.4900). This trend of change may be closely related to the accelerated urbanization and rapid development of industrialization and construction in the study area after 2010. As the proportion of impervious area increased, vegetation cover was significantly affected, leading to an overall decrease in mean NDVI values. In addition, the combined effects of climate change and anthropogenic activities may have exacerbated this trend.
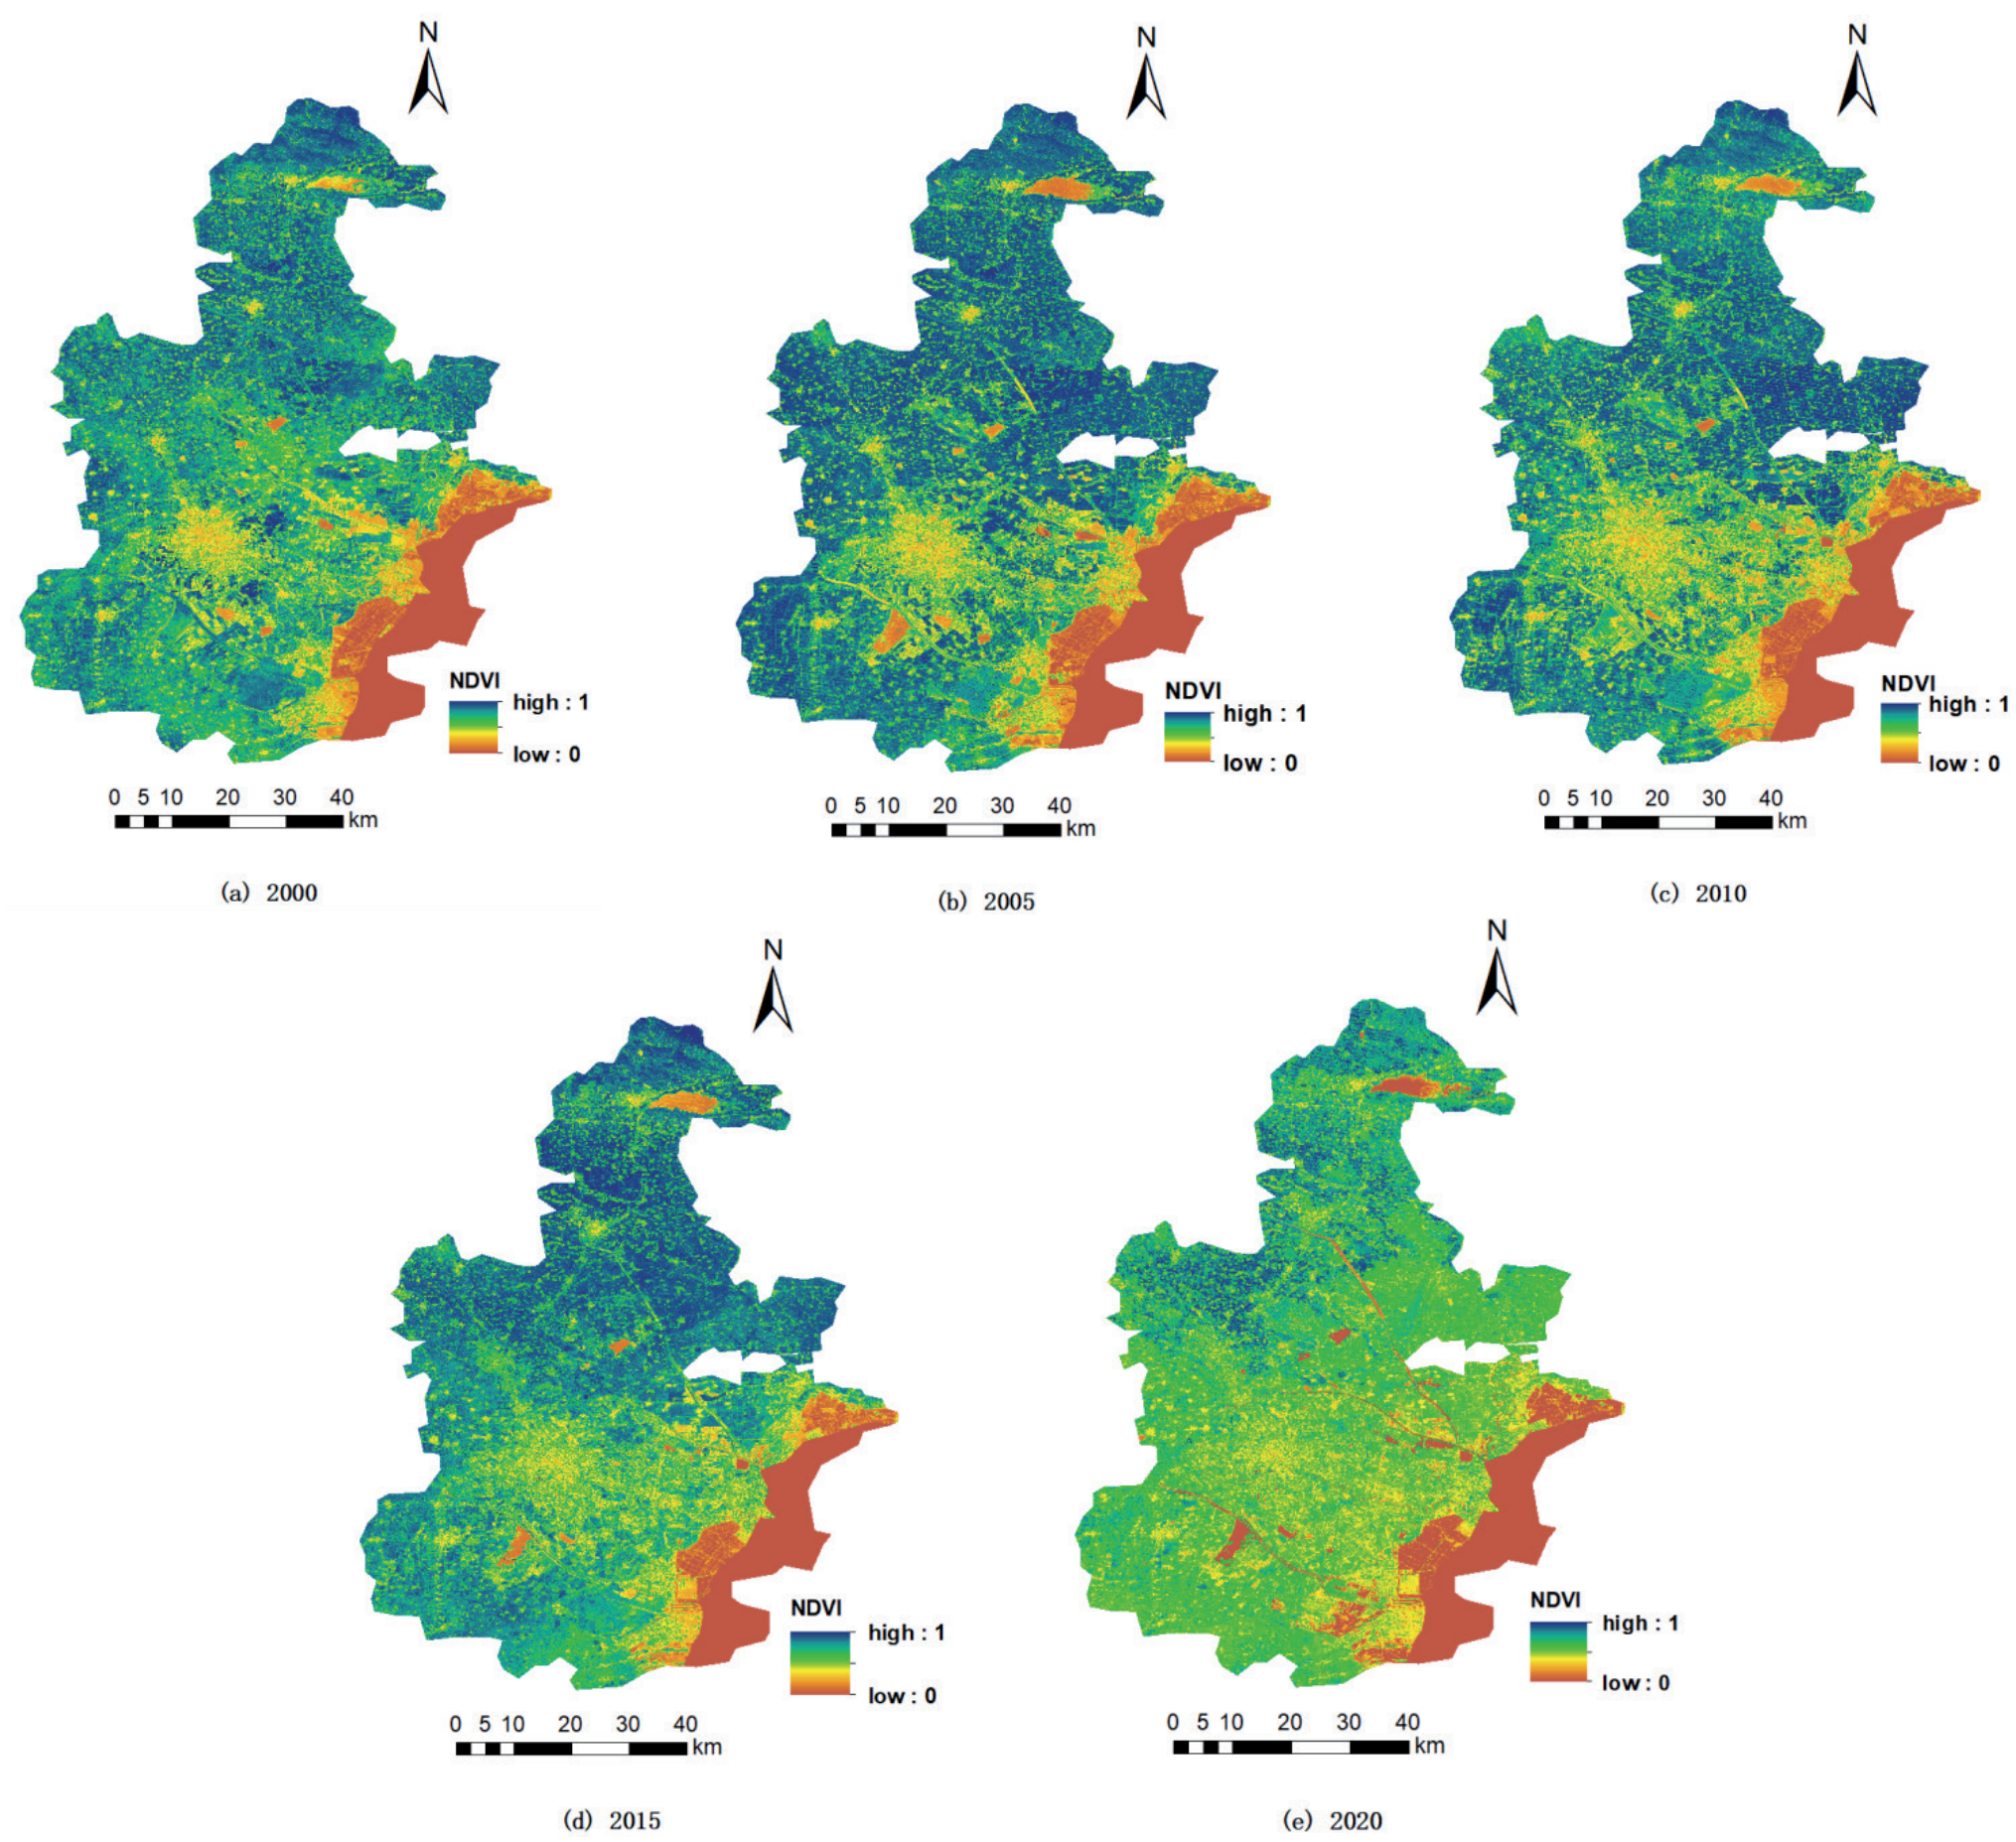
Table 3.
NDVI values for different land use types.
Seasonal Variations in NDVI and Influencing Factors
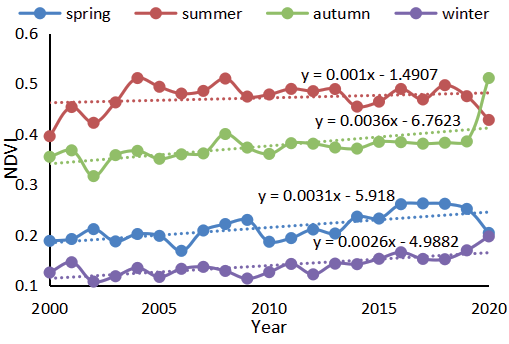
In order to explore the spatial and temporal characteristics of the vegetation index in Tianjin in different seasons, the average NDVI of the four seasons of spring, summer, autumn, and winter from 2000 to 2020 was selected for analysis, and the results are shown in Fig. 7. The NDVI showed different degrees of fluctuation across the four seasons of the year, with the average value being highest in summer at 0.47, indicating that the vegetation status was optimal in summer, followed by autumn and spring, which had values of 0.38 and 0.21, respectively. The overall NDVI was lower in winter at 0.14, indicating that the overall vegetation status was poor in winter. This is related to the meteorological conditions of the region in which Tianjin is located, where abundant solar radiation in summer provides a rich source of energy for the photosynthesis of vegetation. At the same time, abundant precipitation provides the necessary moisture conditions for vegetation growth. Under the synergistic effect of these favorable meteorological factors, vegetation growth was extremely vigorous, and the vegetation cover and biomass increased significantly, resulting in high NDVI values. At the beginning of autumn, some of the vegetation remained in a relatively good state of growth, allowing NDVI values to be maintained at a certain level. However, as the season progresses, the temperature remains low, sunshine time is gradually shortened, and the heat and light conditions required for vegetation growth deteriorate, resulting in a downward trend in NDVI values. In spring, the weather system is more active, the cold air activity is still more frequent, and the spatial and temporal distribution of precipitation is often not uniform, these factors make the vegetation growth rate and the degree of development in different years there are some differences, which leads to the NDVI value shows a relatively stable and slightly fluctuating characteristics of the change. In winter, the climate in Tianjin is cold, the average temperature is significantly lower than in other seasons, and the precipitation is mostly in the form of snow, the soil freezes, and most of the surface vegetation enters a dormant period, and even some herbaceous plants wither and die, so that the vegetation cover and biomass drop to the lowest level of the year, and thus the NDVI value is obviously low.
Further analysis of the linear fitting equations reveals that there are significant differences in the trends of NDVI values with years in different seasons. Among them, the slope of the fitted equation is relatively large in autumn, which means that the NDVI values in autumn show a relatively more obvious trend with the increase of the year in this 20-year period. In contrast, the slopes of the fitted equations for spring, summer, and winter were relatively small, indicating that the trends of NDVI values with years in these seasons were relatively more moderate. The differences and variations in NDVI between these seasons are closely related not only to the unique meteorological conditions in Tianjin during different seasons, but also to the growth cycle and ecological adaptations of the vegetation itself.
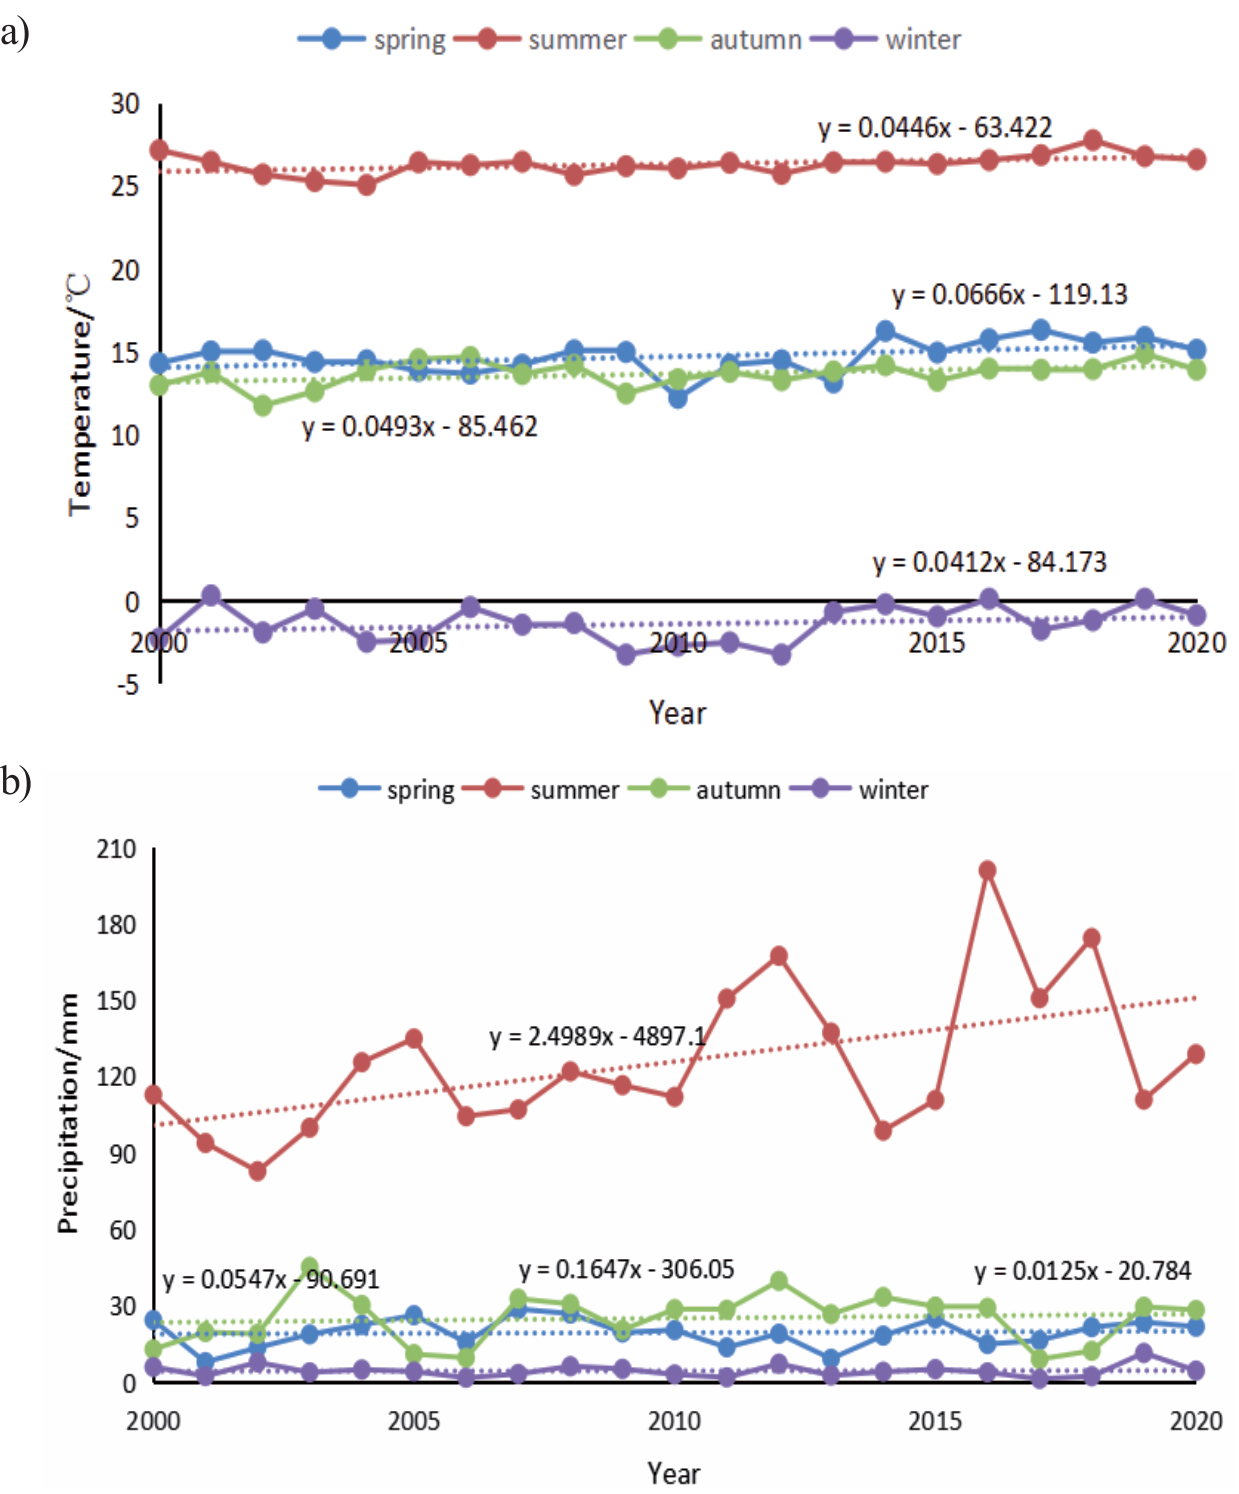
Under the background of global warming, the average temperature of each season in Tianjin from 2000 to 2020 showed a slow increasing trend, as shown in Fig. 8, which was positively correlated with the NDVI of each season. Combined with the fitted NDVI linear regression equations for each season in Fig. 7, it can be seen that the NDVI increased most significantly in autumn, at a rate of approximately 0.36%/a. The temperature increased at a rate of 4.93%/a, and the precipitation increased at a rate of 5.47%/a. In the summer and spring, the NDVI increased at rates of 0.1%/a and 0.31%/a, respectively, while precipitation increased at rates of 2.50%/a and 5.47%/a. The temperature increased at rates of 4.46%/a and 6.66%/a. The correlation between temperature, precipitation, and NDVI was positive in summer and spring. In winter, NDVI increased at a rate of 0.26% per annum, while air temperature and precipitation increased at rates of 4.12% per annum and 1.25% per annum, respectively. Meanwhile, combining with Table 4, a high correlation (R² = 0.7726) was presented between NDVI and air temperature in spring, indicating that in spring, air temperature is the key factor influencing the change of NDVI, and suitable temperature conditions can promote the rapid growth of vegetation. In summer and autumn, the correlation between NDVI and air temperature and precipitation was at an intermediate level, indicating that in these two seasons, vegetation growth was regulated by air temperature and precipitation, and the synergistic effect of the two had a combined effect on vegetation cover and vigor. It is noteworthy that NDVI showed a negative correlation with precipitation in winter (R² = -0.0473). This may be due to a non-simple linear relationship between winter precipitation forms, such as snowfall, and their effects on soil moisture, water availability, and vegetation growth, or interference by other environmental factors such as winter winds, length of snow cover, etc.
Impact of Land Use and Climate Change on NDVI
Calculations based on Equation (4) show that the contribution of land-use change to total vegetation cover change is 61.2%, and the contribution of climate change is 38.8% for 2000-2020. Between 2005 and 2020, the contribution of land use change increased to 70.3%, while the contribution of climate change decreased to 29.7%. During the period 2010-2020, the contribution of land use change was 63.8%, and that of climate change was 36.2%. These data indicate that the contribution of land-use change to changes in vegetation cover is consistently higher than that of climate change, and the impact of land-use change has tended to increase over time.
Fig. 9.
Correlation of NDVI with Temperature and Precipitation in Tianjin, 2000-2020. a) NDVI-Temperature, b) NDVI-Precipitation.
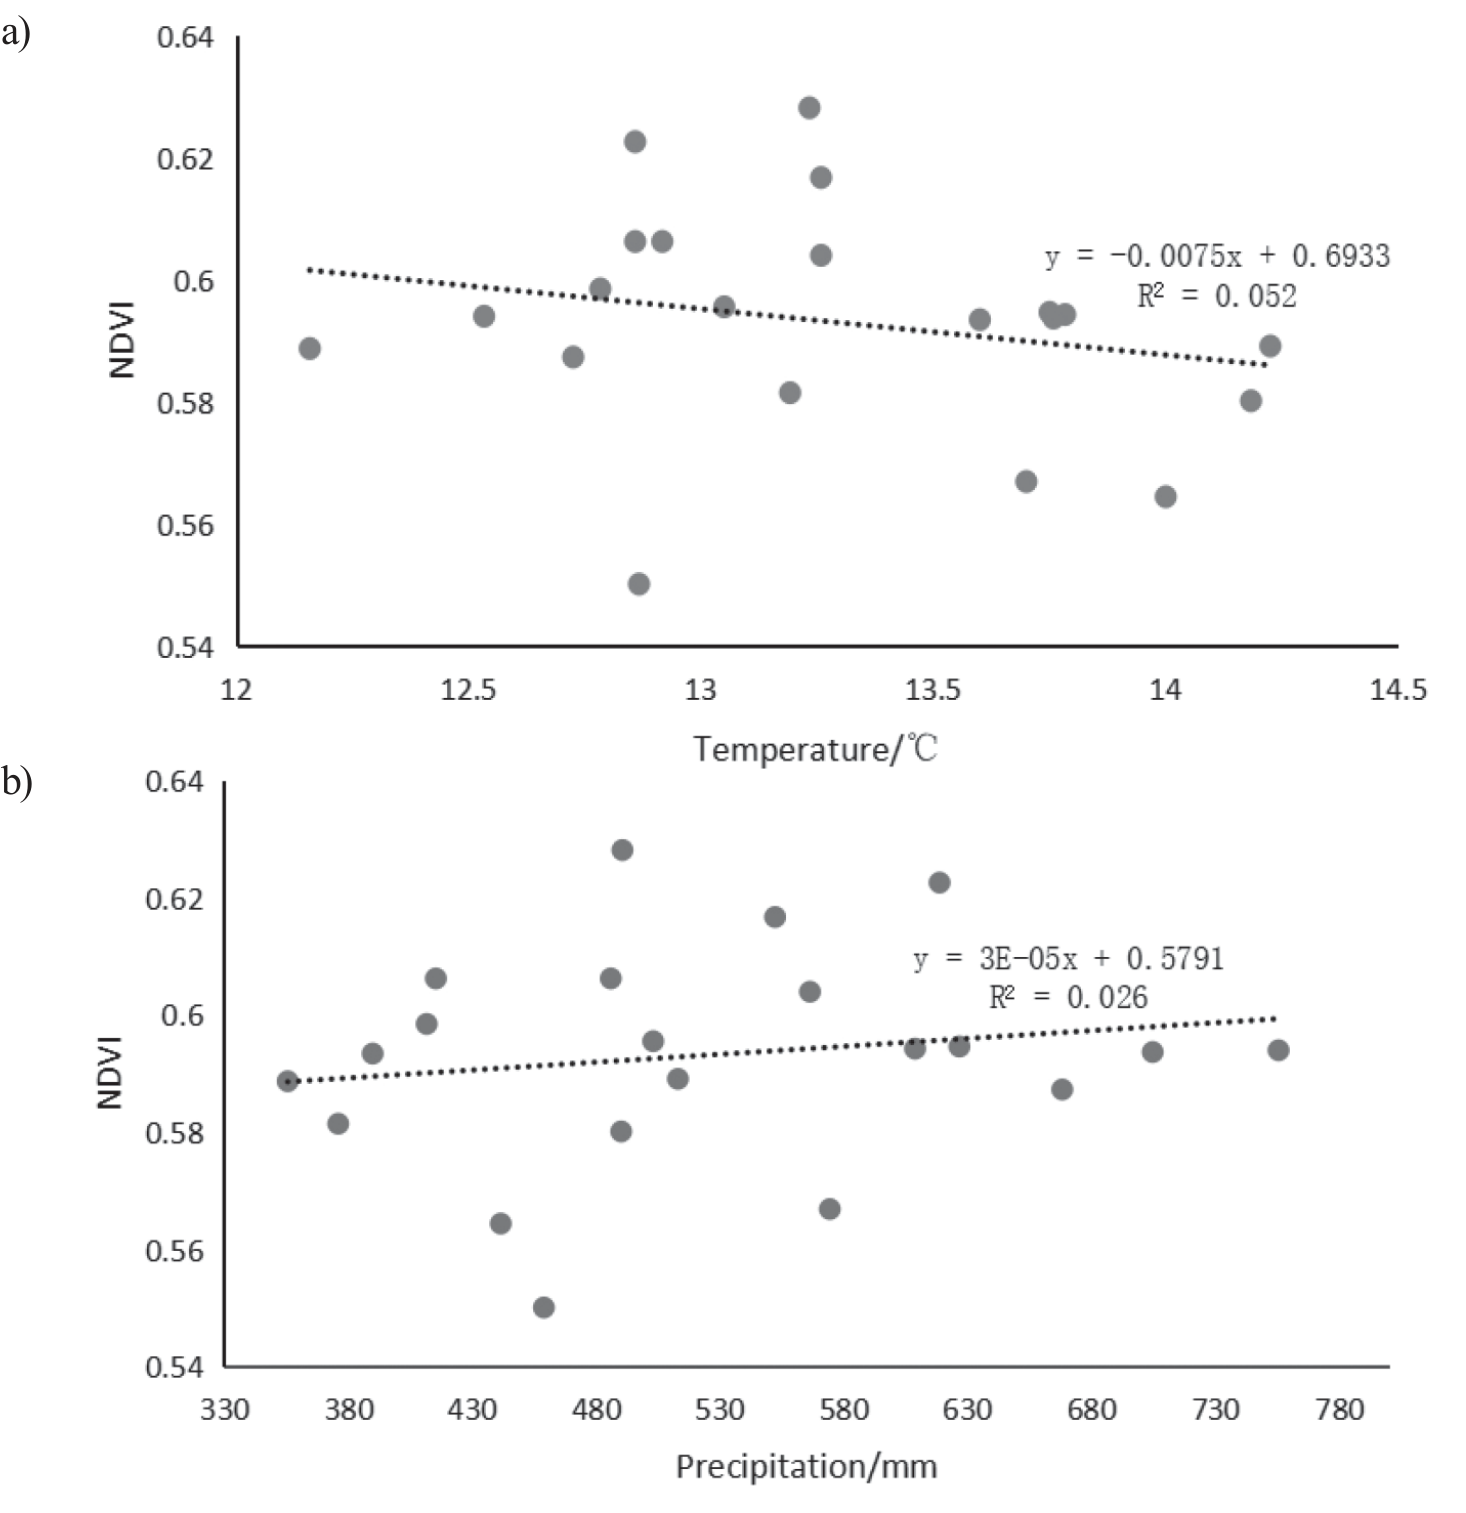
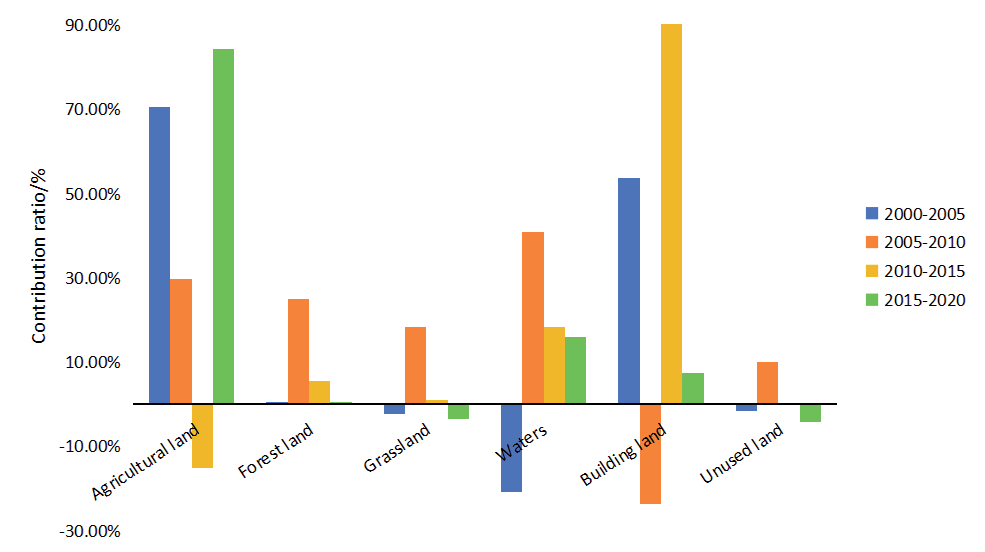
The climate change factors in this paper are primarily expressed in terms of temperature and precipitation [68]. The mean annual air temperature, mean annual precipitation, and mean annual NDVI in the study area from 2000 to 2020 were correlated and analysed, and Fig. 9 was obtained. As shown in Fig. 9, the correlation between changes in NDVI and climate change factors was low, with correlation coefficients of 0.0075 and 0.00003 for air temperature and precipitation, respectively. The effect of air temperature on NDVI was larger than that of air temperature. With increasing air temperature, the vegetation NDVI exhibited a decreasing trend, while with increasing precipitation, the vegetation NDVI showed a slow increase, indicating that air temperature is the primary factor affecting the vegetation NDVI among the climate factors. Similar to the phasing of the land use transfer matrix, the contribution of a single land use type to the total change in vegetation index due to land use change was also divided into four phases in this study, 2000-2005, 2005-2010, 2010-2015, and 2015-2020, in order to analyze the impact of the change of a single land use type on the NDVI in each phase. Fig. 10 was obtained by calculating through Equation (6). As shown in Fig. 10, the most significant increase in NDVI was attributed to changes in agricultural land, which accounted for 70.62% of the total change in vegetation cover resulting from land use changes from 2000 to 2005. Next, building land with a contribution of 53.79%, changes in waters, grassland, and unused land led to a decrease in vegetation cover with contributions of -20.83%, -2.28%, and -1.70%, respectively, and forest land had the lowest contribution to the change in vegetation cover at 0.41%. Waters change had the highest contribution to the total vegetation cover change from 2005 to 2010, with 40.76%. Building land change had a significant increase in the contribution to the total vegetation cover change from 2010 to 2015, with 90.16%, which was much higher than that of other land use types. From 2015 to 2020, the agricultural land change was again the main contributor to total vegetation cover change, with a contribution rate of 84.41%. From the analyses of the four stages, changes in agricultural land and building land have the most significant influence on vegetation cover, especially in the periods of 2000-2005 and 2015- 2020; the contribution of agricultural land is always in the first place. With the acceleration of urbanization, the influence of building land changes on vegetation cover has gradually increased. This trend reflects the profound influence of human activities on vegetation cover in the study area, and also provides an important reference for future land use planning and ecological protection.
Discussion
This study analyzed the spatial and temporal evolution patterns of land use and climate change on NDVI in Tianjin from 2000 to 2020, and found that land use changes have a significant impact on NDVI, and that the expansion of construction land is the main driver, which is consistent with the results of domestic and international urbanization studies. For example, studies in eastern China have shown that the conversion of agricultural land and natural vegetation to building land due to rapid urbanization is the main cause of NDVI decline [69]. Similarly, international cases such as the Lower San River Basin in India, where urban expansion and agricultural activities led to a significant decrease in NDVI [70], confirm the direct impact of land use change on vegetation cover. It is worth noting that Tianjin’s ecological protection policies (e.g., forest land restoration) mitigated the declining trend of NDVI [71], but the policy effects were spatially heterogeneous, with NDVI continuing to decline in the urban core area and improving in the ecological reserve, consistent with the goals of the Beijing-Tianjin-Hebei Ecological Functional Zoning [15].
In Tianjin, the contribution of climate change to NDVI was lower than that of land use change, but temperature and precipitation still exhibited significant seasonal effects. It was found that the highest correlation between NDVI and air temperature occurred in autumn, while precipitation was negatively correlated with NDVI in winter, a finding consistent with studies in the mid-latitudes of the Northern Hemisphere [72]. For example, studies in northern China have shown that warmer temperatures promote vegetation growth by lengthening the growing season, but extremely high temperatures may lead to water stress [54]. Unlike high-altitude regions like the Tibetan Plateau, Tianjin’s vegetation response to precipitation is more complex. Increased summer precipitation can boost vegetation growth but also cause flooding, with uncertain impacts on vegetation cover [73]. This regional difference highlights the need to consider local climate characteristics in ecological conservation strategies.
In addition, this study further reveals the interactive effects of land use and climate change. For example, the heat island effect from urban expansion raises city temperatures, creating a cycle of ‘urbanization-heat island-vegetation degradation’ [74]. Similar findings were seen in Phoenix, USA, where urban sprawl increased surface temperatures by 2-4ºC, hindering vegetation growth [75]. Meanwhile, the fluctuation of the water areas in Tianjin (first decrease and then increase) reflects the dynamic balance between urban development and ecological protection. The recovery of the watershed area since 2015 is due to the sponge city policy, which enhances the local climate and supports vegetation cover by regulating surface temperature [61]. This supports the ecological compensation mechanism in urbanization.
This study offers valuable insights into the effects of land use and climate change on NDVI, but it has some limitations. First, it primarily focuses on land use types, such as building, agricultural, and forest land, without considering CO₂ concentration or extreme weather events. Second, although the 20-year study period is substantial, it may not fully capture long-term trends or cyclical changes, and socio-economic factors need deeper qualitative analysis. Future studies could investigate the long-term effects of various land use types on NDVI and climate change adaptation strategies. Combining ecological service assessment models can quantify the integrated impacts of land-use change on carbon sinks and biodiversity. Additionally, exploring more advanced remote sensing techniques could improve NDVI estimation accuracy and account for other environmental factors that affect vegetation cover.
Conclusions
This study analyzed the impacts of land use and climate change on NDVI in Tianjin from 2000 to 2020, revealing the mechanisms of human activities and natural factors. The study reveals that land use change in Tianjin is significant, with the expansion of construction land as the primary driving force. The area of forest land and grassland has decreased and then increased, and the change in unutilized land has occurred in a phased manner. The contribution of land use change to vegetation cover is greater than that of climate change, and its effect increases over time. the overall NDVI increases and then decreases, which is related to land use change and ecological protection policies. In the future, it is necessary to strengthen the scientific planning and management of land, optimize the utilization structure, balance urbanization and ecological protection, and enhance the monitoring and evaluation of land use, so as to adjust policies in a timely manner to address urban development and ecological challenges.

