

Introduction
Water resources are fundamental natural assets essential for human survival and development. Clean and abundant water is not only crucial for drinking, sanitation, and agriculture but also plays a vital role in industrial processes, energy production, and ecosystem health. Water quality, as a critical determinant of environmental quality, represents a significant challenge to human progress and the construction of ecological civilization. This issue has garnered considerable attention from scholars and policymakers alike [1-5]. The degradation of water quality can lead to severe public health problems, loss of biodiversity, and economic setbacks, making it an urgent priority for sustainable development.
Numerous factors influence water quality in natural streams, with changes in land use within watersheds being a direct cause of alterations in hydrological processes and nutrient transport. Land use changes, such as deforestation, urbanization, and agricultural expansion, can significantly alter the natural flow of water and the movement of nutrients through ecosystems. For instance, deforestation can increase surface runoff, leading to higher sediment loads in rivers, while agricultural activities can introduce excess nutrients like nitrogen and phosphorus, promoting harmful algal blooms. These changes are key drivers of variations in stream water quality [6-8].
Land serves as the primary medium for human activities and natural elements; thus, changes in watershed land use, driven by imbalances in “source” and “sink” land use types, significantly impact river water quality through complex hydrological processes [9, 10]. Source land uses, such as agricultural fields and urban areas, generate pollutants that can enter water bodies through runoff or groundwater flow. Sink land uses, like forests and wetlands, act as natural filters, helping to remove pollutants before they reach rivers. When these land use types become imbalanced, such as when forests are cleared for agriculture, the ability of the watershed to maintain water quality diminishes. Consequently, studying the response relationship between river water quality and watershed land use holds substantial practical value for protecting water resources and restoring riverine environments. Understanding this relationship can inform better land management practices, policy-making, and conservation efforts.
To date, research on river water quality and watershed land use has focused on three spatial scales: stream segment buffers [11, 12], riparian zone buffers [13-15], and sub-watersheds [16-18]. Each scale offers unique insights into the dynamics of water quality and land use interactions. Stream segment buffers refer to the area immediately surrounding a river or stream, typically extending a few hundred meters from the water’s edge. These buffers play a crucial role in filtering pollutants and stabilizing stream banks. Riparian zone buffers, which encompass the transitional area between aquatic and terrestrial ecosystems, are particularly important for maintaining water quality. They can reduce erosion, filter sediments, and absorb excess nutrients. Sub-watersheds, on the other hand, represent larger areas that drain into a common point, providing a broader context for understanding how land use patterns affect water quality over larger regions. However, results vary across studies, with some indicating that watershed-scale land use has a greater impact on river water quality, while others suggest that land use at the stream segment or riparian zone scale better explains water quality changes. For example, a study conducted in the Mississippi River Basin found that large-scale agricultural practices had a more significant effect on water quality than localized riparian management [19]. Conversely, research in smaller, more isolated watersheds often highlights the importance of riparian zones in mitigating pollution [20]. Additionally, there are differences in the effects of various riparian zone scales on river water quality, underscoring the need for tailored approaches based on local conditions. In summary, there is a significant response relationship between river water quality and watershed land use, but consensus on this relationship across spatial scales remains elusive.
While the impact of land use on water quality is well-established, recent environmental research has broadened its scope, investigating a wider array of influencing factors and employing sophisticated methodologies. For instance, studies have explored the complex interplay between socio-economic factors like income inequality and the role of technological innovation in shaping environmental outcomes. Others have examined how large-scale economic activities, such as the adoption of green production processes and the effects of trade globalization, transform environmental quality, utilizing advanced techniques like Kernel Regularized Quantile Regression to capture nuanced relationships [21]. Furthermore, significant attention has been directed towards energy transitions and sustainability goals. Research has investigated the impact of renewable energy consumption, globalization, and technological innovation on environmental degradation in specific national contexts like Japan, applying wavelet tools for detailed analysis [22], and explored the global links between renewable energy consumption, financial development, and environmental sustainability [23]. Specific challenges, such as achieving access to clean fuels and technologies for cooking, crucial for SDG 7, have been analyzed in countries like India and Nigeria, considering barriers like political risk and the role of financial development, often using quantile-based wavelet approaches [24, 25].
These recent studies highlight the importance of considering broader economic, social, technological, and financial factors, often at national or global scales, and utilize advanced econometric and time-series methods. However, a gap persists in translating these broader findings to the specific context of watershed-level river water quality management, particularly concerning the direct, spatially-explicit impact of land use changes. While factors like technological innovation and financial development might indirectly influence land use decisions, the immediate relationship between land use patterns (source vs. sink) at different spatial scales (stream buffer, riparian zone, sub-watershed) and the resultant water quality within a specific river basin requires focused investigation [22-26]. Much of the recent advanced methodological work has been applied to broader environmental degradation indicators or specific issues like energy access, rather than the nuanced, scale-dependent hydrological and nutrient transport processes linking land use to in-stream water quality. Therefore, despite progress in understanding macro-level drivers, there remains a critical need to quantitatively explore the relationship between land use configuration and river water quality across multiple relevant spatial scales within the same watershed, especially in ecologically sensitive and rapidly changing regions. This multi-scale spatial analysis is crucial for providing actionable insights for local water resource protection and management.
Therefore, it is necessary to explore the relationship between land use and river water quality at different scales within the same watershed to provide valuable reference information for water environmental protection. Such research can help identify the most effective strategies for improving water quality and managing land use sustainably. The Niyang River is one of the five major tributaries within the Yarlung Zangbo River Basin, covering an area of approximately 17,500 km². It flows from northwest to southeast across Gongbujianda County and Linzhi City, traversing diverse landscapes ranging from high-altitude plateaus to fertile valleys. The river’s water primarily originates from alpine ice, snowmelt, and rainfall, making it a vital water source for Linzhi City and surrounding communities. In recent years, socio-economic development and population influx have led to severe disturbances in land use within the valley areas of the Niyang River mainstream, impacting water quality due to the basin’s natural topography. For instance, rapid urbanization has increased impervious surfaces, leading to higher runoff and pollutant loads entering the river. Agricultural intensification has also contributed to nutrient enrichment, posing risks to aquatic ecosystems. Current research on Niyang River water quality focuses on evaluating river water quality and analyzing the spatiotemporal characteristics of water quality indicators, with limited quantitative analyses exploring the causes of water quality changes. The author examined the relationship between water quality and land use at the sub-watershed scale but did not expand their analysis to encompass multiple spatial scales, thereby limiting the scope of their findings. Therefore, this study selected the Niyang River Basin as the study area, utilizing GIS technology to quantitatively explore the flood season’s impact on different water quality indicators and the response relationship between land use at various spatial scales, addressing the identified gap regarding scale-dependent land use impacts on river water quality in a specific basin context. By integrating data from multiple sources, including remote sensing, field sampling, and historical records, this research aims to provide a comprehensive reference for water environmental protection and management in the Niyang River Basin. The findings will offer valuable insights into how land use changes affect water quality and help guide future conservation efforts in this ecologically and economically important region.
Materials and Methods
Data Source and Data Type
Based on hydrological principles and catchment characteristics, the monitoring sections in this study were established according to the sub-basin divisions of the Niyang River [18]. Specifically, seven monitoring sections were strategically set up at the outlets of seven sub-basins along the mainstream. This design ensures that the data collected are representative of the entire river system. Water samples were collected in July 2022 during the high-water season, a period when water levels and flow rates are typically at their peak due to seasonal rainfall and snowmelt. The selected water quality indicators for analysis included chemical oxygen demand (COD), total phosphorus (TP), ammonia nitrogen (NH3-N), and total nitrogen (TN). These parameters were chosen because they are critical indicators of water pollution and can provide valuable insights into the health of aquatic ecosystems. By focusing on these specific indicators, the study aims to facilitate more accurate comparisons with existing research findings.
To more scientifically investigate the response relationship between flood season water quality and land use in the Niyang River Basin, remote sensing data from the relevant period were utilized for land cover classification. Remote sensing technology allows for comprehensive and detailed mapping of land use patterns over large areas, providing a robust foundation for subsequent analysis. Drawing on both domestic and international research experience as well as the specific conditions of the Niyang River Basin, the study classified land use into six categories using a decision tree approach: arable land, forest land, grassland, water bodies, residential areas, and unutilized land. Each category reflects distinct land use practices and environmental impacts:
Arable Land: Areas used for crop cultivation, which can introduce agricultural runoff containing fertilizers and pesticides.
Forest Land: Forested areas that act as natural filters, helping to reduce erosion and filter pollutants before they reach water bodies.
Grassland: Grazing areas or natural meadows that can contribute to sedimentation if not properly managed.
Water Bodies: Lakes, ponds, and wetlands within the basin, which play crucial roles in maintaining water quality and supporting biodiversity.
Residential Areas: Urban and suburban regions where impervious surfaces increase runoff and pollutant loads.
Unutilized Land: Areas not currently developed or cultivated, often serving as natural buffers.
The classifications were further validated and corrected using Chinese satellite imagery and field survey results. Satellite imagery provides high-resolution visual data that can be cross-referenced with ground truth data collected through field surveys. This dual approach ensures the accuracy and reliability of the land use classifications. Field surveys involved collecting soil samples, conducting interviews with local residents, and performing direct observations to verify the remote sensing data. By integrating these multiple sources of information, the study aims to produce a comprehensive and accurate representation of land use patterns in the Niyang River Basin.
This integrated methodology not only enhances the scientific rigor of the study but also provides valuable insights into how different land use practices influence water quality during the flood season. The findings will serve as a critical reference for policymakers, environmental managers, and researchers working to protect and manage water resources in the region.
Spatial Zoning
Water environment quality is significantly influenced by land use patterns and the presence of hydrological buffer zones [19, 20]. Our study prioritizes identifying the spatial-scale relationship between land use and surface water quality in the Niyang River, with a focus on optimizing buffer zones for practical management. While subsurface processes like groundwater dynamics and riparian filtration are acknowledged as influential factors, our analysis centered on quantifying land use impacts at varying buffer scales. To address potential subsurface variability, water sampling was conducted during the flood season to stabilize seasonal influences, and nested buffer zones were analyzed to capture indirect hydrological connectivity and non-point source dispersion patterns. Land use types with higher pollution potential were weighted in statistical models to approximate cumulative anthropogenic effects. The results highlight a specific buffer scale that integrates surface-subsurface interactions most effectively, providing a pragmatic basis for land use planning. Therefore, this study comprehensively considers the natural characteristics of the riverbed and valley in the Niyang River Basin, as well as the extent of human activities impacting the watershed. The Niyang River Basin, located in a region with diverse topography and varying degrees of anthropogenic influence, presents unique challenges for water resource management. To address these challenges effectively, this research adopts an innovative multi-scale approach that improves upon previous methods, which typically divided watersheds and riparian zones at a single scale.
1) Natural characteristics and human activities
The study area encompasses a variety of natural features, including steep mountainous regions, gentle valleys, and extensive floodplains. These geographical elements play a crucial role in determining the flow and quality of water within the basin. Additionally, human activities such as agriculture, urbanization, and industrial development have significantly altered the landscape, leading to changes in land cover and increased pollutant loads. By integrating both natural and anthropogenic factors, the study aims to provide a more holistic understanding of the water environment.
2) Multi-scale approach
To enhance the accuracy and applicability of the analysis, the research employs a multi-scale approach. Sub-watersheds are delineated based on monitoring points located at their outlets. This method ensures that each sub-watershed is evaluated independently, capturing localized variations in water quality and land use. Hydrological buffer zones are established in the direction opposite to the catchment area, creating a protective barrier that mitigates the impact of upstream activities on downstream water quality.
3) Spatial Scales of Hydrological Buffer Zones
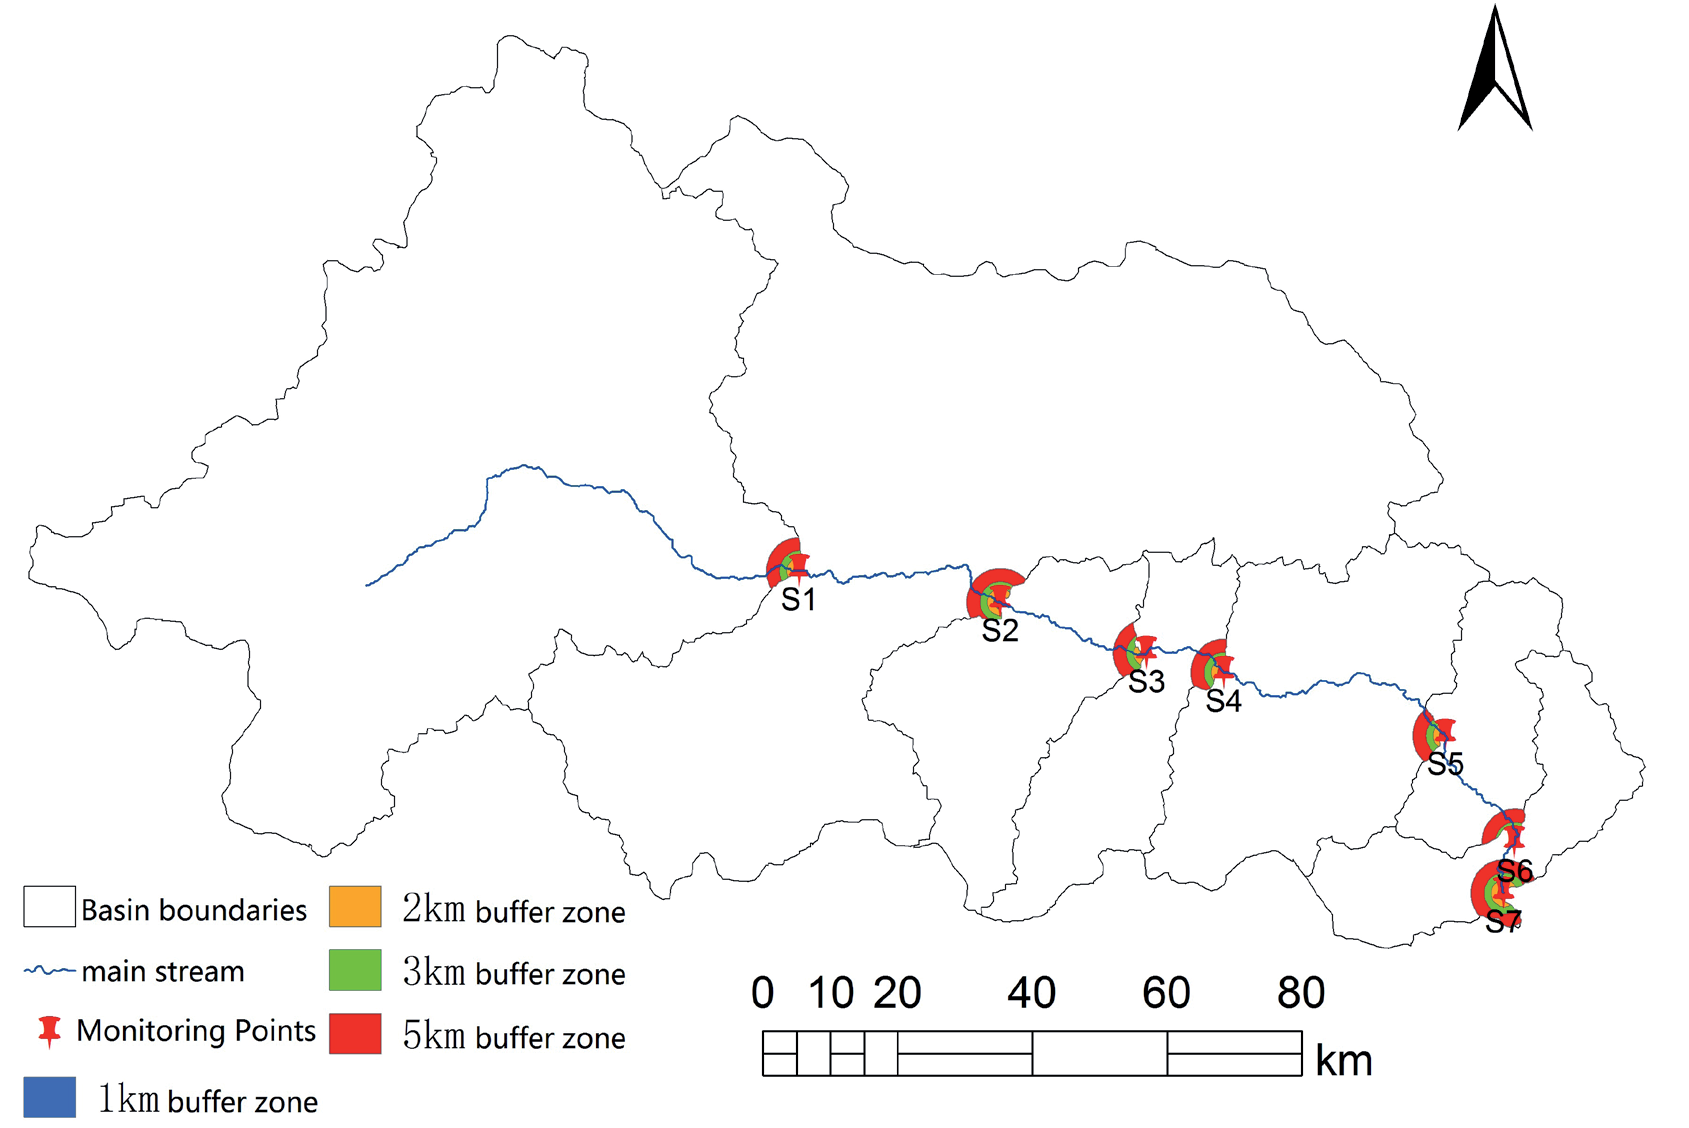
Four distinct spatial scales of hydrological buffer zones are constructed using seven water quality monitoring transects along the Niyang River. These scales include radii of 1 km, 2 km, 3 km, and 5 km ( Fig. 1). Each scale provides a different perspective on how land use practices affect water quality:
1 km radius: This scale focuses on immediate riparian areas, where direct interactions between land and water are most pronounced. It captures the effects of adjacent agricultural practices, such as fertilizer runoff and soil erosion.
2 km radius: At this scale, the buffer zone extends beyond the immediate riparian zone, incorporating nearby residential and commercial areas. This scale helps assess the cumulative impacts of urban runoff and wastewater discharge.
3 km radius: This intermediate scale includes larger agricultural fields and forested areas. It allows for a more comprehensive evaluation of how broader land use patterns influence water quality.
5 km radius: The largest scale encompasses a wider range of land uses, including remote rural areas and protected natural reserves. This scale provides insights into long-range transport of pollutants and the overall health of the watershed.
By employing this multi-scale approach, the study not only enhances the scientific rigor of the analysis but also provides valuable insights into the complex relationships between land use and water quality. The findings will serve as a critical reference for policymakers, environmental managers, and researchers working to protect and manage water resources in the Niyang River Basin. Specifically, the detailed spatial scaling of hydrological buffer zones can inform targeted conservation efforts, land use planning, and pollution control strategies, ultimately contributing to sustainable water resource management in the region.
Research Methods
Using the spatial analysis module of ArcGIS 10.0, this study quantified the land use within buffer zones at various scales corresponding to different monitoring points along the Niyang River. The buffer zones were established at multiple radii, including 1 km, 2 km, 3 km, and 5 km, to capture the diverse influences of land use on water quality at different spatial extents. By employing these varying buffer sizes, the research aimed to provide a comprehensive understanding of how land use patterns affect water quality in both localized and broader contexts.
Fig. 1.
Division of sampling sites and buffer zones in the Niyang River Basin. The figure presents a multi-scale spatial zoning framework for hydrological buffer zones along the Niyang River. It delineates nested buffer zones that extend from immediate riparian areas to broader catchment boundaries, each capturing unique land-water interaction dynamics. These buffer zones synthesize topographic gradients, heterogeneous land use patterns, and hydrological connectivity, visually distinguishing zones of direct pollutant transfer from those mitigating cumulative impacts. The spatial stratification corresponds with natural geomorphological features and gradients of anthropogenic activities, highlighting how proximity to the river channel influences pollution pathways. The visualization elucidates the interconnection between localized land management practices and basin-scale ecological processes, thereby underpinning adaptive water resource management strategies.
1) Quantification of Land Use
The spatial analysis module of ArcGIS 10.0 was utilized to quantify land use types within each buffer zone. This involved classifying land cover into categories such as agricultural land, forested areas, urbanized regions, grasslands, water bodies, and unutilized land. High-resolution satellite imagery and field survey data were integrated to ensure accurate classification. For instance, agricultural lands were identified based on crop types and farming practices, while urbanized regions were delineated using building density and road networks.
2) Correlation Studies
To analyze the relationship between different land use types and water quality, correlation studies were conducted. These studies examined key water quality parameters such as nutrient levels (nitrogen and phosphorus), sediment concentrations, and pollutant loads. For example, agricultural lands often contribute higher levels of nitrogen and phosphorus due to fertilizer runoff, while urbanized regions may introduce pollutants like heavy metals and organic compounds through stormwater runoff. By correlating these parameters with land use types, the study identified significant associations that highlight the impact of specific land uses on water quality.
3) Multiple Stepwise Regression Analyses
Following the correlation studies, multiple stepwise regression analyses were performed to further investigate the impact of land use on water quality across different spatial scales. This statistical approach allowed for the identification of the most influential land use factors affecting water quality. For instance, the regression models revealed that agricultural activities within a 1 km buffer zone had a more pronounced effect on nutrient levels compared to activities in larger buffer zones. Similarly, urbanization within a 2 km buffer zone significantly increased pollutant loads in the river.
4) Significance and Applications
By integrating these methodologies, the study provides valuable insights into the complex interactions between land use and water quality in the Niyang River Basin. The findings underscore the importance of considering multiple spatial scales when assessing the impact of land use changes on water resources. For example, targeted conservation efforts can be implemented in critical buffer zones to mitigate pollution from high-impact land uses. Additionally, the results can inform land use planning policies, helping to balance development needs with environmental protection. Ultimately, this research contributes to sustainable water resource management by highlighting the need for integrated approaches that consider both natural and anthropogenic factors.
Results
Water Quality Characterization
Detailed Analysis of Water Quality Parameters in the Niyang River Mainstream
The water quality parameters of the Niyang River mainstream were comprehensively analyzed, revealing significant spatial variations across different monitoring points (Table 1). These variations provide valuable insights into the impact of land use and human activities on water quality within the basin.
1) COD
The COD concentration in the Niyang River ranged from 7.48 to 25.64 mg L-1, with an average concentration of 15.31 mg L-1. This average value is better than the Class III water quality limit, indicating generally good water quality. However, the compliance rate for Class III water quality standards was only 57%, highlighting areas where improvements are needed. The highest COD concentration (25.64 mg L-1) was observed at the S2 monitoring point near Jiangda County, a region characterized by frequent human activities such as agriculture, urbanization, and industrial development. In contrast, the lowest concentration (7.48 mg L-1) was recorded at the river basin outlet, specifically at the entrance to the Yajiang River (S7 monitoring point), suggesting that downstream areas benefit from natural purification processes or less anthropogenic influence.
2) TN
For TN concentrations, values ranged from 0.113 to 0.303 mg L-1, with an average of 0.199 mg L-1, falling within Class I water quality standards. The compliance rate for Class III water quality standards was 100%, indicating excellent water quality in terms of nitrogen levels. The highest TN concentration was also observed at the S2 monitoring point, likely due to agricultural runoff and wastewater discharge from nearby settlements. Conversely, the lowest TN concentration was recorded at the S7 monitoring point, reinforcing the notion that downstream areas experience better water quality. High TN levels can lead to eutrophication, which can have detrimental effects on aquatic ecosystems, making it crucial to monitor and manage these sources effectively.
3) TP
TP concentrations varied between 0.012 and 0.026 mg L-1, averaging 0.016 mg L-1, which corresponds to Class I water quality. The compliance rate for Class III water quality standards was 86%, indicating generally good but not perfect water quality. Similar to COD and TN, the highest TP concentration appeared at the S2 monitoring point, while the lowest was recorded at the S7 monitoring point. Elevated TP levels can also contribute to eutrophication, emphasizing the importance of controlling phosphorus inputs from agricultural and urban sources. Effective land use management practices, such as buffer zones and best management practices (BMPs), can help mitigate these impacts.
4) NH3-N
NH3-N concentrations ranged from 0.053 to 0.111 mg L-1, with an average of 0.068 mg L-1, meeting Class I water quality standards. The compliance rate for Class III water quality standards was 100%, indicating excellent water quality in terms of ammonia nitrogen. The highest NH3-N concentration was observed at the S2 monitoring point near Jiangda County, where human activities are more frequent, particularly those related to livestock farming and sewage discharge. The lowest value was recorded at the S3 monitoring point downstream of the Bahe River confluence with the Niyang River, suggesting that the confluence may dilute pollutant concentrations. High NH3-N levels can be toxic to aquatic life, underscoring the need for effective wastewater treatment and management practices.
Spatial Distribution Patterns
Overall, the spatial distribution of the four water quality indicators showed a consistent pattern: downstream water bodies exhibited significantly better water quality compared to upstream areas, with concentrations gradually improving along the river’s direction. This trend can be attributed to several factors: 1) Natural purification processes: As water flows downstream, it undergoes natural purification through sedimentation, microbial degradation, and dilution. 2) Reduced anthropogenic influence: Downstream areas tend to have fewer human activities, leading to lower pollutant loads. 3) Confluence effects: The joining of tributaries, such as the Bahe River, can dilute pollutant concentrations, improving overall water quality.
These findings highlight the importance of implementing targeted conservation efforts in critical upstream areas, such as buffer zones and riparian restoration projects, to protect and enhance water quality throughout the Niyang River Basin. Additionally, the results can inform land use planning policies, helping to balance development needs with environmental protection. Ultimately, this research contributes to sustainable water resource management by providing a comprehensive understanding of the spatial dynamics of water quality indicators.
Land Use Structure of Buffer Zones at Various Spatial Scales
Methodology and Spatial Delineation
Based on the watershed hydrological yield and sink mechanism, hydrological sink zones were extracted using monitoring cross-sections at the outlets of the seven sub-basins of the Niyang River as reference points. This approach ensures that the analysis captures the dynamic interactions between land use and water flow within the basin. Four spatially scaled hydrological buffer zones – 1 km, 2 km, 3 km, and 5 km – were delineated around each monitoring section. These buffer zones were designed to encompass varying degrees of influence from upstream activities, providing a comprehensive understanding of how land use changes affect water quality and quantity.
The corresponding land use types within these buffer zones were identified using high-resolution satellite imagery and field survey data (Fig. 2). This multi-scale approach allows for a detailed examination of land cover changes and their impacts on hydrological processes.
Spatial Patterns of Land Use Structure
As illustrated in Fig. 2, the land use structure within the buffer zones corresponding to the seven monitoring sections exhibits a consistent pattern: as the spatial scale increases, the buffer zones become progressively more diverse in land use types. However, significant variations are observed across different monitoring sections and spatial scales. Notably, sections S5, S6, and S7 show the most substantial changes in land use composition across different spatial dimensions.
Section S7: At the 1 km scale, this section is entirely composed of water bodies (100%). As the buffer zone expands to 5 km, the proportion of water area decreases to 26.3%, while forested land increases by 37.7% and cropland by 26.8%. This transition reflects the gradual inclusion of surrounding forests and agricultural lands, which can influence water quality through runoff and sedimentation.
Section S6: Initially, this section has 97.4% watershed coverage at the 1 km scale, indicating minimal human intervention. As the buffer zone increases to 5 km, the percentage of watershed area reduces to 17.3%, with forested land increasing by 16.8% and cropland by 48.7%. The significant increase in cropland suggests higher potential for nutrient runoff and soil erosion, impacting downstream water quality.
Fig. 2.
Land use structure of the buffer zones a)1 km buffer; b) 2 km buffer; c) 3 km buffer; d) 5 km buffer). The figure delineates land use patterns within hierarchically nested hydrological buffer zones, leveraging high-resolution satellite imagery and field-surveyed data to classify terrain characteristics. It visually differentiates zones based on their hydrological sensitivity, contrasting natural landscapes with anthropogenically altered areas. Spatial overlays elucidate the interactions between land cover dynamics and hydrological processes across multiple scales, emphasizing riparian corridors as key interfaces for regulating pollutant transport. The illustration synthesizes geospatial heterogeneity with hydrological connectivity, illustrating how land management practices influence buffer zone effectiveness. This stratified representation links empirical observations with broader landscape-scale impacts, thereby supporting the development of adaptive strategies to harmonize ecological functions with human activities.
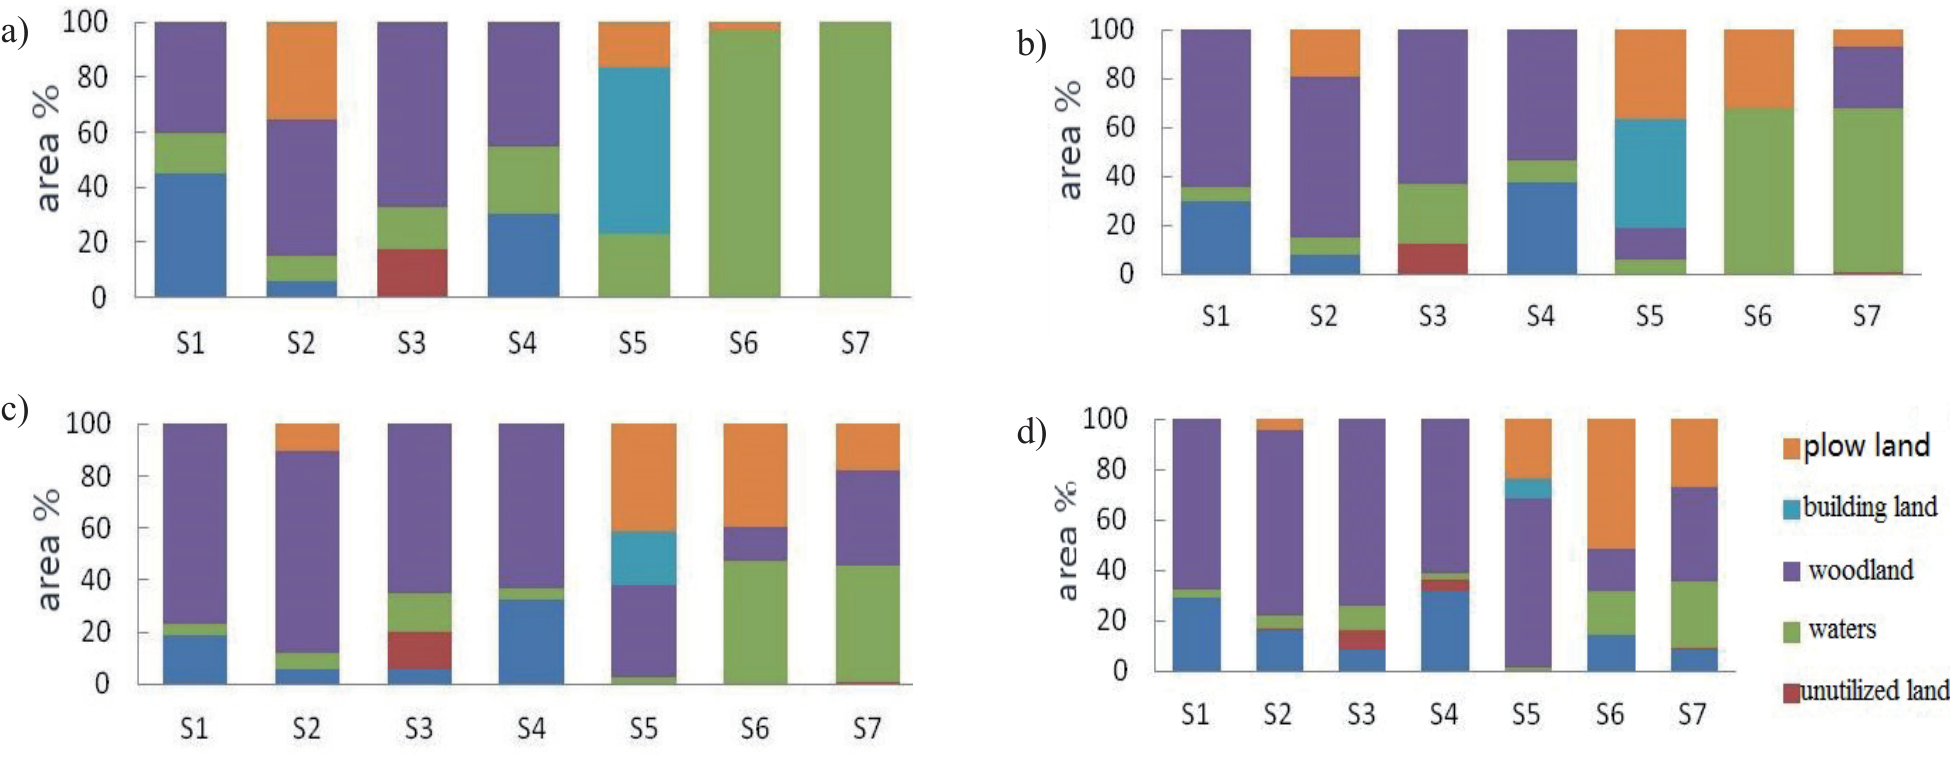
Section S4: At the 1 km scale, this section has 44.4% watershed coverage, which decreases to 7.7% at the 5 km scale. Meanwhile, woodland increases by 54.3%, indicating a shift towards more natural vegetation cover. This change can enhance water retention and reduce pollutant loads entering the river.
A similar trend is observed for sections S1 to S4, where the richness of land use types within the buffer zones increases with scale, particularly with a gradual increase in forested land area. Forested areas play a crucial role in maintaining water quality by filtering pollutants, stabilizing soil, and regulating water flow.
Implications for Downstream and Upstream Areas
The results from Fig. 2 indicate that the downstream valley is wider than the upstream area, with construction land and cultivated land predominantly distributed downstream. Consequently, human activities have a more significant impact on land use in the downstream region compared to the upstream. For example, urbanization and intensive agriculture in downstream areas can lead to increased pollutant loads, such as nutrients and sediments, which may degrade water quality.
In contrast, upstream areas tend to have less anthropogenic influence, preserving more natural land cover types like forests and wetlands. These areas serve as critical buffer zones that help mitigate the effects of downstream pollution. Effective land use management practices, such as riparian buffers and sustainable farming techniques, can be implemented in both upstream and downstream regions to protect and enhance water quality throughout the Niyang River Basin.
Overall, this study provides valuable insights into the spatial dynamics of land use and its impact on hydrological processes. By understanding these patterns, policymakers and environmental managers can develop targeted strategies to balance development needs with ecological preservation, ensuring sustainable water resource management in the Niyang River Basin.
Response Relationship between River Water Quality and Land Use Changes
Correlation between River Water Quality and Land Use Structure
The correlation analysis between land use structure and water quality parameters (COD, NH3-N, TN, and TP) during the flood season at different buffer scales is presented in Table 2. This study aims to understand how changes in land use within varying spatial extents influence river water quality. The flood season is particularly critical as it can exacerbate pollutant transport from land to water bodies, making this period an important focus for environmental monitoring. The focus of this study on flood-season water quality highlights the operational necessity to address peak non-point source pollution risks, which are intensified by increased rainfall and surface runoff during this period. Although land use-water quality relationships may exhibit seasonal variability due to changes in hydrological connectivity and pollutant transport pathways, the present analysis prioritizes the identification of buffer zones relevant for management during high-risk periods. The discussion incorporates findings from existing regional studies that underscore the dominant role of flood-season pollutant fluxes in shaping annual contamination budgets in mountainous basins, thereby providing context for the seasonal emphasis of this analysis. Future investigations will adopt multi-seasonal sampling and temporal modeling frameworks to comprehensively assess dry-wet season dynamics. This phased approach ensures alignment with immediate management requirements while laying the groundwork for more extensive temporal analyses.
1) Correlation analysis of COD concentrations
At the 1 km buffer scale, there was a significant negative correlation with watersheds (-0.8, P<0.05). This suggests that areas closer to the river’s edge, which are predominantly watershed regions, tend to have lower COD levels. Watershed areas often act as natural filters, reducing pollutant loads before they reach the river.
Forest land showed a dominant positive correlation of 0.876 (P<0.01). Forested areas contribute positively to COD levels, likely due to organic matter decomposition and leaf litter inputs, which can increase biochemical oxygen demand.
In the 2 km and 3 km buffer zones, forest land exhibited significant positive correlations of 0.917 and 0.923 (P<0.01), respectively. These higher correlations indicate that forested areas within these larger buffer zones continue to play a crucial role in influencing COD levels.
At the 5 km buffer scale, cropland had a significant negative correlation of -0.811 (P<0.05). Agricultural activities typically reduce COD levels in more distant buffer zones, possibly due to better management practices or dilution effects.
These findings suggest that COD concentrations are more influenced by forest land than other land use types. Forests act as both sources and sinks for organic matter, impacting water quality differently depending on their proximity to the river.
2) Correlation analysis of TP concentrations
TP did not show significant correlations with any land use type across different buffer zones, and the correlation coefficients were generally small. This indicates that phosphorus levels in the river are less directly influenced by immediate land use patterns. Instead, TP may be more affected by long-term soil accumulation, groundwater flow, or point source pollution events.
Table 2.
Pearson correlation coefficients between buffer-scale water quality parameters and land use types.
3) Correlation analysis of NH3-N concentrations
NH3-N was significantly correlated with cropland only in the 1 km buffer zone, with a significant positive correlation coefficient of 0.934 (P<0.01). This strong correlation highlights the direct impact of agricultural activities on ammonia nitrogen levels in nearby water bodies. Intensive farming practices, such as fertilizer application and livestock waste, can lead to high NH3-N runoff into rivers.
4) Correlation analysis of TN concentrations
TN showed significant correlations with water bodies, forest land, and cropland across different buffer zones.
At the 1 km buffer scale, TN had a significant negative correlation with water bodies (-0.774, P<0.05). This suggests that areas dominated by water bodies tend to have lower TN levels, possibly due to dilution effects or natural filtration processes.
In the 2 km and 3 km buffer zones, TN exhibited significant positive correlations with forest land of 0.869 and 0.910 (P<0.01), respectively. Forested areas appear to be significant contributors to TN levels, potentially through nitrogen fixation by trees and microbial activity in forest soils.
At the 5 km buffer scale, TN had a significant negative correlation with cropland of -0.762 (P<0.05). Similar to COD, agricultural activities in more distant buffer zones may reduce TN levels, possibly due to better nutrient management practices or dilution.
Overall Findings and Implications
Overall, the analysis indicates that the 1 km buffer zone contains more indicators significantly correlated with river water quality. This suggests that immediate land use patterns around the river have a substantial impact on water quality parameters. However, the strongest correlations between river water quality and land use occur in the 3 km buffer zone. Forest land appears to be the primary land use type influencing TN and COD concentrations in water bodies.
These findings underscore the importance of considering multiple spatial scales when assessing the impact of land use on water quality. For instance, implementing riparian buffers and sustainable agricultural practices within the 1 km buffer zone can help mitigate pollutant loads. Additionally, preserving and enhancing forest cover in the 3 km buffer zone can further improve water quality by regulating nutrient cycles and reducing erosion.
By understanding these spatial dynamics, policymakers and environmental managers can develop targeted strategies to balance development needs with ecological preservation, ensuring sustainable water resource management in the Niyang River Basin.
Relationship between River Water Quality and Land Use Structure
The regression analysis examines the relationship between river water quality parameters (such as COD, NH3-N, TN, and TP) and land use structure across different buffer zones. This study aims to quantify how changes in land use patterns influence water quality metrics during critical periods, such as the flood season. Understanding these relationships is crucial for developing effective strategies to protect and improve water quality in river systems.
Water quality in rivers is significantly influenced by land use activities within their watersheds. During the flood season, increased runoff can transport pollutants from various land use types into the river, exacerbating water quality issues. Therefore, it is essential to analyze how different land use structures affect key water quality parameters at varying spatial scales. This information can inform policymakers and environmental managers about the most effective areas to target for conservation efforts. To conduct this comprehensive analysis, we utilized data from multiple monitoring stations within the Niyang River Basin. The land use structure was categorized into various types, including watersheds, forest land, cropland, and urban areas. Buffer zones were delineated at four spatial scales: 1 km, 2 km, 3 km, and 5 km around each monitoring station. These buffer zones allow us to examine the impact of land use at different distances from the river. Regression models were developed to assess the statistical significance of correlations between land use types and water quality indicators.
The data collection process involved regular sampling of water quality parameters at each monitoring station throughout the flood season. High-resolution satellite imagery and field surveys were used to classify land use types accurately. Statistical software was employed to perform regression analyses, ensuring robust and reliable results (Table 3).
1) COD concentrations
1 km Buffer Scale: There was a significant negative correlation with watersheds (-0.8, P<0.05), indicating that closer proximity to watershed areas tends to reduce COD levels. Watershed areas often act as natural filters, reducing pollutant loads before they reach the river.
Forest Land: Forest land showed a dominant positive regression of 0.876 (P<0.01). Forested areas contribute positively to COD levels, likely due to organic matter decomposition and leaf litter inputs, which can increase biochemical oxygen demand.
2 km and 3 km Buffer Zones: Forest land exhibited significant positive correlations of 0.917 and 0.923 (P<0.01), respectively. These higher correlations suggest that forested areas within these larger buffer zones continue to play a crucial role in influencing COD levels.
5 km Buffer Scale: Cropland had a significant negative correlation of -0.811 (P<0.05). Agricultural activities in more distant buffer zones may reduce COD levels, possibly due to better management practices or dilution effects.
These findings indicate that COD concentrations are more influenced by forest land than other land use types. Forests act as both sources and sinks for organic matter, impacting water quality differently depending on their proximity to the river. The observed positive relationship between forest cover and elevated COD levels may reflect natural biogeochemical processes inherent to forest ecosystems. While forests typically function as pollution buffers, their role in organic matter cycling can contribute to water quality parameters through leaf litter accumulation and decomposition, which release dissolved organic compounds into aquatic systems. The specific forest composition (e.g., deciduous vs. coniferous species) and soil characteristics (e.g., organic content, microbial activity) likely influence the magnitude of this effect, as different vegetation types exhibit varying decomposition rates and organic compound profiles. Hydrological connectivity during rainfall events may further mediate the transport of these forest-derived organics to water bodies. While external pollution sources cannot be entirely discounted, the current findings align with documented patterns of natural organic loading in forested watersheds. Future investigations will systematically evaluate these potential drivers through detailed soil-water interface studies and forest typology analyses to differentiate between intrinsic ecosystem processes and potential anthropogenic contamination pathways.
2) TP concentrations
TP did not show significant correlations with any land use type across different buffer zones, and the correlation coefficients were generally small. This suggests that phosphorus levels in the river are less directly influenced by immediate land use patterns. Instead, TP may be more affected by long-term soil accumulation, groundwater flow, or point source pollution events.
3) NH3-N concentrations
NH3-N was significantly correlated with cropland only in the 1 km buffer zone, with a significant positive correlation coefficient of 0.934 (P<0.01). This strong correlation highlights the direct impact of agricultural activities on ammonia nitrogen levels in nearby water bodies. Intensive farming practices, such as fertilizer application and livestock waste, can lead to high NH3-N runoff into rivers.
4) TN concentrations
TN showed significant correlations with water bodies, forest land, and cropland across different buffer zones.
1 km Buffer Scale: TN had a significant negative correlation with water bodies (-0.774, P<0.05). This suggests that areas dominated by water bodies tend to have lower TN levels, possibly due to dilution effects or natural filtration processes.
2 km and 3 km Buffer Zones: TN exhibited significant positive correlations with forest land of 0.869 and 0.910 (P<0.01), respectively. Forested areas appear to be significant contributors to TN levels, potentially through nitrogen fixation by trees and microbial activity in forest soils.
Table 3.
Regression analysis between land use structure and water quality index.
5 km Buffer Scale: TN had a significant negative correlation with cropland of -0.762 (P<0.05). Similar to COD, agricultural activities in more distant buffer zones may reduce TN levels, possibly due to better nutrient management practices or dilution.
Overall, the regression analysis indicates that the 1 km buffer zone contains more indicators significantly correlated with river water quality. This suggests that immediate land use patterns around the river have a substantial impact on water quality parameters. However, the strongest correlations between river water quality and land use occur in the 3 km buffer zone. Forest land appears to be the primary land use type influencing TN and COD concentrations in water bodies.
These findings underscore the importance of considering multiple spatial scales when assessing the impact of land use on water quality. For instance, implementing riparian buffers and sustainable agricultural practices within the 1 km buffer zone can help mitigate pollutant loads. Additionally, preserving and enhancing forest cover in the 3 km buffer zone can further improve water quality by regulating nutrient cycles and reducing erosion. By understanding these spatial dynamics, policymakers and environmental managers can develop targeted strategies to balance development needs with ecological preservation, ensuring sustainable water resource management in the Niyang River Basin. Future research could explore the temporal variations in these relationships and investigate the effectiveness of specific land management practices in improving water quality.
Discussion
This study reveals that the water quality of the mainstream Niyang River ranges between Class I and Class III, with all monitoring sections meeting Class III standards. Compared to the previous flood season [27], the spatial distribution of pollution remains consistent, but the overall water quality has shown a deteriorating trend. Specifically, downstream water quality is significantly better than upstream, attributed to increasing population in the watershed and more frequent human activities downstream, leading to higher pollution loads. The primary source of pollution in the river is surface runoff from the watershed, which aligns with findings on agricultural surface pollutants in the region [28].
The Niyang River Basin serves as a critical water resource for both ecological and human needs. Understanding the factors influencing its water quality is essential for effective environmental management. During the flood season, increased runoff can transport pollutants from various land use types into the river, exacerbating water quality issues. Therefore, it is crucial to analyze how different land use structures affect key water quality parameters at varying spatial scales.
Spatial Distribution of Pollution
The difference in surface pollution loads between Gongbu Jiangda and Linzhi counties upstream directly influences spatial changes in water quality. Changes in land use structure within the hydrological buffer zones upstream of each monitoring section directly or indirectly affect local water quality concentrations. As the buffer zone scale increases, forested land gradually expands while built-up and cultivated land initially increase and then decrease. This pattern reflects the concentration of human activities in the river valley area, where construction and cultivated lands are predominantly located along the riverbanks, and the watershed is mainly forested [18]. For example, in Gongbu Jiangda County, urban expansion and agricultural intensification have led to higher pollutant loads compared to Linzhi County, where forest cover remains relatively intact. This disparity highlights the importance of considering regional differences when assessing water quality impacts.
Influence of Land Use Structure
Notably, there are no point sources of pollution discharge in the Niyang River mainstream; thus, the primary pollution source is agricultural surface runoff. Selecting monitoring points and analyzing the relationship between hydrological scales and spatial land use is scientifically sound for this study. Agricultural practices, such as fertilizer application and livestock farming, contribute significantly to nutrient loading in the river system.
Previous studies have demonstrated that land use type can effectively explain pollutant loads in water bodies, with changes in land use structure correlating with shifts in water quality indicators, thereby predicting water quality trends [29]. Our results show significant negative correlations between COD and TN concentrations in watersheds and water bodies, consistent with the self-purification effect of river systems. Increased watershed area enhances the water body’s self-purification capacity, positively impacting water quality.
Forested areas exhibit significant positive correlations with COD and TN concentrations, as vegetation and root systems absorb and intercept pollutants from surface runoff and soil [30]. However, the hydrological distance between forested areas and monitoring sections in the Niyang River Basin is relatively large, and frequent human activities in the intervening valley areas result in differing outcomes compared to mainland watershed studies [31].
This study acknowledges the need for actionable land management strategies informed by its findings on the 3 km buffer zone. To mitigate pollution, policymakers could prioritize expanding forested areas within this critical buffer, leveraging their demonstrated capacity to reduce nutrient and sediment fluxes through enhanced filtration and stabilization. Simultaneously, regulating agricultural runoff in proximal zones is essential, given croplands’ dual role as both nutrient sinks and potential pollution sources during intensive cultivation. Implementing targeted zoning regulations to restrict high-impact activities (e.g., excessive fertilizer application or deforestation) within hydrologically sensitive areas of the buffer could further optimize water quality outcomes. The study underscores the importance of adaptive management frameworks that account for the spatial heterogeneity of land use impacts observed across scales. For instance, riparian forest restoration could be prioritized in areas with steep slopes or high erosion risk, while precision agriculture practices might be mandated in flat, fertile valleys to minimize nutrient leakage. By integrating these spatially explicit interventions with the identified 3 km threshold, the findings provide a basis for designing multi-tiered mitigation strategies that align hydrological connectivity with land use governance. Such recommendations aim to translate the scale-dependent relationships uncovered in this research into practical, place-based solutions for watershed management.
Impact of Cropland and Buffer Zones
Cropland in the watershed, primarily distributed in the river valley, receives irrigation water from the Niyang River. During cultivation, crops intercept and absorb nitrogen fertilizers, which eventually converge into the river through runoff, positively affecting water quality. The heterogeneity of land use structures at different buffer scales leads to varying responses of pollutants in water bodies to land use changes. For instance, cropland in the watershed is mainly distributed in the river valley, receiving irrigation water from the Niyang River. Crops intercept and absorb nitrogen fertilizers during cultivation, which eventually converge into the river through runoff, positively affecting water quality.
The optimal buffer scale for influencing water quality remains controversial, but our analysis indicates that the impact of land use on TN and COD concentrations is most pronounced at the 3 km buffer scale, with forested land being the most influential land type. Thus, the optimal buffer zone for the Niyang River is 3 km. This finding differs from other watershed studies, such as the 300 m buffer zone for the Han River [32] and the 200 m buffer zone for the Fuxian Lake watershed [33], highlighting the lack of consensus on the spatial scale relationship between river water quality and land use.
This study ascribes the varying correlations between land use and water quality across spatial scales to the interplay among basin geomorphology, hydrological dynamics, and human activity distributions. The analysis demonstrates that smaller buffer zones primarily capture localized processes where steep topography accelerates pollutant transport from adjacent agricultural lands and settlements via surface runoff, with limited opportunity for natural attenuation. Conversely, larger buffers encompass complex topographical features that redirect or filter contaminants along extended flow paths, while prolonged hydrological retention in expansive areas facilitates nutrient cycling and sediment deposition. Furthermore, the findings reveal that intense anthropogenic pressures near riverbanks ‒ particularly those associated with agriculture and urbanization ‒ exert pronounced effects at smaller scales, whereas their impacts are mitigated in broader buffers due to intervening forests and wetlands. Spatial heterogeneity in soil permeability and drainage patterns across scales also modulates contaminant delivery efficiency. Although this study identifies these mechanisms as potential drivers of scale-dependent relationships, it recognizes the necessity of integrating high-resolution hydrological models and detailed land use activity mapping in future research to quantitatively assess their relative contributions. These insights enhance our understanding of how scalar thresholds in buffer zone delineation influence terrestrial-aquatic linkages within mountainous watersheds.
Importance of River Buffer Zones
The river buffer zone, as a critical interface between land and water, facilitates material exchange between aquatic and terrestrial ecosystems. Our study shows that the land use structure within the 3 km buffer zone has the greatest influence on TN and COD concentrations, underscoring the need for scientifically adjusting land use configurations within this buffer zone to defend against pollution and enhance riverine ecological functions.
Buffer zones play a vital role in mitigating the impact of land-based pollutants on water quality. Forested buffer zones, in particular, act as natural filters, reducing sediment and nutrient loads entering the river. Effective management of these buffer zones can significantly improve water quality and support biodiversity conservation. For example, riparian buffers planted with native vegetation can enhance water filtration and provide habitat for wildlife.
In conclusion, this comprehensive analysis of the Niyang River Basin underscores the complex interplay between land use and water quality. The deterioration of water quality, particularly upstream, is driven by increasing human activities and agricultural runoff. The 3 km buffer zone emerges as the optimal scale for managing land use impacts on TN and COD concentrations. Future research should focus on refining buffer zone management strategies and exploring the temporal variations in water quality to develop more effective conservation measures. By understanding these dynamics, policymakers and environmental managers can implement targeted interventions to protect and restore the Niyang River’s water quality and ecological health.
The observed linkages between forest cover and water quality parameters emerge from complex ecosystem interactions that transcend simplistic source-sink dichotomies. Forest systems inherently mediate material flows through coupled biogeochemical and hydrological processes, where vegetative composition regulates organic matter production while soil profiles dictate decomposition pathways and retention capacities. The spatial configuration of forests relative to aquatic networks creates gradients of influence, with riparian zones serving as critical control points for organic compound mobilization. Seasonal variations in litterfall patterns and precipitation regimes further modulate the temporal dynamics of forest-derived organic loading, suggesting water quality impacts represent the integration of ecological processes operating across multiple scales. Microbial communities in forest soils and hyporheic zones likely act as biochemical transformers, altering the composition and bioavailability of organic matter during its transition from terrestrial to aquatic environments. This mechanistic framework highlights the necessity of distinguishing between autochthonous organic inputs from forest ecosystems and allochthonous contaminants from anthropogenic sources when interpreting water quality patterns. Future research directions emphasize process-based modeling to disentangle these overlapping influences, combining isotopic tracing of organic compounds with high-resolution hydrometeorological monitoring to quantify forest-water exchange mechanisms under varying climatic and land management scenarios. Such approaches will advance predictive capabilities for watershed-scale organic matter cycling while informing targeted conservation strategies that balance ecological functions with water quality objectives.
This study acknowledges that the land use-water quality relationships identified in the Niyang River Basin may differ across watersheds characterized by distinct environmental and socio-economic conditions. In highly urbanized basins, impervious surfaces and concentrated wastewater discharges are likely to dominate water quality degradation, potentially diminishing the filtration benefits of buffer zones observed in this study. Industrialized systems may exhibit stronger correlations between water quality and point-source pollutants, necessitating tailored buffer management strategies focused on chemical contaminants rather than nutrient-driven agricultural runoff. For arid regions, reduced hydrological connectivity and sparse vegetation cover could weaken the natural attenuation capacity of buffer zones, thereby altering the spatial scale at which land use impacts become significant. Conversely, in densely forested tropical basins, organic matter leaching from riparian vegetation might introduce competing water quality pressures not observed in temperate systems such as the Niyang. The framework developed here – centering on hydrological connectivity, land use intensity, and biome-specific retention processes – remains broadly applicable but requires adaptation to specific contexts. Urban systems may prioritize engineered green infrastructure within smaller buffers for stormwater interception, while arid basins might emphasize groundwater recharge zones at larger scales. This study highlights the importance of integrating localized hydrological mechanisms with land use patterns when extrapolating findings, advocating for region-specific calibration of buffer zone interventions rather than one-size-fits-all prescriptions.
Conclusions
The water quality of the mainstream Niyang River has been consistently maintained at Class III for surface water. COD is a particularly critical indicator in the river system, and pollutant concentrations have shown a significant downward trend along the river’s flow direction. The Niyang River Basin is predominantly forested, with construction land and cultivated land mainly concentrated in the downstream valley area. Spatially, as the buffer zone scale increases, the proportion of construction land, cultivated land, and water areas gradually decreases, while the proportion of forested land shows a clear upward trend. This pattern indicates that the downstream portion of the watershed experiences greater human activity interference compared to the upstream.
Significant correlations were observed between land use structure and specific water quality indicators at different buffer zone scales. Forested land within the 1 km buffer zone was a key explanatory variable for COD, showing a significant positive correlation with COD levels. Cropland was a significant explanatory variable for NH3-N, exhibiting a strong positive correlation with ammonia nitrogen concentrations. Water bodies were an explanatory variable for TN, demonstrating a significant negative correlation with total nitrogen levels. Cultivated land in the 2 km buffer zone was significantly positively correlated with both COD and TN. Forested land in the 3 km buffer zone showed significant positive correlations with both COD and TN. In contrast, cultivated land in the 5 km buffer zone exhibited significant negative correlations with both COD and TN. The 3 km buffer zone had the highest explanatory power for water quality parameters.
By quantitatively analyzing the relationship between land use structure and water quality at various buffer zone scales in the Niyang River, this study determined that the most effective spatial scale for water quality management is 3 km. Additionally, it identified the land use types most significantly related to water quality. Based on these findings, targeted measures can be implemented to manage and optimize the water quality of the Niyang River Basin, providing valuable insights for the protection of the Niyang River’s aquatic ecosystem.

