Introduction
In recent years, heavy metal (HMs) pollution in farmland soil has become a global concern. Studies reveal that HMs contamination affects approximately 235 million hectares of agricultural soil worldwide, including in Japan, China, Bangladesh, India, and Australia [1]. A Ministry of Environment survey in Japan revealed that Cd pollution tainted over 6000 hectares of agricultural soil throughout the country [2]. At the same time, the concentration of Cd in agricultural soil is increasing annually in China [3]. According to the initial national survey on soil pollution conducted across China from 2005 to 2013, roughly 19.4% of the cultivated land in the country, approximately 26 million hectares, suffered from pollution, particularly heavy metals and metalloids. Cd emerged as the primary pollutant in farmland soil in China, with a point exceeding rate as high as 7.0% [4]. Therefore, cadmium pollution in soil used for farming has become a significant environmental issue.
Biochar is a carbon-rich particle produced by heating biomass, such as straw, livestock and poultry manure, and other agricultural and forestry waste, at low temperatures (< 700°C) in an oxygen-limited environment. Its potential applications include carbon sequestration, reducing emissions, improving soil quality, recycling waste, and remedying environmental pollution. As a result, scientists studying soil and the environment in the US and beyond have taken a keen interest in biochar [5-8]. Biochar possesses a sizeable specific surface area and copious oxygen-containing functional groups, rendering it an excellent adsorbent for heavy metals [9-12]. Due to variations in biomass material selection and preparation conditions, biochar exhibits significant differences in physical properties, elemental composition, surface chemical properties, and microstructure. These differences ultimately result in varying environmental effects produced by biochar [13]. Biochar is a carbon-based material with a complex structure and composition. The specific surface area, mineral composition, surface structure, aromaticity, and surface functional groups of biochar are all heavily influenced by its biomass sources and pyrolysis conditions. The structural characteristics of biochar significantly impact its ability to adsorb HMs [14]. Investigating the adsorption mechanism of biochar on heavy metals can establish a theoretical foundation for the management and restoration of biochar in heavy metal-contaminated soil [15]. Chin et al. [7] deeply conducted a comprehensive investigation on the heterogeneous adsorption of heavy metals by modified biochar. Their findings suggest that introducing functional groups onto biochar surfaces through magnetic and chitosan modification significantly enhances its adsorption capacity for different heavy metals. The main mechanism involved in the removal of heavy metals is chemical adsorption. Wang et al. [16] introduced a first-principles calculation approach to investigate the capability and potential mechanism of iron hydroxide-modified graphene (Fe@G) in absorbing CdCl2. Their research identified Fe@G as a highly effective adsorption material for reducing Cd content in farmland soil. Furthermore, they uncovered the capture mechanism of Cd by Fe@G and offered a novel means for reducing Cd in agricultural soil. Chen et al. [17] investigated the immobilization mechanism of Cd in Cd-contaminated soil using native wheat straw biochar (BC) and sulfide biochar (SBC). The results showed that SBC had a higher adsorption efficiency than BC, indicating that sulfur modification provided more active adsorption centers for Cd. Wu et al. [18] investigated the impact of biochar modified with sulfur or sulfur-iron on cadmium immobilization in cadmium-contaminated soil, along with the resulting changes in microbial communities. The results indicate that the effective cadmium concentration in soil decreased upon adding sulfur-iron modified biochar, and the continued decline of cadmium concentration could be attributed to the improved immobilization of the new sulfur-iron modified biochar material.
Currently, the prevention and control of soil pollution by heavy metals in related research areas involves incorporating amendments such as zeolite, attapulgite, woody peat, straw biochar, and ash into the soil. This process reduces the mobility and toxicity of HMs to crops. It is imperative to incorporate these measures to ensure sustainable agricultural practices [19]. Woody peat is a natural humus comprising hydroxyl, carboxyl, alcohol, and other functional groups. It adsorbs HMs pollutants in soil via co-precipitation, chelation, and complexation, thereby decreasing their mobility. Technical terms mentioned in the text, such as HMs, will be defined when first used [20]. Due to the weak adsorption strength of natural woody peat to heavy metals (HMs), the current study utilized sulfur to modify woody peat and enhance its adsorption performance towards HMs. The main research was to: (1) Test the effect of SBC on Cd removal efficiency; (2) Analyze the adsorption mechanism of SBC on Cd by adsorption kinetic environmental factors and surface and performance analysis; and (3) Determine the effect of SBC on soil available for Cd. It provides a theoretical and scientific basis for the remediation of Cd-contaminated soil in farmland.
Materials and Methods
Preparation of BC and SBC
The woody peat used in this experiment was acquired from Fafard, Canada. This type of peat is composed of brown, fibrous, porous moss. The woody peat was dried, crushed, and sifted through a 0.9 mm sieve. Afterwards, it was washed three times with neutral deionized water to remove impurities. The peat was then extracted, filtered, and dried in a 60°C blast drying oven for eight hours. After cooling to room temperature, it was stored in a self-sealing bag for future use.
The powder was placed in a rectangular porcelain boat with nitrogen and then transferred to a muffle furnace, where it was heated at a rate of 10 °C/min until it reached 600°C. The powder was held at this temperature for 2 hours before being allowed to cool to room temperature. It was subsequently removed and stored in a self-sealing bag for further analysis as BC.
The sodium hydroxide solution (0.4 mol/L) and carbon disulfide (CS2) were combined in a 2:3 ratio and stirred on a magnetic stirrer at 25°C for 4 hours. The resulting modified solution was obtained via ultrasonication for 1 hour. Next, 10 g of BC was added to 100 ml of the modified solution at a solid-liquid ratio of 1:10, stirred on a magnetic stirrer at 40°C for 24 hours, removed, and dried in a blast drying oven at 60°C for 12 hours to obtain SBC.
Characterization
The soil was measured in deionized water at a ratio of 1:2.5 (W/V) using a pH meter (PHS-3E, Shanghai Jingke Lei Magnetic Instrument Factory). The element analyzer (Vario EL, Germany Elementa) was used to analyze the contents of C, N, H, and S in BC. The ash content was determined by heating the sample at 600°C for 2 hours. The specific surface area was measured using a specific surface and pore size analyzer (Quadrasorb EVO, Anton Paar Instruments, USA). The specific surface area and porosity of biochar prior to and after modification were calculated using the BET model at 200°C, utilizing a N2 adsorption-desorption curve of 77 K with an automatic gas adsorption instrument. Surface functional groups, elemental composition, and binding state of biochar before and after adsorption were analyzed by Fourier transform infrared spectroscopy (FTIR) and X-ray photoelectron spectroscopy (XPS, ESCALAB 250 Xi). The crystalline minerals on the surface of the biochar were analyzed using the D8 Advance X-ray diffractometer from Bruker AXS in Germany. For improved clarity and concision, technical term abbreviations were explained upon their initial use. Additionally, all language variants adhere to American spelling, grammar, and style conventions. The surface morphology was observed via a scanning electron microscope (GeminiSEM 300, Carl Zeiss, Germany). The content of available cadmium in the soil was determined by using inductively coupled plasma mass spectrometry (ICP-MS) with diethylene triamine pentaacetic acid (DTPA) as the solvent.
Adsorption Kinetics and Adsorption Isotherms
One hundred milliliters of Cd(II) solution with concentrations ranging from 0 to 100 mg/L were placed into conical flasks with a capacity of 250 ml. Each treatment was repeated three times. A 0.01 mol/L NaNO3 solution was used as the electrolyte, and the pH was adjusted to 6. The flasks were thoroughly mixed and then placed on an oscillator at 25°C and 180 r/min for 24 hours. The solutions underwent filtration through a 0.45 μm membrane, and the concentrations that remained were measured through ICP-MS analysis.
In the formula: C0 – The initial concentration of Cd(II), mg/L; Ce – The concentration of Cd(II) at adsorption equilibrium, mg/L; V – Volume of solution, L; m – Biochar quality, g; E – The removal rate of Cd(II), %.
In the formula: Qe – Adsorption capacity of Cd(II) at adsorption equilibrium, mg/g; Qt – Adsorption amount of time, mg/g; k1, k2 – Rate of adsorption;
In the formula: Qm – The maximum adsorption capacity, mg/g; b – Langmuir constant; Kf – Freundlich constant; n – Adsorption strength constant.
Soil Culture Experiment
The air-dried and sieved soil samples were supplemented with an aqueous solution of CdCl2·2.5H2O at a concentration of 10 mg/kg. The samples were evenly stirred and cultured, with regular stirring occurring every 7 days for 28 days. Soil water content was maintained at 75%. After the culture period, the total amount of Cd in the soil was 7.5 mg/kg. To investigate the impact of different amounts of SBC on the remediation of Cd-contaminated farmland, we added BC and SBC to 100 g of soil contaminated by Cd in plastic flowerpots at the ratios of 0.5%, 1.0%, 2.0%, and 5%. Each treatment was repeated three times. The passivation material was evenly mixed with the soil and cultured at room temperature (25°C) for 30 days while maintaining a soil water holding capacity of 70% during the culture period. After a 30-day period of culturing, the soil was allowed to dry naturally, then ground and transferred to a self-sealing bag for testing.
To further study the remediation effect of BC and SBC on Cd-contaminated soil, the best addition amount of peat biochar before and after modification on the remediation effect of Cd-contaminated farmland was selected according to the soil culture test. Three treatment trials were set up: CK, 1.0% BC, and 1.0% SBC, and each treatment was replicated three times. 1.0% BC and 1.0% SBC were added to plastic pots containing 1.5 kg of Cd-contaminated passivated soil with phosphorus fertilizer, potash, and urea at 1.25 mg/kg, 0.158 mg/kg, and 0.324 mg/kg, respectively, mixed evenly with the soil, and incubated for 30d. In each pot, 100 full ryegrass seeds were selected, soaked in a 2% H2O2 solution for 2 h, and then removed. The ryegrass seeds were washed three times with distilled water, placed on a culture dish with a filter membrane, and germinated in the dark at room temperature. After 3 days, the young buds were transplanted into the pot soil for growth. During the period, the soil moisture content was maintained at 70%, and the ryegrass was harvested after 50 days.
Results and Discussion
TGA Analysis
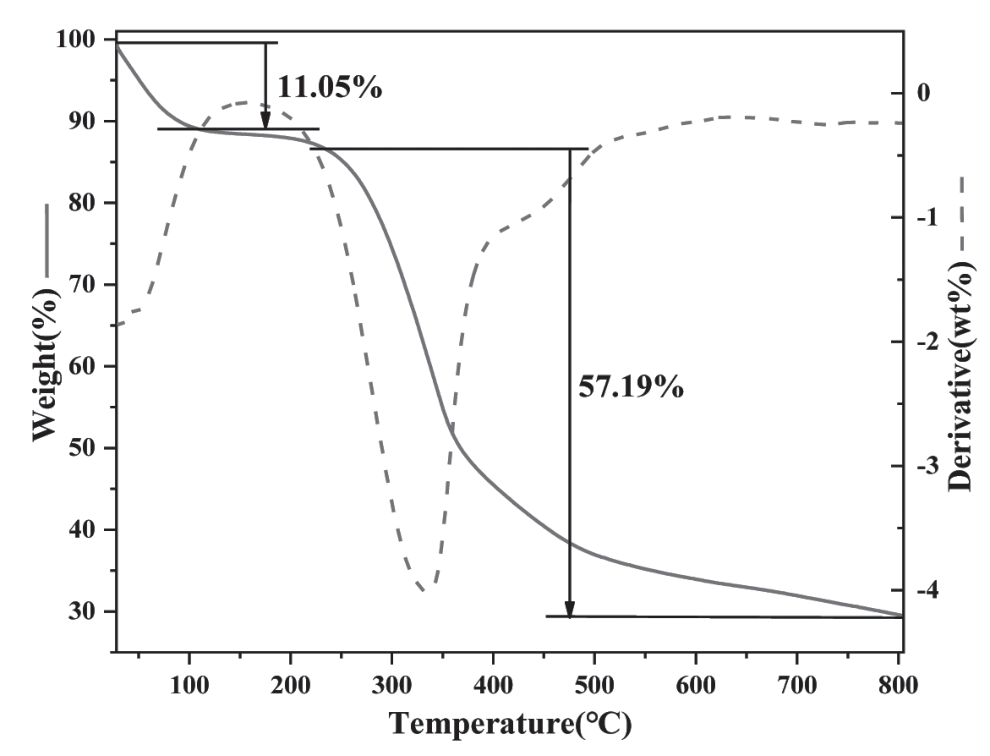
As shown in Fig. 1, the results of the TG/DTG curve indicate that the pyrolysis process of BC can be categorized into three evident pyrolysis stages. The initial stage temperature range is from 30 to 230°C, during which the dehydration and drying stages are predominantly due to cell tissue and surface tension in the woody peat raw material. Gradually increasing temperature causes free water in the internal free state to be rapidly desorbed [21]. During the second stage, woody peat raw materials experience the highest mass loss at a temperature range of 230-600°C. This is primarily due to the pyrolysis of various elements, such as carbon, cellulose, lignin, fatty acid, humic acid, and minerals found in organic matter [22]. After reaching a temperature range of 600°C in the third stage, the weight loss rate of BC stabilizes and remains unchanged with further temperature increases. This indicates that BC completes pyrolysis nearly entirely at 600°C. The combustion reaction of organic residues produces biochar abundant in carbon and with favorable pore structure, which enhances Cd adsorption. Research has indicated that the quantity of functional groups on the surface of biochar decreases with rising pyrolysis temperatures [23]. Therefore, the pyrolysis temperature of BC was 600°C in this experiment.
SEM and EDS Analysis
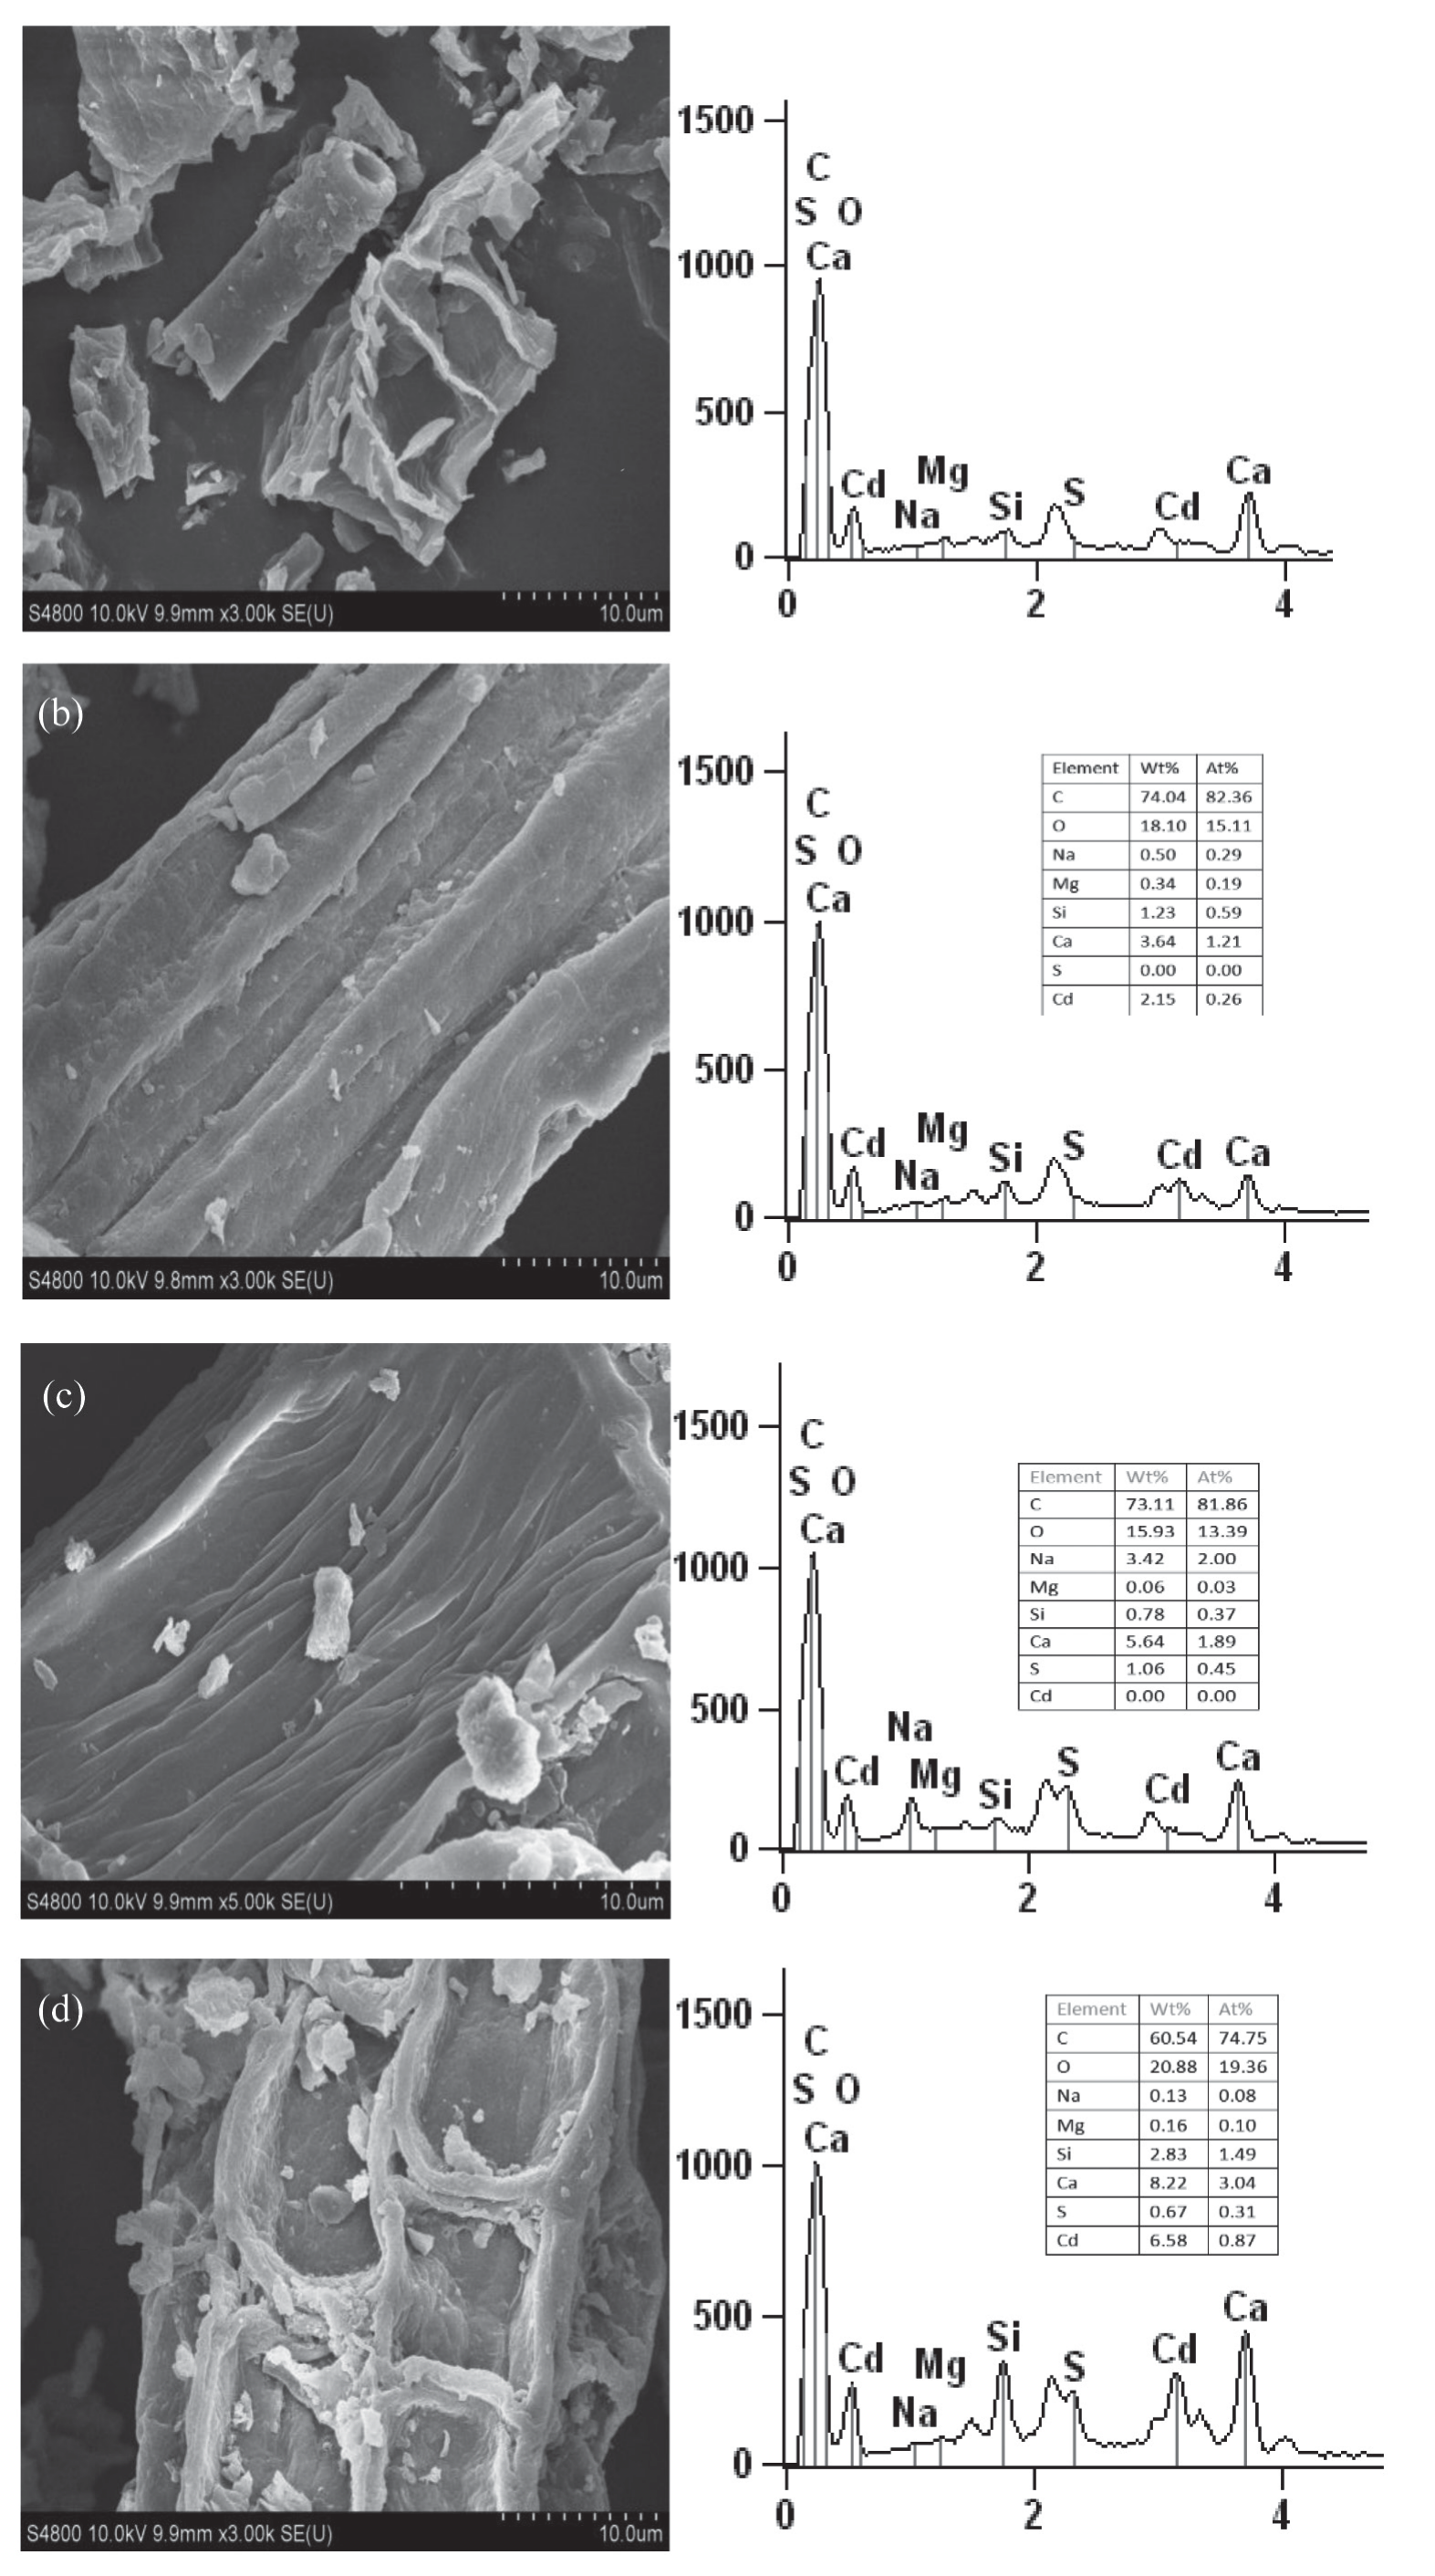
As depicted in Fig. 2a, the surface of BC is smooth, and there is no coarse white crystal particle precipitation. In Fig. 2c, the surface of SBC is rough, the stripe distribution is obvious, and there are white crystals. This may be because woody peat is loaded with sulfur and attached to the surface of BC. From the EDS diagrams of Figs. 2a and c, the sulfur content is increased from 0% (Wt) to 1.06% (Wt). It is further shown that after sulfur modification of BC, the sulfur element is successfully loaded on the surface of the material. Compared with Fig. 2a and c, the surface particles and white crystals of Fig. 2b and Fig. 2d increased and became rougher, which may be due to the co-precipitation, adsorption, chelation, and complexation of Cd with functional groups on the surface of biochar after adsorption to form new compounds attached to the surface of biochar, such as Cd (OH)2, CdS, and CdCO3 [24]. It can be seen from the EDS diagram that the absorption characteristic peaks of Cd in Fig. 2a and c were weak before adsorption, and the EDS characteristic peaks of Fig. 2b and d became stronger after adsorption, and the Cd content increased to 2.15% and 6.58%, respectively.
From Table 1, the content of C, N, and O in SBC decreased, while the content of H and S increased. The content of the S element increased from 0.09% to 2.09%, which was 22 times more than BC. The EDS diagram also showed that the sulfur content on the surface of SBC increased. Studies have shown that the sulfur content on the surface of biochar increases to 0.7% after sulfur modification [25]. The atomic molar ratio of H/C in BC was 0.063. After sulfur modification, the atomic molar ratio of H/C was 0.07, and the relative aromaticity increased after modification. The atomic molar ratio of H/C is an indicator of aromaticity and polarity [26]. The molar ratio of BC and SBC is less than 0.5, indicating that the adsorption characteristics of biochar have strong carbonization and high aromaticity [27]. The specific surface area and pore volume of BC and SBC were 2.86 m2/g, 0.0015 cm3/g, and 4.74 m2/g, 0.0044 cm3/g, respectively. The specific surface area and pore volume of SBC increased by 65.6% and 193.3%, respectively.
FTIR Analysis
Studies [28] have shown that the type and strength of functional groups on the surface of biochar have a great influence on the performance of chemical adsorption of heavy metals. The more functional groups on the surface of biochar, the stronger the ion exchange capacity of heavy metals and the better the ability to adsorb Cd(II).
The surface functional groups of BC mainly include: 3687-3000 cm-1 (N-H and O-H stretching vibration absorption peaks [29]), 2915 cm-1 (-CH2 aliphatic stretching vibration peak [30]), 2848 cm-1 (-CH causes symmetrical stretching vibration absorption), 1560 cm-1 (C=C double bond caused stretching vibration [31]), 1415 cm-1 (COO- caused stretching vibration absorption [32]).
The surface functional groups of SBC mainly include: 3687-3000 cm-1 (N-H and O-H stretching vibration absorption peak [33]), 2915 cm-1 (-CH2 aliphatic stretching vibration peak [34]), 2854 cm-1 (-CH caused symmetric stretching vibration absorption [35]), 1567 cm-1 (C=C double bond caused stretching vibration [36]), 1410 cm-1 (COO-caused stretching vibration absorption), 1240 cm-1 (C=S double bond absorption vibration peak [37]). 1020 cm-1 (C=S double bond absorption vibration peak [38]), 880 cm-1 (C-O caused stretching vibration peak [39]).
Fig. 2.
SEM-EDS before and after modification and adsorption of woody peat biochar at 600°C. (a) Woody peat biochar BC; (b) BC-Cd, after adsorption of Cd by woody peat biochar; (c) SBC, sulfur-modified woody peat biochar; (d) SBC-Cd, sulfur-modified biochar after adsorption of Cd.
As depicted in Fig. 3, after the modification of woody peat by sulfur, the range of 3687-3000 cm-1 becomes wider, the amplitude becomes stronger, and the functional groups of C=S double bond and C-O double bond are increased. The number of functional groups on the surface of SBC and the adsorption strength increased significantly, and the peak absorption peak shifted to the left on the original basis. After sulfur modification, the C-O- induced stretching vibration peak appeared at 880 cm-1 of BC, which helped to increase the adsorption sites of biochar for heavy metals [40]. In addition, the absorption peak of the Fe-O functional group appeared at 460 cm-1, which increased the ion exchange capacity of Cd(II), thus improving the adsorption performance of Cd(II) [41].
After the adsorption of Cd(II) by BC, some peaks changed significantly. The C=C double bond group at 1560 cm-1 shifted to 1585 cm-1, and the symmetrical absorption peak group was more obvious. After the adsorption of Cd(II) by sulfur-modified biochar, the original peaks at 1567, 1020 and 880 cm-1 were moved to 1583, 1030, and 865 cm-1, respectively. This may be due to the complexation and Π-Cd2+ interaction between aromatic C=C, C=S groups, C-O bonds, and Cd(II) in sulfur-modified biochar to form CdS precipitates [42]. In addition, after the adsorption of Cd(II), the peak shifts at 1410 and 880 cm-1 were weakened, which may be due to the adsorption of Cd(II) by COO- and C-O bonds [43].
XPS Analysis
In order to further clarify the differences in the adsorption of S and Cd by BC and SBC, X-ray photoelectron spectroscopy (XPS) was used to study the chemical binding morphological changes of C 1s, O 1s, and S 2p elements on the surface of modified woody peat biochar and the valence state changes of Cd in woody peat after adsorption of Cd.
The XPS full spectrum before and after the adsorption of S and Cd(II) by BC (Fig. 4) shows that the characteristic peaks of S 2p and Cd 3d appeared on the surface of BC. After the adsorption of Cd(II) by BC, the characteristic peaks of Cd 3d were newly generated, and the characteristic peaks of C 1s, O 1s, and S 2p changed greatly, indicating that Cd was adsorbed on the surface of BC. In Fig. 4a, before the reaction, C 1s had three characteristic peaks at 284.3, 284.8, and 285.8 eV, corresponding to C=C, C-C, and O-C-O, respectively [44]. After the adsorption of Cd(II) by BC, C=C and C-C increased from 46.19% and 32.35% to 51.44% and 38.79%, respectively. At the same time, O-C-O disappeared, and an O-C=O peak appeared at 287.9 eV, and its relative distribution was 9.77%, which indicated that the surface complexation reaction played an important role in the absorption of Cd(II). As shown in Fig. 4c, the O 1s spectrum is fitted into three characteristic peaks: O(I) (530.9-531.5 eV), C=O ; O(II) (532.1-532.9 eV), C=O(ester, amides) ; O(III)(533.3- 533.5 eV), C-O-C, -OH, and C-O-[45]; that is, C=O at 530.9 and 531.1 eV, C=O (ester, amides) at 532.1 eV, -OH at 533.1 and 533.4 eV. After adsorption of Cd (II), C=O and C=O (ester, amides) increased from 43.27%, and 41.45% to 45.71% and 43.54%, respectively. On the contrary, the relative distribution of -OH decreased from 15.28% to 10.75%. These changes further illustrate the surface complexation reaction of Cd(II) with the surface functional groups on woody peat biochar [46].
Table 1.
Specific surface area, pore size, and elemental analysis of BC and SBC
| Parameter (%) | BC | SBC |
|---|---|---|
| C | 61.84 | 56.49 |
| H | 3.90 | 3.96 |
| N | 1.51 | 1.36 |
| O | 15.56 | 13.48 |
| S | 0.09 | 2.09 |
| H/C | 0.063 | 0.07 |
| O/C | 0.25 | 0.22 |
| (O+N)/C | 0.28 | 0.26 |
| Surface(m2/g) | 2.86 | 4.74 |
| Pore volume(cm3/g) | 0.0015 | 0.0044 |
Fig. 3.
FTIR spectra of BC and SBC before and after Cd adsorption. (a) and (b) show the strengths and types of surface functional groups found in biochars, respectively.
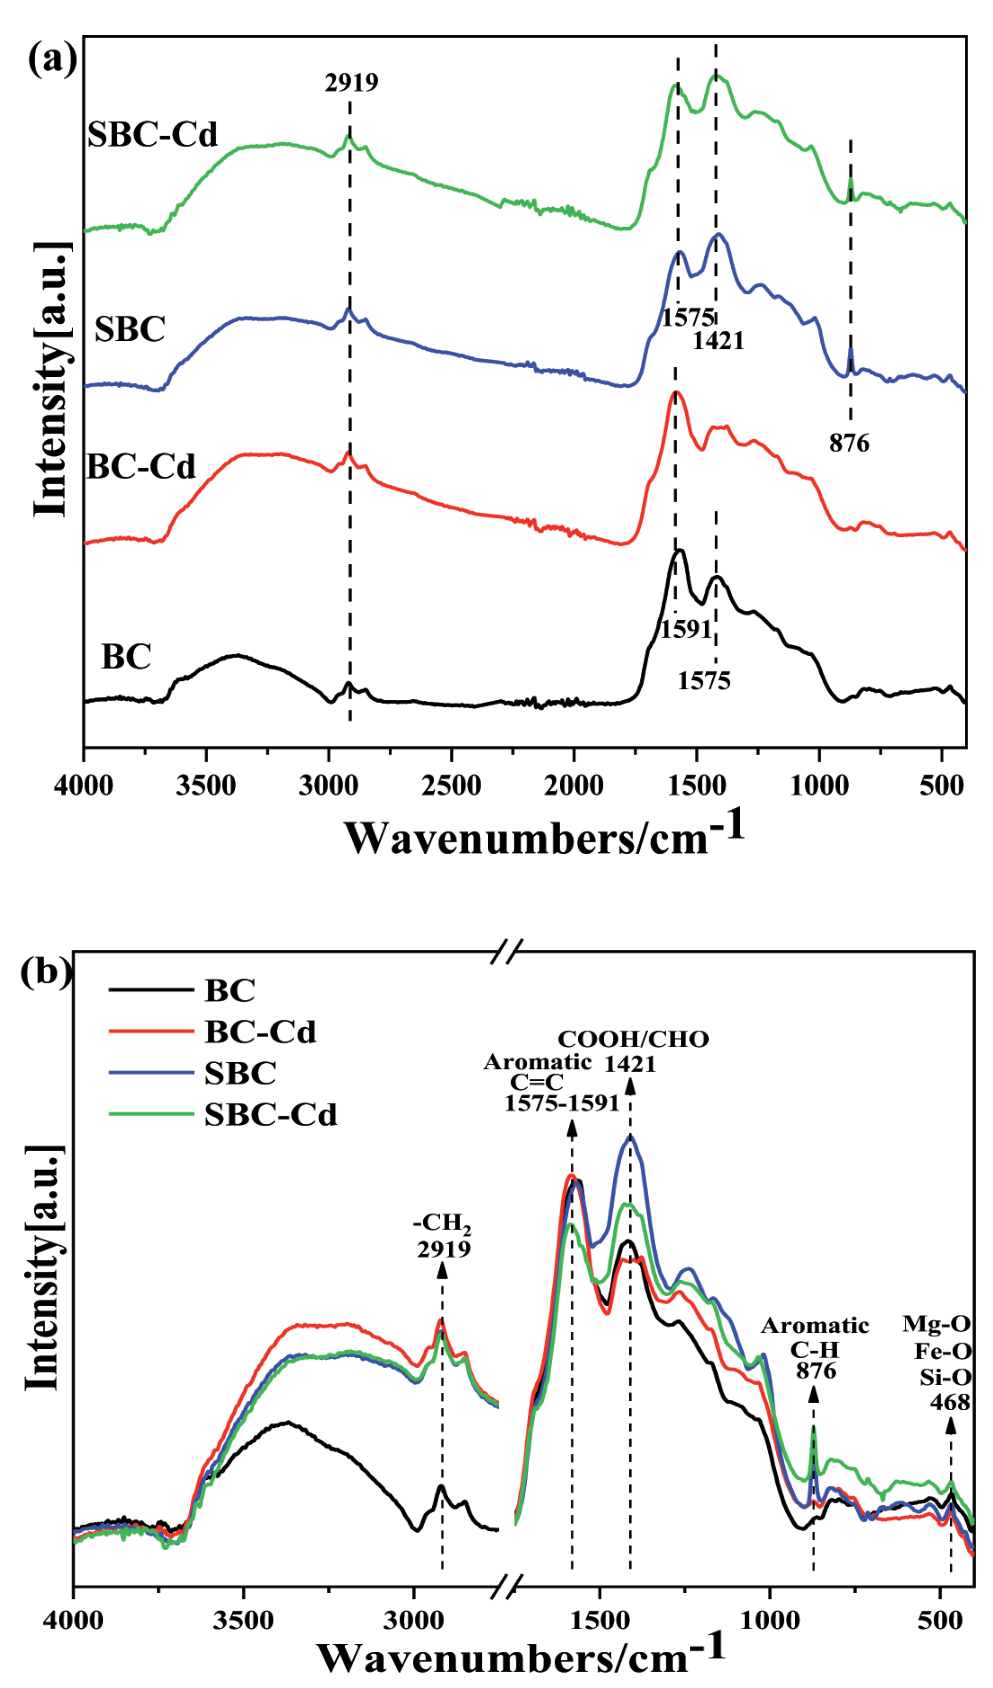
Fig. 4.
XPS spectra of C 1s, O 1s, S 2p and Cd 3d for BC and SBC before and after cadmium adsorption, respectively.
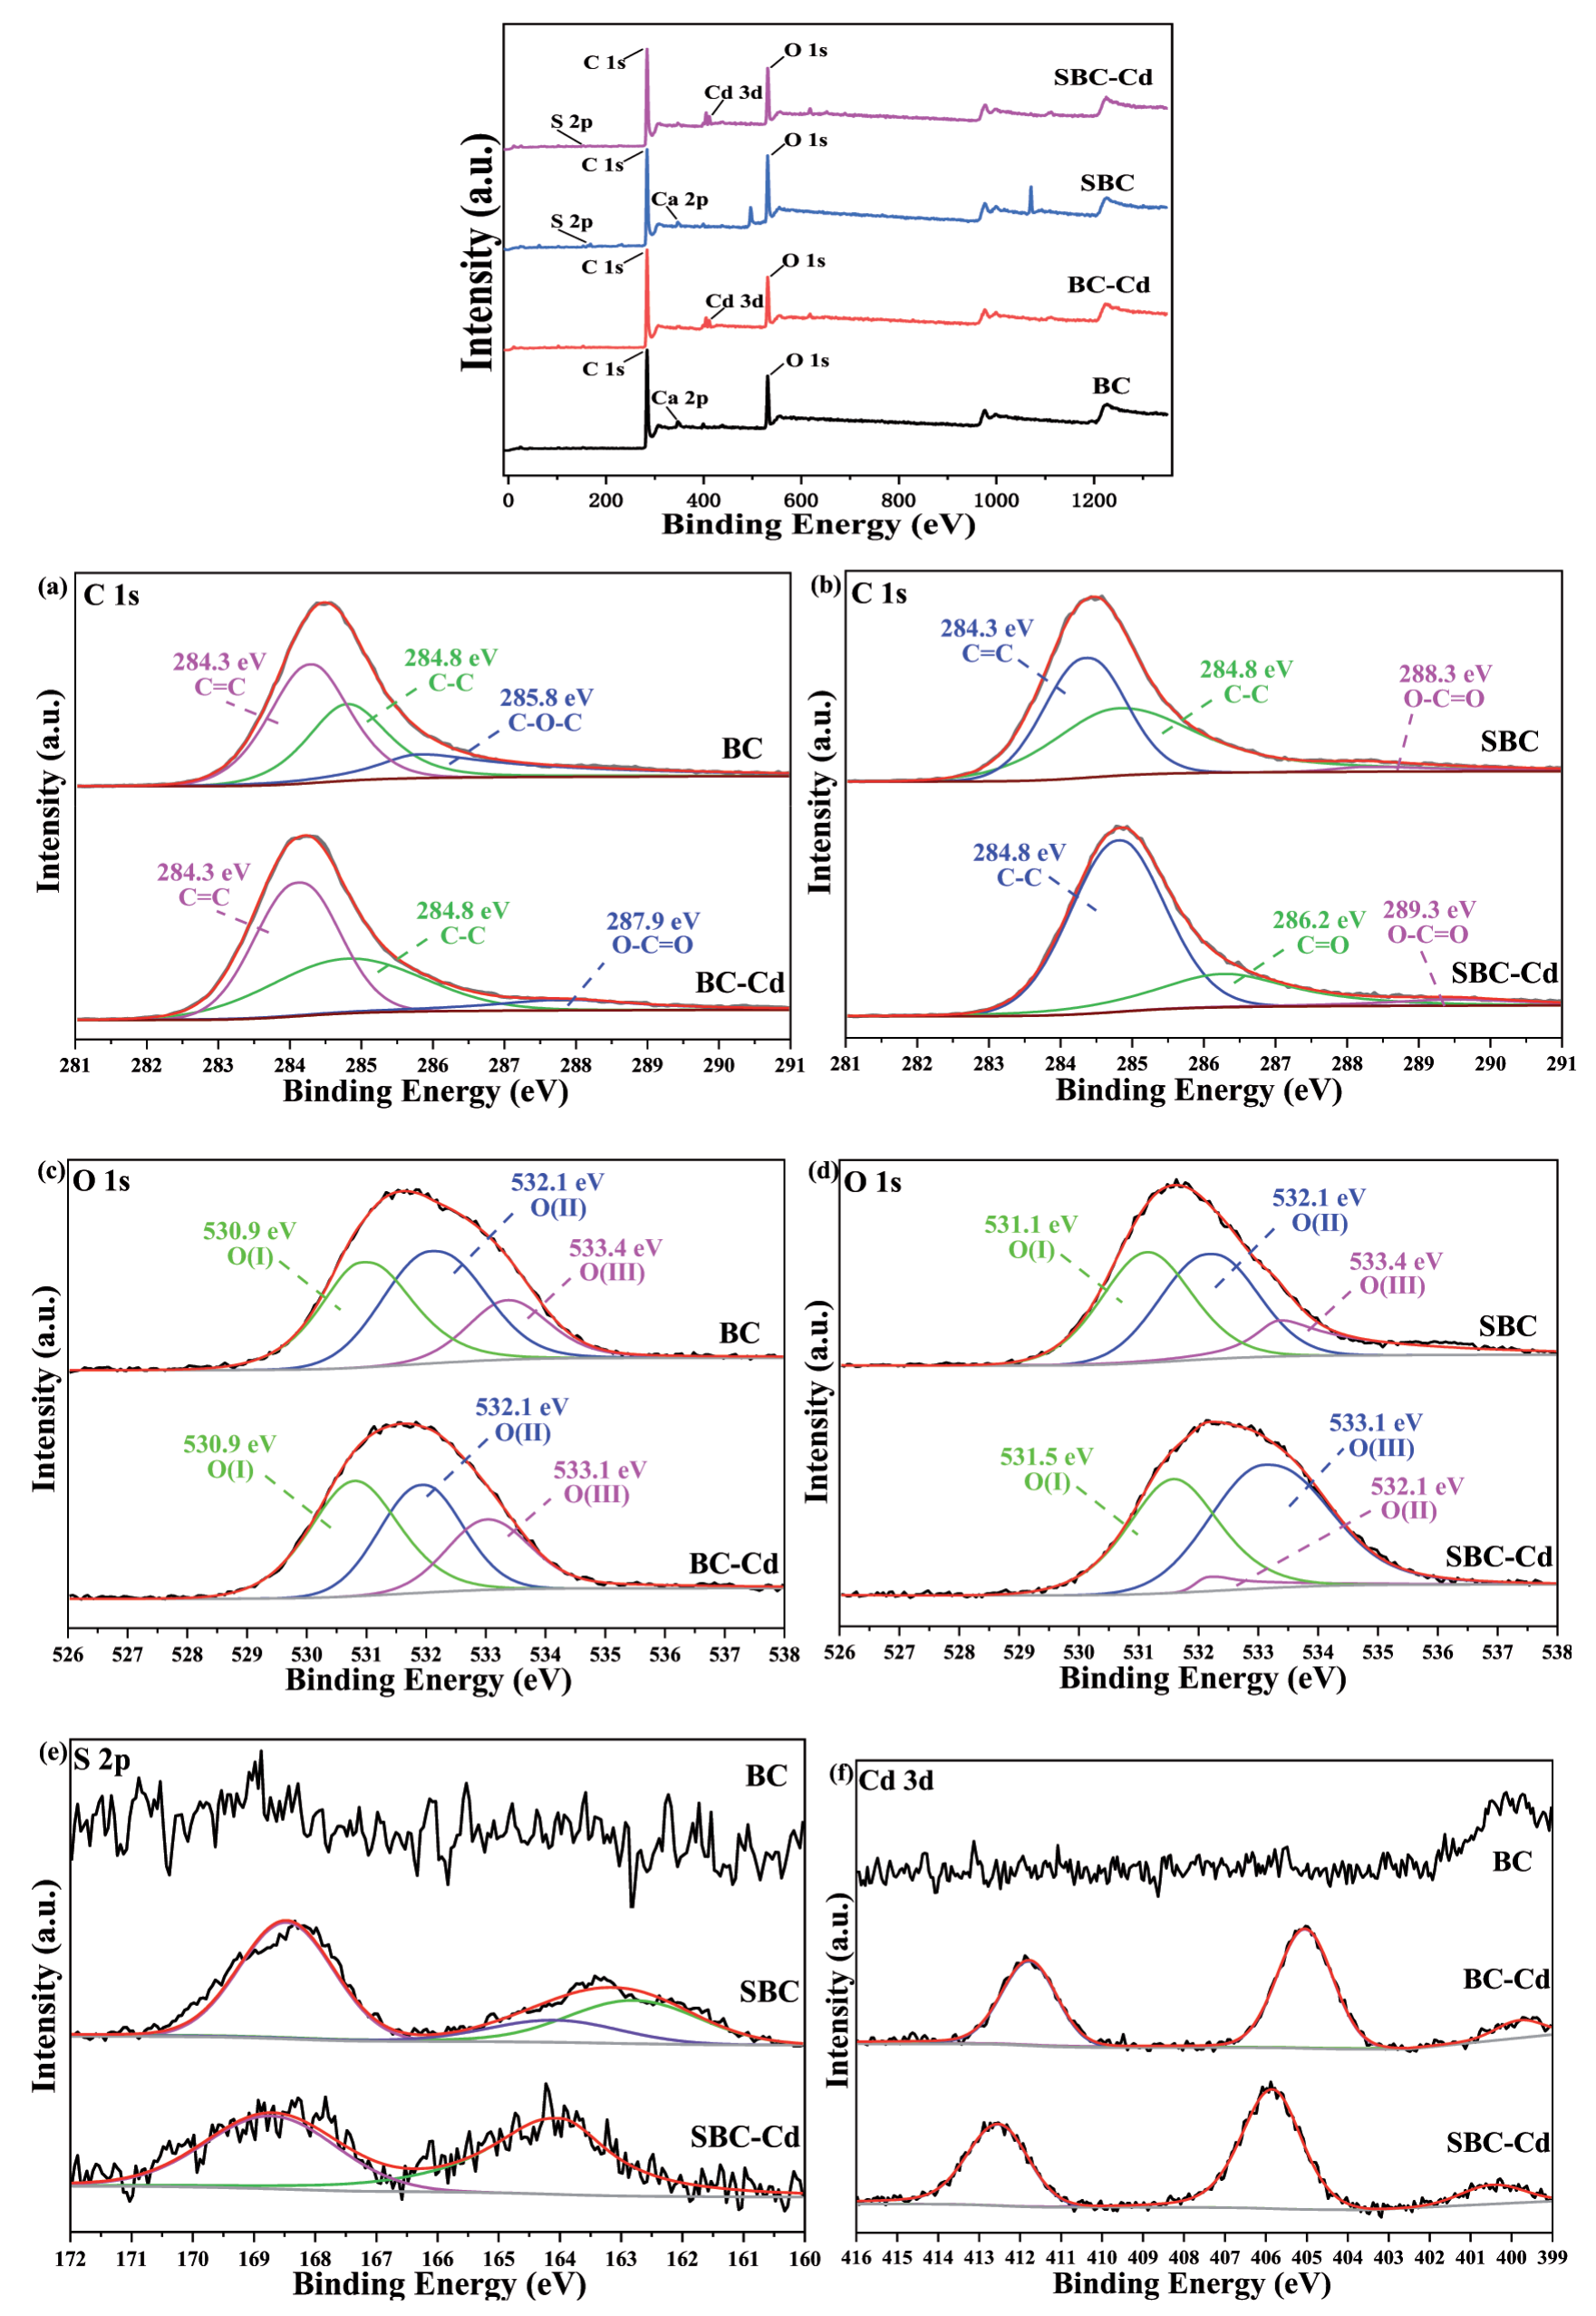
The XPS spectra of S 2p (Fig. 4e) of woody peat showed that the characteristic S peaks before Cd(II) adsorption were 162.8, 164.1 and 168.5 eV, respectively, representing organic sulfides, sulfites, and sulfates, respectively. Park et al. [47] found that S in sulfur-modified biochar mainly existed in the form of sulfur oxide and thiophene sulfur. The S 2p energy spectrum after Cd(II) adsorption only shows two peaks at 163.9 and 168.7 eV, indicating that sulfite reacts with Cd(II) and is consumed during the adsorption process. The relative proportion of sulfate increased from 52.69% to 53.20%, basically unchanged, and the relative proportion of organic sulfide increased from 31.47% to 46.80%. A small amount of Cd(II) in the aqueous solution may also react with sulfates in sulfur-modified woody peat to form sulfates such as CdS or CdSO4, resulting in an increase in the relative proportion of sulfates. During the decomposition of organic matter, oxygen is consumed, sulfate is reduced to sulfide and oxidized Cd dissolves and produces charged metal ions, which react with HS to form metal sulfides. According to the acid-base reaction, the reduced S is more easily coordinated with positively charged metal ions [48]. Kubier et al. [49] also proposed that sulfate and disulfide anions are the most stable complexes of Cd, but the final complexes are related to the concentration of ligands. Under anoxic and sulfide conditions, Cd complexes mainly exist in the form of CdS, CdCO3, CdSO4, CdOHCl, CdHS+, CdOH+, and CdCl+.
The XPS energy spectrum of Cd 3d (Fig. 4f) of BC showed that after the adsorption reaction, the characteristic peaks of Cd 3d5/2 appeared at 405.1 eV and 405.9 eV, accounting for 56.75% of the relative distribution of Cd (II), in which the CdS precipitate produced by the replacement reaction was dominant. In addition, there is a small part of CdCO3 and Cd(OH)2 precipitation, 412.94 eV has the characteristic peak of Cd 3d3/2, representing the relative content of 22.30% in the distribution of Cd(II), indicating that Cd(II) can be complexed with the deprotonated form (-O-) or hydroxide (-OH) on the surface of woody peat [50]. Therefore, the adsorption mechanism of Cd(II) by BC mainly includes the chemical reaction precipitation of CdS, the complexation with oxygen functional groups on the surface of biochar and the physical adsorption of BC.
XRD Analysis
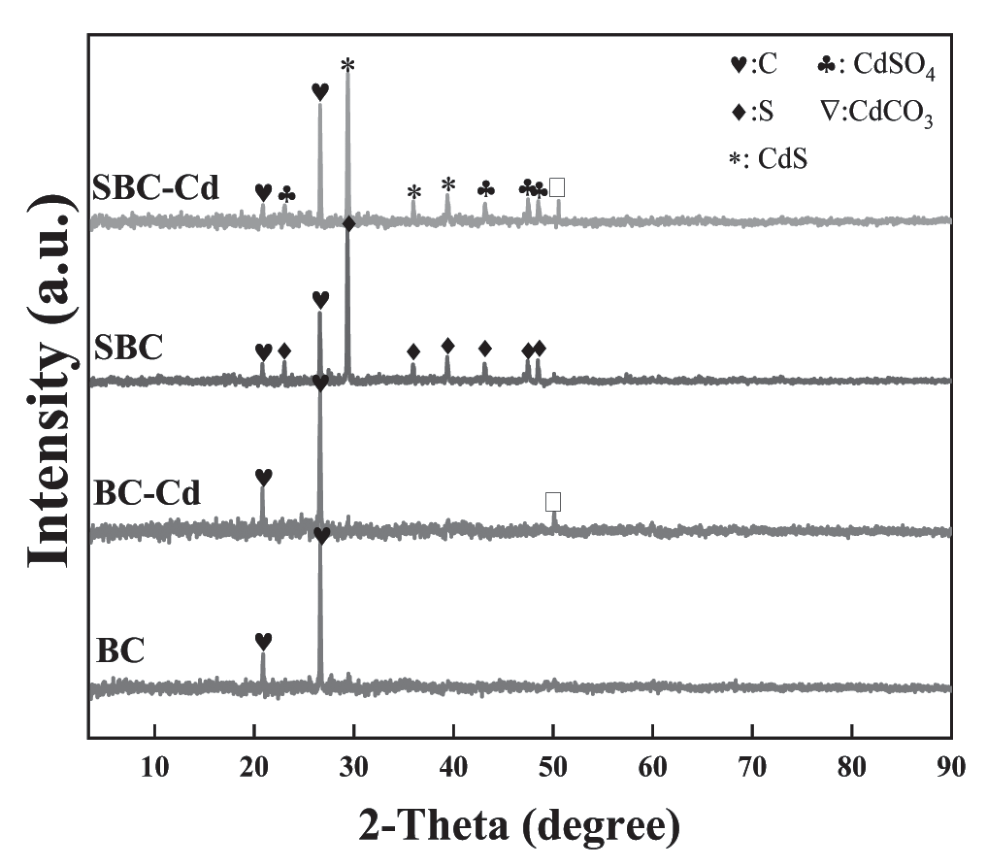
According to the standard card (ICSD 98-061-9760), BC has an amorphous diffusion diffraction peak at 27.89° (Fig. 5), and the amorphous graphite C crystal plane appears according to the standard card comparison. Compared with the standard card (CaCO3: PDF # 83-0577), the diffraction peak crystal plane of CdCO3 appeared at 50.5° in BC-Cd and SBC-Cd, indicating that CdCO3 crystals were precipitated on the surface of the material after adsorption of Cd by BC and SBC. According to the standard card (ICSD 98-004-2550), an S diffraction peak appeared in SBC, indicating that S was loaded on the surface of BC after S modification. Compared with previous studies [51], CdCO3, CdSO4, and CdS diffraction peaks appeared after SBC adsorbed Cd, indicating that SBC adsorbed Cd by precipitation complexation.
Adsorption Kinetics
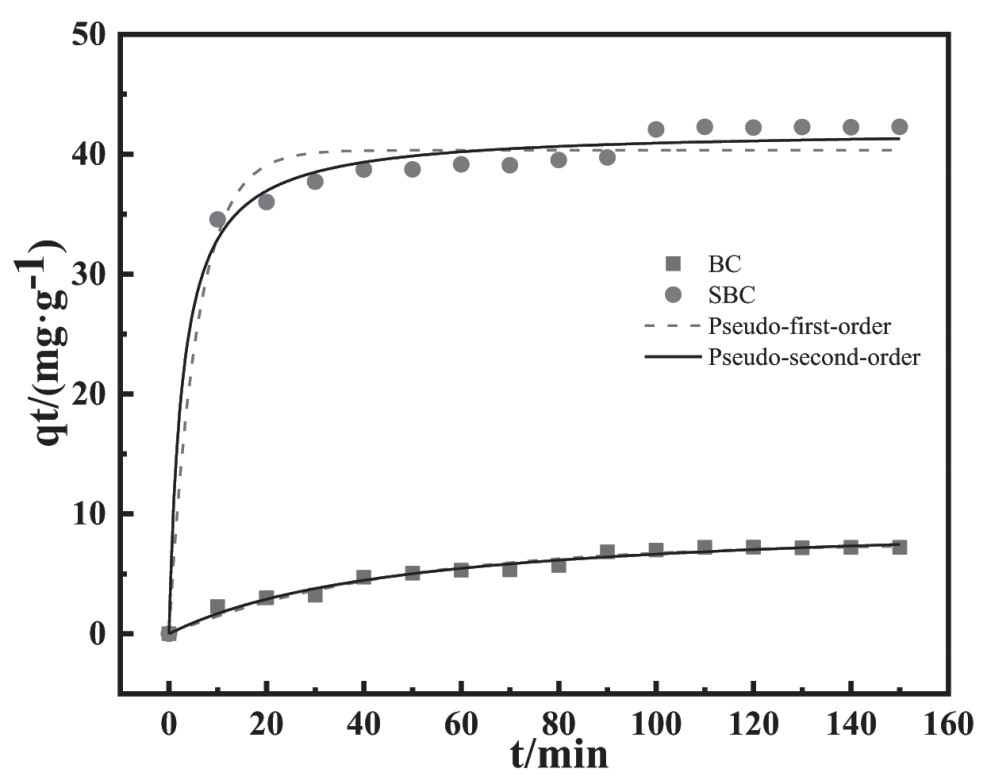
In Fig. 6, when the initial concentration was set to 40 mg/L, the adsorption capacity of BC and SBC increased rapidly in the early stage of adsorption and then increased slowly, reaching adsorption equilibrium after saturation at 90 min and 100 min, respectively. The adsorption capacity of BC and SBC increased rapidly in the early stage of adsorption, which was mainly related to the mass transfer drive of Cd2+ caused by the adsorption sites on the surface and the initial concentration difference between water and biochar [52]. The ability of SBC to adsorb Cd is about 6 times that of BC (Table 2). Since the second-order adsorption kinetic model R2 = 0.973 - 0.987 and the first-order adsorption kinetic model R2 = 0.969 - 0.971, the second-order kinetic model is used to fit the adsorption process of Cd. The second-order kinetic model fitted the adsorption process of Cd better, indicating that the adsorption of Cd by BC and SBC was chemical adsorption [53]. The K2 value of SBC is greater than that of BC, indicating that the adsorption rate of Cd by SBC is faster than that of BC, which also indicates that the specific surface area and the number of adsorption sites on the surface of BC are increased after sulfur modification[54].
Adsorption Isotherm Analysis
To study the adsorption effect of BC and SBC on Cd at different concentrations, Langmuir and Freundlich models were used to fit the adsorption of Cd. The fitting parameters are shown in Table 3. R2 of the two adsorption models are 0.994 - 0.998 and 0.980 - 0.991, respectively, indicating that the Langmuir model is more suitable for the fitting of the Cd isothermal adsorption effect, which indicates that the adsorption process of Cd by the material belongs to monolayer adsorption [55]. The adsorption sites, oxygen-containing functional groups, and elemental sulfur on the surface of SBC materials increased significantly, which significantly improved the adsorption capacity of Cd. When the solution concentration was less than 100 mg/L, the Qe of SBC (99.866 mg/g) was significantly higher than that of BC (41.982 mg/g), indicating that the adsorption capacity of SBC was higher than that of BC.
Effect of the Available Cd Concentration and pH in Soils.
After 30 days of incubation with different amounts of BC and SBC and passivation treatment, the soil pH values were affected to varying degrees (Fig. 8). BC and SBC were put into the soil at 0.5%, 1%, 2%, and 5%, respectively, and the pH showed a significant first rising trend. Compared with CK treatment, after BC treatment, the pH increased by 1.3%, 10.2%, 5.8%, and 6.9%, respectively. After SBC treatment, compared with CK treatment, it increased by 5.3%, 12.5%, 7.9%, and 9.8%, respectively. Among them, after adding 1% SBC, the soil pH increased by 12.5%, and the soil pH was 7.52. This shows that the change in pH is not only related to the addition amount, but also to the material itself. BC and SBC are alkaline materials that are applied to the soil and neutralize the H+ in the soil colloid to reduce the amount of H+ in the soil solution and increase the soil pH. The soil pH gradually increased with the increase in dosage, but when the dosage increased to a certain extent, the increase in soil pH gradually weakened, which may be related to the buffering degree of the soil. In addition, the higher content of sulfur in SBC may lead to soil acidification and salinization. This result is basically consistent with previous studies [56].
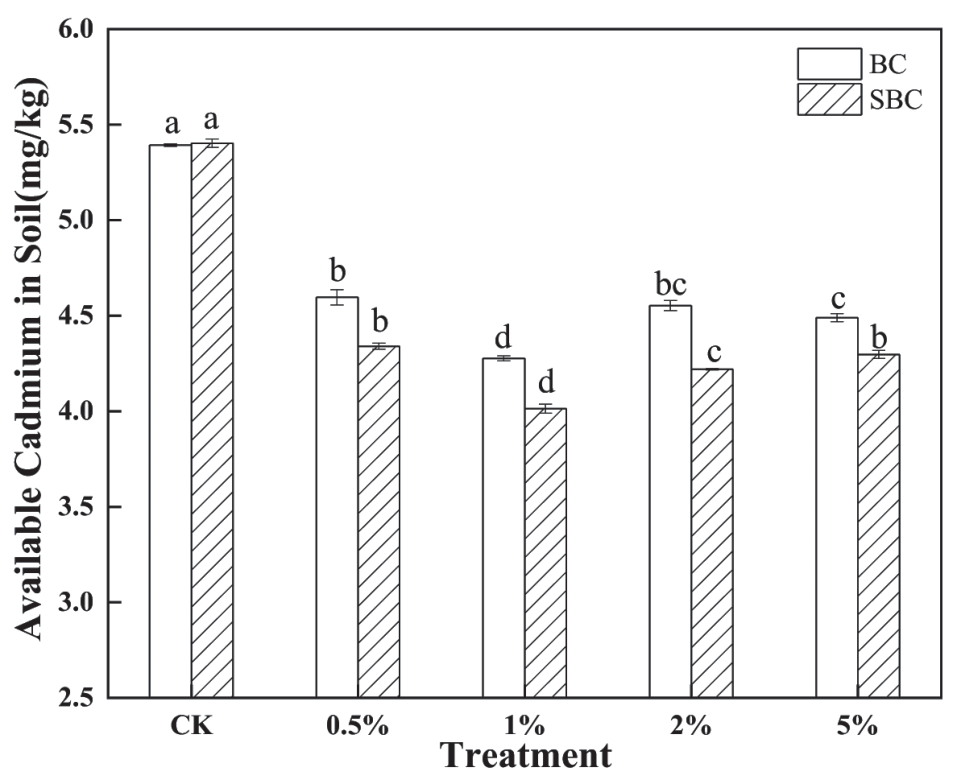
After 30 days of BC and SBC passivation culture, the available Cd content in the soil was affected to varying degrees (Fig. 9). After BC and SBC were applied to the soil at addition amounts of 0.5%, 1%, 2%, and 5% for 30 days, the content of available Cd in the soil showed a trend of decreasing first and then increasing. Compared with CK treatment, the available Cd content decreased by 14.8%, 20.7%, 15.5%, and 20.4%, respectively, after BC treatment. After SBC treatment, the available Cd content in the soil decreased by 19.6%, 25.7%, 21.9%, and 19.7%, respectively. Among them, after 1% SBC treatment, the available Cd content in soil decreased the most, only 4.01 mg/kg, and the difference was significant compared with CK treatment (P < 0.05). In addition, in the same proportion of BC and SBC addition amount treatments, the available Cd content in the soil after SBC treatment was significantly lower than that after BC treatment. This shows that after sulfur modification of BC, the surface functional groups and adsorption mechanism of biochar were changed. When SBC was applied to the soil, the organic sulfur loaded on the surface of biochar chelated, complexed, and coordinated with Cd in the soil, thus forming CdS precipitation and reducing the bioavailability and fluidity of Cd [57]. In addition, studies have shown that metal sulfides reduce the mobility of their heavy metals in soil and are less soluble and less susceptible to oxidation than metal oxides [58]. Previous studies have shown that sulfur reacts with Cd to form CdS precipitates under flooding conditions. Under aerobic conditions, the oxygen in the soil oxidizes the sulfur element into sulfate. When the oxygen in the soil is reduced by other conditions, the sulfate in the soil is reduced to organic sulfur under anaerobic conditions, which reacts with Cd in the soil to form CdS precipitation [59]. In addition, sulfate-active bacteria in soil microorganisms produce hydrogen sulfide through their own physiological mechanisms, change soil Eh, reduce sulfate in soil to sulfide, and increase the adsorption performance of Cd in soil [60].
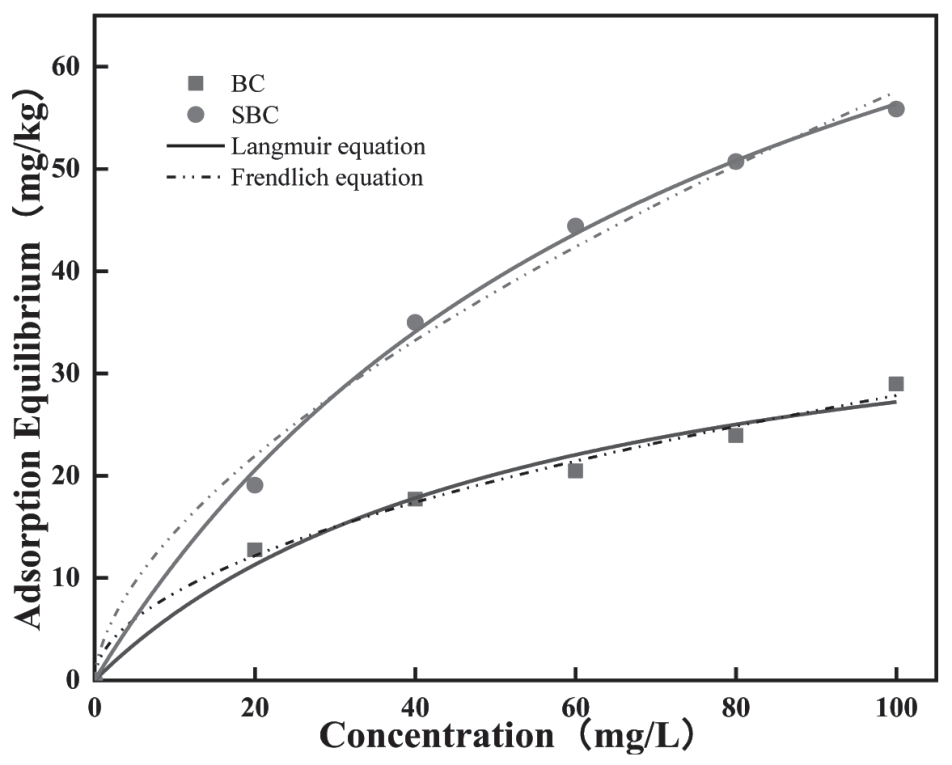
Table 3.
Isotherm fitting parameters for Cd(II) adsorption of BC and SBCa.
| Biochars | Langmuir parameters | Freundlish parameters | ||||
|---|---|---|---|---|---|---|
| R2 | k | Qe | R2 | kf | n | |
| BC | 0.994 | 54.217 | 41.982 | 0.980 | 2.624 | 0.513 |
| SBC | 0.998 | 77.195 | 99.866 | 0.991 | 3.626 | 0.599 |
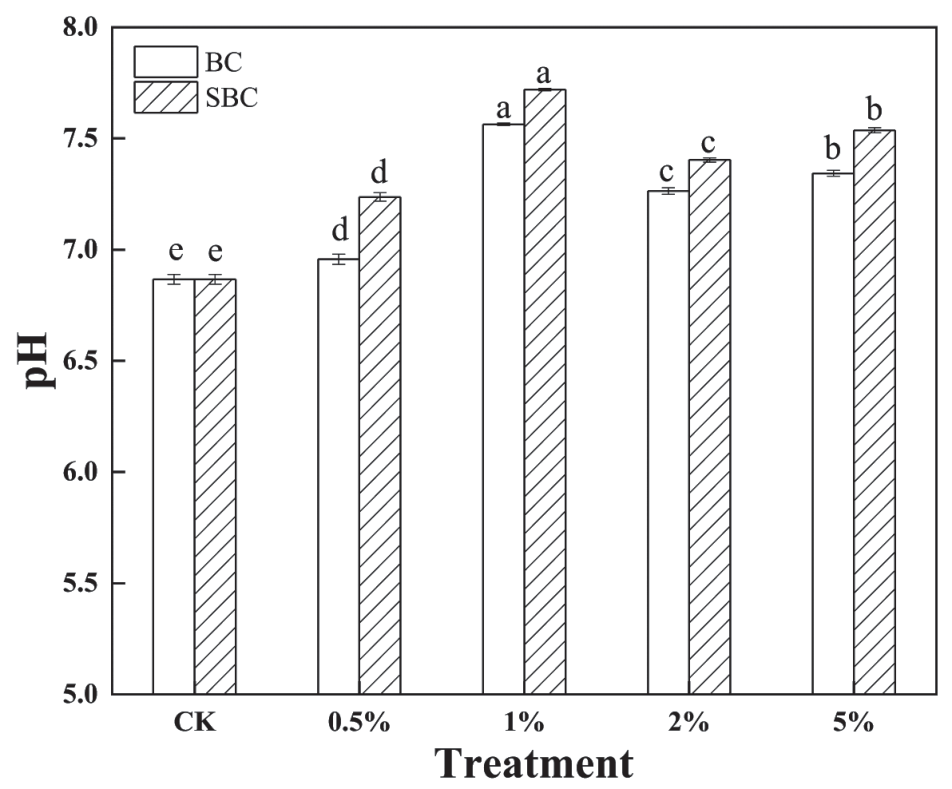
The above results showed that the addition of BC and SBC could not only increase soil pH, but also reduce the available Cd content and biological mobility in soil. Among them, SBC had a better effect on soil pH improvement and the largest decrease in soil available Cd content.
Conclusions
To summarize, sulfur modification significantly increased the specific surface area and pore volume of BC. SEM-EDS diagram analysis indicates successful sulfur loading on BC’s surface, resulting in increased surface particles and rougher crystals. FTIR analysis demonstrates increased functional groups of SBC, which improved its physical and chemical properties and boosted its Cd(II) adsorption performance. XPS and XRD analyses revealed that when Cd is adsorbed, BC primarily forms Cd(OH)2 and CdCO3 precipitates. In contrast, SBC involves interactions between Cd and organic sulfur, resulting in the formation of more stable CdS and CdHS+ that are less prone to dissolution and oxidation. Adsorption kinetics and isotherm analyses suggest that SBC is capable of adsorbing Cd at a rate approximately six times greater than BC. The experiment on soil culture showed that the addition of BC and SBC successfully reduced the available concentration of Cd in the soil. The available Cd level in the soil was significantly reduced to 4.01 mg/kg when 1% SBC was added, which was the most substantial decrease achieved compared to the CK treatment (P < 0.05). Thus, the use of SBC may be more effective than BC in reducing Cd pollution in soil on Cd-contaminated soil.