


Introduction
By 2030, freshwater carp species and Pangas catfish are projected to constitute 62% of global aquaculture production [1]. Pangasianodon hypophthalmus, commonly known as striped catfish, is a precious species in freshwater aquaculture. The production of P. hypophthalmus has demonstrated substantial and consistent growth throughout the years. In 2020, the production figure witnessed a remarkable escalation, attaining a significant milestone of 2.520,4 thousand metric tons. This upward trajectory in fish production indicates a rising demand and highlights the promising economic prospects inherent in aquaculture endeavors [2].
Feed plays a pivotal role in catfish growth, health, and productivity. Feed constitutes the foremost expenditure in aquaculture production, accounting for approximately 40–60% of production costs and the principal waste generator within the system [3, 4]. Proteins represent the most expensive component of feed [5, 6], and this factor significantly impacts the sustainability of aquaculture operations due to its influence on profit margins. Given that feed constitutes the most significant expenditure in fish farming, inefficient utilization of feed proteins results from poor feeding management, low feed digestibility, and inefficient metabolism, thereby not only escalating feed costs but also contributing to deteriorating water quality [7–9].
Residual feed protein, feces rich in high-protein content, and metabolically excreted ammonia constitute waste derived from feed protein [10, 11]. Efforts to improve feed protein efficiency can focus on selecting protein source materials with high digestibility and a balanced composition of essential amino acids [12, 13]. Moreover, equally crucial is ensuring that the protein content in the feed is optimized to meet growth requirements [14, 15]. Low protein levels can lead to detrimental growth, while excessively high levels would be futile as they do not provide additional positive impacts on growth [16, 17] and could also exacerbate environmental pollution. Research on optimizing the protein content in the feed for P. hypopthalmus and several other catfish species has been conducted, with the optimal protein content ranging from 30 to 37% for P. hypopthalmus [18–21] and between 29 and 55% for other catfish species [7, 22–24].
Improving profit margins can be accomplished by optimizing feed protein levels and implementing sustainable environmental technologies, such as zero water exchange (ZWE) systems. ZWE holds the potential to minimize water resource usage, maintain optimal water quality, and reduce the risk of disease transmission [25–29]. Nevertheless, aquaculture employing ZWE methods may result in the buildup of feed waste, feces, and metabolic byproducts within the system [27, 30].
In general, waste management in ZWE systems typically involves the utilization of Recirculating Aquaculture Systems (RAS) or the application of biofloc methods [26, 31]. However, applications of RAS and biofloc methods are sometimes considered expensive and complex. Fortunately, catfish species such as the striped catfish exhibit a high tolerance to ammonia concentrations compared to other fish species [32, 33]. Additionally, striped catfish can adapt to low oxygen conditions by extracting oxygen directly from the air [34, 35]. Cultivation of ZWE systems without RAS installations or biofloc methods has been successfully implemented at striped catfish breeding centers in Sumatra Island, Indonesia.
Applying ZWE without RAS or biofloc methods requires intensive monitoring to ensure that the water quality in the cultivation system remains optimal and that the generated waste does not pollute the environment. One method can be employed by controlling the protein levels in the feed formulation [27]. To date, no research has examined this aspect. Considering the importance of reducing nitrogen waste in ZWE systems, this study tests protein levels in feeds within a low range or below the optimal levels investigated in previous studies. This research aims to test several protein levels in feeds, hoping to provide the best growth for catfish while minimizing the nitrogen waste produced, thus maintaining environmental sustainability in ZWE-based striped catfish cultivation.
Material and Methods
Fish Preparation
The study was conducted at the Jambi Freshwater Aqua culture Center in Indonesia, with the juvenile P. hypophthalmus procured from the establishment above. Prior to the initiation of the research, the juvenile underwent a pretreatment phase encompassing acclimatization within concrete ponds for two weeks. Throughout this acclimatization period, the juvenile was fed a commercial diet boasting 31% crude protein and 6% crude lipid. Following the acclimatization phase, the juvenile underwent a 24-hour fasting period and was ready to use in the experiment.
Experimental Design
The study employed a completely randomized design (CRD) featuring three treatments and three replicates, encompassing varying feed protein levels: 20% (F20), 25% (F25), and 30% (F30) protein content. Subsequently, juvenile fish with an average initial weight of 11.54 ± 0.04 g were stocked uniformly in nine gray concrete ponds measuring 6 m × 2.5 m × 1.0 m, with a stocking density of 400 juveniles per pond and reared for 84 days.
Throughout the research duration, the fish were cultivated within a closed system characterized by zero water exchange, devoid of any water renewal. Supplementary water was added to the system to balance out the water loss due to evaporation. The juvenile fish were nourished twice daily at 8 am and 4 pm, with a feeding rate of 5% of the total daily biomass. This feeding was administered manually, ensuring the thorough digestion of feed by the fish. The proximate composition analysis of the employed commercial feeds is presented in Table 1.
Water Quality and Fish Sampling
The water quality parameters including, pH, dissolved oxygen, and temperature, were recorded daily using a multi-parameter analyzer (Hanna HI9829). At intervals of 7 days, measurements of ammonia, nitrite, nitrate, and phosphorus levels in the water were conducted, followed by subsequent analyses employing the APHA method [36].
Proximate fish samples were collected on both day zero (comprising 6 fish) and on the 84th day of the study (encompassing 6 fish from each pond). The fish’s weight was logged at 15-day intervals. The survival rates of the juvenile were recorded at the end of the experimental period.
Laboratory Analysis
Commencing the study, anesthetized lethal doses with MS 222 [37] were administered to six fish from the initial tank and pooled for proximate analysis. Concluding the research, six fish were sampled from each pond for proximate analysis, subsequently pooled, and stored at −20°C for further analysis.
Table 1.
Fish feed proximate composition, juvenile fish proximate composition, and juvenile fish hepatosomatic index result from all experiments.
Chemical analyses of both feed and fish adhered to the AOAC method [38]. Water content was determined through sample drying in a 105°C oven until constant weight was achieved. Incinerating samples in a muffle furnace measured ash content at 450°C for 24 hours. The Kjeldahl method was employed for crude protein analysis, involving digestion and distillation units, while lipid content was ascertained through petroleum ether extraction using a soxhlet apparatus.
Production Performance and Nutrient Utilization Observation
The observed parameters for assessing fish production performance and nutrient utilization in this study encompassed the specific growth rate (SGR), weight gain (WG), total feed consumption (TFC), feed conversion ratio (FCR), survival rate (SR), protein retention (PR), and lipid retention (LR). The formulas employed to calculate these parameters were performed as follows:
The specific growth rate (SGR) is expressed in % day-1.
The weight gain (WG) is expressed in g fish-1. IW is the average initial weight of the fish, recorded on day 1, FW represents the average weight recorded at the conclusion of the experimental trial, and T is the study period (days).
The total feed consumption value is based on the daily feeding records accumulated during the study.
FP stands for the final protein content of the fish’s whole body, IP denotes the initial protein content of the entire fish’s body, and P intake represents the quantity of protein within the total feed ingested by the fish. In the provided equation, FL represents the final lipid content of the fish’s entire body, IL signifies the initial lipid content of the fish’s whole body, and L intake quantifies the lipid content within the total feed ingested by the fish.
Table 2.
Production performance and Nutrient utilization of P. hypophthalmus on Varied Levels of Protein Diets.
Data Analysis
The data were analyzed using one-way ANOVA through the JMP® 8 software package (SAS Institute Inc., 2009). A significance level of 0.05 was adopted for null hypothesis rejection. When significant disparities were identified, Tukey’s multiple range test was subsequently employed to ascertain the distinctions between means. The production performance, nutrient utilization, and water quality data were subjected to statistical analysis.
Results and Discussion
Fish Production Performance and Nutrient Utilization
The results of juvenile production performance and nutrient utilization after the study period are detailed in Table 2. Scientific literature extensively confirms that dietary protein levels substantially influence growth parameters, including final weight, weight gain, and SGR in numerous fish species [39]. Elevating dietary protein levels is frequently associated with enhanced growth performance [21, 22, 40]. An optimal dietary protein level is imperative to furnish the requisite amino acids for maximal growth. Nevertheless, continued growth becomes untenable beyond a certain protein threshold and may even decline. Notably, it is extensively documented that growth parameters rise in parallel with escalating dietary protein levels until an optimum point, beyond which they decline [21, 41, 44].
The growth depression observed at elevated protein levels could be attributed to the insufficiency of non-protein energy needed for the deamination and excretion of excess ingested amino acids, possibly resulting in a diminished energy allocation for growth [21, 41]. An alternate hypothesis suggests that the body’s accumulation of free amino acids might become detrimental at excessive dietary protein levels, hampering growth and normal metabolic processes [21, 40, 44–46].
In this study, the final weight, weight gain, and SGR of P. hypophthalmus exhibited a significant increment with the augmentation of dietary protein levels from F20 to F30 treatment. The result indicates that the highest protein level treatment provided in this study (F30) showed the best production performance for striped catfish in a zero water exchange (ZWE) culture system. This observation underscores that the growth of P. hypophthalmus was influenced by the dietary protein level. This pattern aligns with investigations conducted on European grayling Thymallus thymallus [47] and striped catfish Pangasianodon hypophthalmus [21]. Where growth parameters witnessed a substantial increase up to the optimal point as dietary protein levels were elevated, followed by a plateauing effect at higher protein levels.
Likewise, a corresponding absence of enhancement in the growth performance of P. hypophthalmus was noted when isolipid diets (5%) were administered, and the dietary protein content was escalated from 34%, 38%, and 42% to 46% [19]. Conversely, a notable growth increase was observed in P. hypophthalmus-fed isolipid diets (6%) with 30% to 40% dietary protein content [18]. Notably, in the present study, no marked decline in growth parameters was evident at higher dietary protein levels, likely since the evaluated dietary protein levels remained within a range below excessive impact.
The feed conversion ratio (FCR) enhancement was demonstrated alongside the feed protein content elevation in this study, with the F30 group displaying the lowest FCR. The lowest FCR value reflects the highest feed conversion efficiency in achieving optimal fish weight gain. Numerous studies have reported an elevation in FCR as dietary protein content rises, followed by an eventual increase or deterioration beyond a certain protein threshold [41]. However, in this study, no discernible trend of FCR elevation was observed; this could be attributed to the low level of protein content within the feed, which cannot express the attainment of maximum response. This observation also implies that subsequent experiments encompassing protein content beyond the 30% threshold are necessary.
In this study, the protein efficiency ratio (PER) and protein retention (PR) values declined with increasing dietary protein levels. However, the PER and PR of the fish fed F20 were notably higher than those of F30, though not significantly different from those of F25. These findings align with research conducted on many fish species, including European grayling [47], yellow catfish [48], and red-spotted grouper Epinephelus akaara [49], which also result in declining PER and PR value as the protein content of the feed increases.
Dietary formulations with lower protein content commonly enhance utilization when contrasted with higher protein content feed [47], leading to PER and PR values on less protein content being relatively augmented. It is well established that fish cannot synthesize surplus protein from excessive dietary protein but utilize it as an energy source, which may lead to a decline in protein efficiency ratio (PER) at elevated dietary protein levels [21, 47].
This study observed an elevation in whole-body protein content as the dietary protein levels increased; the corresponding data are delineated in Table 1. These findings concur with outcomes documented for various species, including bullseye snakehead Channa marulius [50], Sebastes schlegeli [51], Thymallus thymallus [47], and Pangasionodon hypophthalmus [18, 21].
Table 1 presented fish’s whole-body crude protein content, which exhibited a trend of incremental growth in proportion to the dietary protein levels, progressing from F20 to F25 treatment. However, it reached a plateau after that and displayed a declining tendency during the F30 treatment. Furthermore, the F20 treatment showcased the lowest whole-body protein content. This study’s observed plateauing pattern at higher dietary protein levels suggests that the protein requirement for P. hypophthalmus was sufficient and that any surplus dietary protein is not utilized for body protein synthesis. A comparable pattern of responses has been evidenced in other species, such as Ide Leuciscus idus [39], Atlantic salmon Salmo salar [52], Black Sea Bream Acanthopagrus schlegelii [53], abalone Haliotis discus hannai [54], and pufferfish Takifugu sp. [55]. In these cases, the whole-body protein content plateauing phenomenon is observed upon surpassing the optimal dietary protein range. Likewise, augmenting dietary protein beyond the optimal requirement does not further enhance growth and overall bodily performance.
The dietary protein levels had no significant effect on the whole-body lipid composition of fish in the experimental diets, as indicated by the data presented in Table 1. This finding aligns with similar observations in Grouper [56] and Silago sihama [57]. Conversely, contrasting findings have been found in Spinibarbus hollandi, grouper Epinephelus coioides, Nile tilapia Oreochromis niloticus, Obscure puffer Takifugu obscurus, Ide Leuciscus idus, and bullseye snakehead Channa marulius. In these cases, an increase in dietary protein levels corresponds to a reduction in whole-body lipid content [39, 50].
In this study, no significant differences in Hepatosomatic Index (HSI) values were observed among treatments. Our study diverges from findings in Ide Leuciscus idus and red swamp crayfish Procambarus clarkii, where a correlation between decreasing HSI values and increasing dietary protein levels was established [39, 44].
Another study found that the decline in whole-body lipid content and HSI could be attributed to lower dietary carbohydrates (starch or dextrin) as dietary protein levels increased, aiming to create isoenergetic diets [39]. Carbohydrates can be readily converted into lipids and glycogen, subsequently stored in the liver [42, 43]. The augmentation of water content linked to glycogen accumulation within the liver contributes to an elevated HSI value [39]. Moreover, carbohydrates can undergo conversion to lipids and be stored in adipose tissues [58, 59], potentially leading to an elevation in whole-body lipid content in fish. In the case of S. hollandi, lipids stemming from dietary carbohydrates predominantly accumulate in the liver, perivisceral adipose tissue, and carcass [60, 61]. Furthermore, higher HSI, elevated whole-body lipid content, or a combination of both have been noted in response to low protein or high carbohydrate diets [44, 62, 63].
Moreover, a similar pattern has been observed in Nibea miichthioides, where elevating dietary lipid levels have been found to correspond with heightened body lipid content, consistent with the studies conducted on P. hypophthalmus [19], tilapia [64] and Cyclopterus lumpus [65].
Furthermore, increased dietary lipid and carbohydrate content has been linked to lipid deposition in the body of P. hypophthalmus [19]. No significant differences were found in HSI and body lipid content in this study; this could be attributed to the variation in dietary lipid (4.97 – 6.06%) and carbohydrate (presented as NFE 40.43 – 53.62%) content across the tested diets, which likely remained below the threshold needed to impact HSI and whole-body lipid content of P. hypophthalmus juveniles.
Based on the growth data and FCR, among the three dietary protein treatments (which were accompanied by lipid levels ranging from 4.97% to 6.06%), it becomes apparent that F30 provided the best and most efficient performance. Notably, the protein content value in this study is comparatively lower than that observed in prior research concerning the same fish species. Earlier investigations have established that a 12% lipid content in the feed corresponds to an optimal protein requirement of 30% for fish growth [18]. Furthermore, analogous findings emerge from other P. hypophthalmus studies, reaffirming that an optimal protein requirement of 45% is essential when the feed’s lipid content is 9% [19]. The latest studies reported the optimal protein requirements for P. hypophthalmus were 30%, 35%, and 37,1% [21, 66]. The divergence in feed lipid content between this study and the two preceding investigations likely contributes to the variability in the necessary optimal protein levels. Furthermore, the spectrum of applied protein content in this study remains beneath the optimal protein requirement for striped catfish reported in previous studies. Nevertheless, the F30 treatment in our study demonstrated the best performance. This notion is supported by optimal growth performance data (final weight, weight gain, and SGR) and feed performance (FCR).
Compared to other catfish species, the dietary protein requirement for juvenile fish established in this study is generally lower than the requirements observed for Rhamdia quelen (34%) [23], African catfish Clarias gariepinus (35–40%) [7], Clarias magur (55%) [67], and stinging catfish Heteropneustes fossilis (40–41%) [24]. Variations in the optimal dietary protein requirement observed within the catfish across these studies might be attributed to differences in feed formulation, environmental conditions, applied methodologies, stocking sizes, age classes, and species. [22, 64].
Previous research findings show that the optimal protein requirement range for striped catfish and other catfish species falls within the range of 30–40%. However, the results of this study indicate that a protein content of 30% is already capable of delivering the best performance in terms of specific growth rate (SGR), survival rate (SR), and the lowest feed conversion ratio (FCR). It is important to note that previous studies did not use the ZWE culture method. Therefore, using dietary protein levels above 30% would not significantly impact water quality, as water exchange is routinely performed in those previous studies (e.g., flow-through systems).
Water quality substantially impacts the growth, development, survival, physiology, and reproduction of fish. Deterioration in water quality parameters and escalating contamination present formidable obstacles to the efficiency and sustainability of aquaculture systems [28, 68, 69].
Water Quality Parameters
The water quality examination outcomes throughout the study are exhibited in Fig. 1. This study’s ammonia, nitrite, and nitrate concentrations exhibited variations between 0.01–1.00, 0.04–0.37, and 0.01–0.30 mgL-1. The cultivation of P. hypophthalmus exhibits a sufficiently high tolerance to ammonia levels, reaching up to 1.07 mgL-1 [70]. The established guidelines advise nitrite and nitrate levels below 50.00 and 100.00 mgL-1 [71].
The dissolved oxygen (DO) concentrations and temperature were noted throughout the study to be 2.67–4.58 mg L-1 and 22.8–26.7°C, respectively. Notably, P. hypophthalmus exhibited remarkable resilience to reduced dissolved oxygen levels, enduring concentrations as low as 0.05 mgL-1. The observed pH and phosphorus concentration values spanned from 6.95–7.23 and 0.03– 0.24 mgL-1. The recommended pH range lies within 6.50– 8.50 [72], while the suggested phosphorus concentration for catfish is less than 1.5 mgL-1 [73]. Overall, the water quality conditions within the cultivation pond align with the requisites for sustaining aquaculture.
The nitrogen content in fish feed can originate from various sources, primarily protein. Protein is a pivotal constituent within fish feed, embodying nitrogen in amino acids [74]. Amino acids serve as the fundamental building blocks of proteins and encompass nitrogen atoms. Conventional commercial fish feeds commonly encompass protein sources such as fishmeal, soybean meal [75, 76], rapeseed meal [77, 78], meat and bone meals [5, 79], and other plant-based materials. Each component bears distinct nitrogen content contingent upon its nutritional composition and protein concentration.
During fish digestion, the protein in feed undergoes enzymatic breakdown into amino acids. Subsequently, fish’s intestines absorb these amino acids and utilize them to synthesize body proteins, growth, and other vital functions. Furthermore, amino acid metabolism liberates nitrogen in the form of ammonia as a byproduct. Over the cultivation period, poorly managed organic waste, such as unconsumed feed and feces, contributes to elevated ammonia levels in the aquatic environment.
The decomposition of organic matter by bacteria and microorganisms into ammonia compounds is recognized as the process of ammonification [80]. Within this process, microorganisms affect the hydrolysis of large feed and fecal molecules into more minor constituents. Consequently, the organic nitrogen within these molecules is transformed into ammonia through deamination by microorganisms. The resulting ammonia is subsequently released into the water as dissolved free ammonia. The higher protein content in the F30 treatment is the underlying factor contributing to the elevated concentration of produced ammonia compared to the other treatments.
An elevated ammonia concentration within aquatic environments can enhance augmented nitrite and nitrate levels. The F30 treatment also tends to yield higher nitrite and nitrate concentrations throughout the research. This phenomenon is attributed to the biological processes inherent in the nitrogen cycle. Ammonia, characterized as a nitrogenous compound, undergoes nitrification [81, 82], a transformative sequence facilitated by nitrifying microorganisms such as Nitrosomonas [71]. During this process, ammonia is initially converted into nitrite. Subsequently, nitrite is subjected to further oxidation, forming nitrate, under the influence of alternative nitrifying bacterial agents like Nitrobacter [71].
Nitrite and nitrate are nitrogen compounds integral to the nitrogen cycle’s dynamics. Consequently, a surplus accumulation of ammonia within aquatic realms potentially precipitates heightened nitrite and nitrate production via these microbial transformations, thereby exerting ramifications on the comprehensive quality of water and the equilibrium of the aquatic ecosystem.
Fig. 1.
Water quality conditions during the study: feed with a protein content of 20% (F20), feed with a protein content of 25% (F25), and feed with a protein content of 30% (F30). The use of distinct lowercase letters in the graph indicates a significant difference (p <0.05).
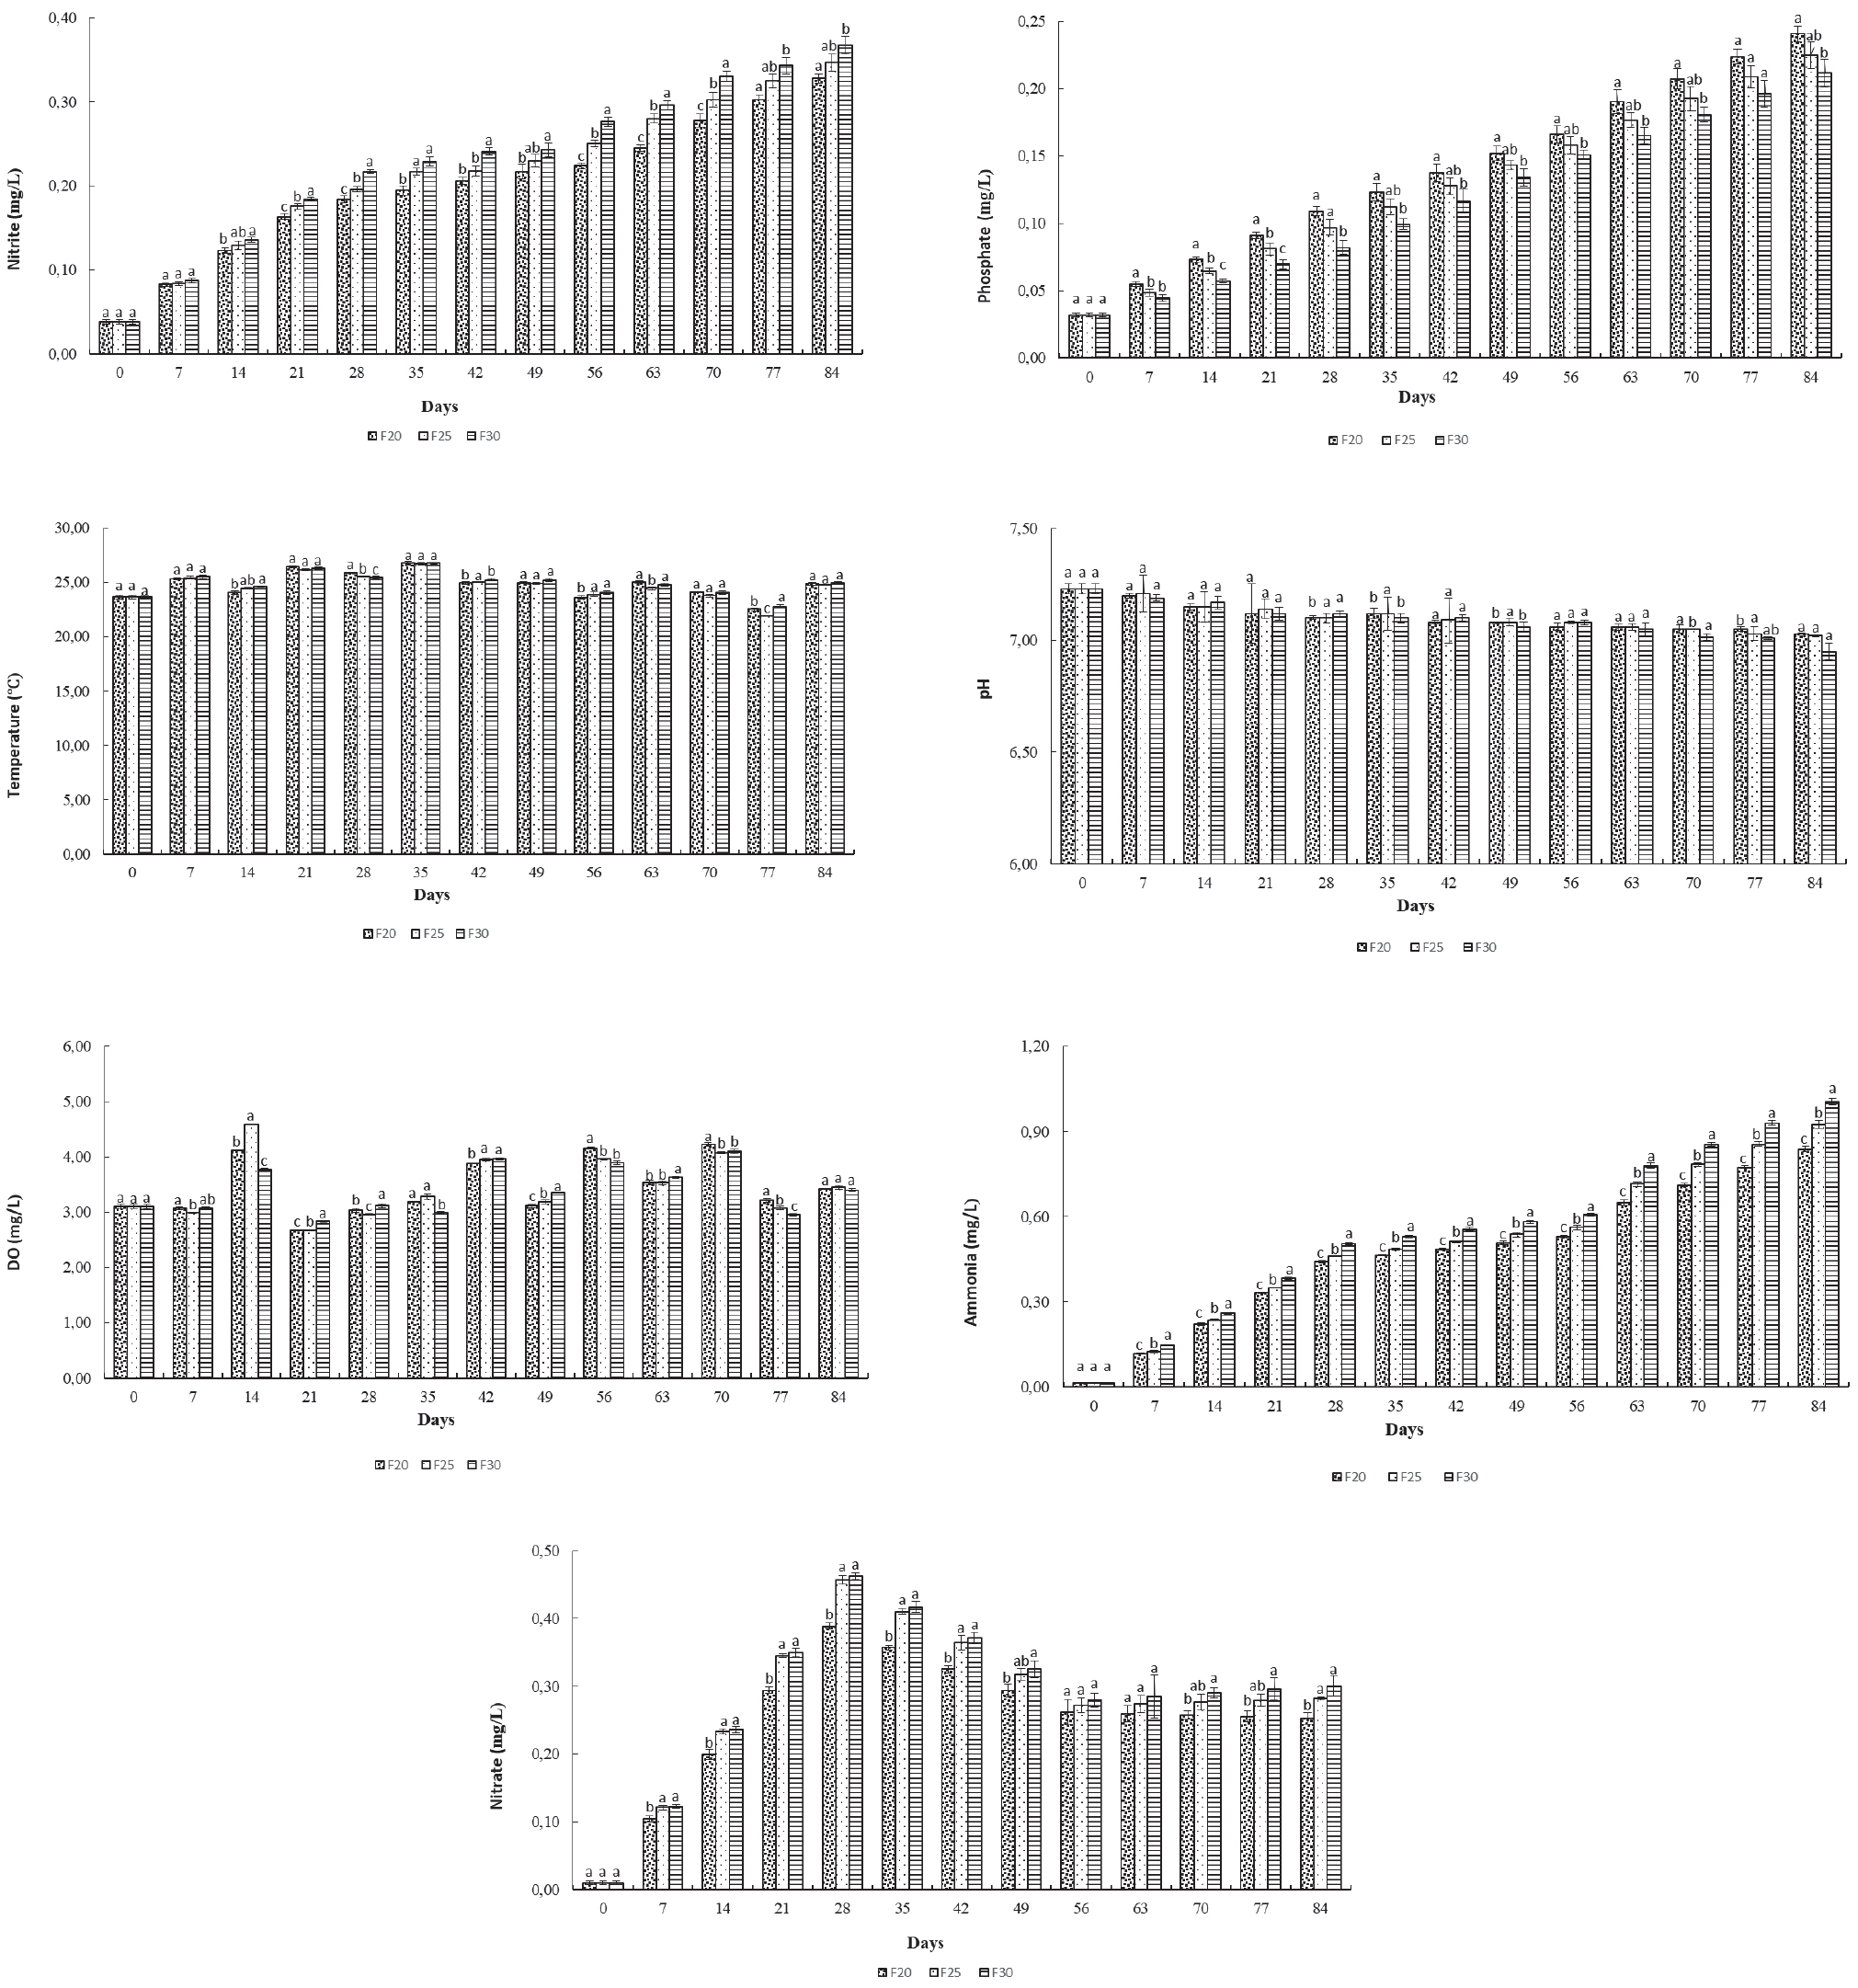
Based on Fig. 1, an increase in the protein content of the feed utilized during the study results in a lower phosphorus concentration. This phenomenon can be attributed to various factors, including the efficiency of phosphorus digestion and absorption by the fish. Higher protein content in fish feed is typically associated with better amino acid profiles and enhanced digestibility for fish. During digestion, the phosphorus within the protein can be more effectively absorbed and utilized by the fish’s body.
Furthermore, fish feed containing elevated protein content tends to exhibit a more balanced phosphorus-to-protein ratio; this implies that the phosphorus content within such feed is more concentrated and less excessive than its protein content. With this balanced ratio, the available phosphorus within the fish feed can be utilized more efficiently by the fish’s body, resulting in decreased phosphorus excretion into the water. This assertion is bolstered by further studies indicating that the utilization of feed with a protein content of 40% in the cultivation of L. vannamei shrimp yields a diminished phosphorus concentration compared to the use of feeds with protein contents of 30% and 35% [83].
The decline in pH levels observed during the study period is attributed to several contributing factors. One of the primary contributing factors is carbon dioxide (CO2) production through various metabolic activities of fish, encompassing respiration and excretion. During respiration, fish release CO2 into the water, which dissolves, forming carbonic acid (H2CO3) [84]. Furthermore, the breakdown of organic substances, such as unconsumed food remnants and fish waste, by alternative bacteria and microorganisms releases CO2 and organic acids into the aquatic environment. Furthermore, nitrification, encompassing the conversion of ammonia to nitrite and subsequently to nitrate by nitrifying bacteria, can also reduce pH levels. This phenomenon arises from the nitrification process yielding protons (H+) as byproducts, contributing to an overall increase in water acidity [84].
Conclusions
The study’s results indicate that the F30 treatment outperformed others in production performance, with a specific growth rate of 2.81 ± 0.08% day-1 and a survival rate of 99.83 ± 0.29%. Moreover, F30 yielded the highest outcomes for the Feed Conversion Ratio (FCR), achieving values of 1.75 ± 0.11. Lower protein content in feed led to improved water quality. Even when using F30 feed, the water quality consistently met acceptable standards for cultivating P. hypophthalmus juveniles.

