Introduction
Depression, which has been ranked as an important cause of disability globally, is a common psychological disorder that affects physical and mental health [1]. A study demonstrated a high incidence rate that the estimated prevalence of outpatients with depression or depressive symptoms was about 27.0% [2]. Another study revealed that the prevalence of depression in patients with different types of cancer ranged from 3% to 31% [3]. About 3% to 4% of children and adolescents with depression will die from suicide [4]. The global burden of depression has increased significantly from 1990 to 2017 as the number of incident cases of depression in the world increased by 49.86% [5]. Chronic recurrence of depression is difficult to avoid, and the treatment effect of patients with depression is not satisfactory [6, 7]. Exploring the risk factors related to depression is very important for the prevention of depression.
Particulate matter 2.5 (PM2.5) has been defined as fine particulate matter (PM) with a diameter <2.5 µm. It is well known that ambient PM2.5 poses hazards to physical health such as respiratory system disease and circulation system disease [8-10]. Researchers' interest in the correlation between exposure to PM2.5 and mental health is gradually increasing. A cohort study proved the association between exposure to PM2.5 and depression [11]. Another cohort study found no consistent evidence about this issue [12]. Two systematic reviews of human observational studies indicated that an increased risk of depression was related to exposure to PM2.5 [13, 14]. Achieving causal inference between PM 2.5 exposure and the risk of depression is difficult in traditional observational studies such as cross-sectional studies [15].
The alleles of genetic variants (GV) have been proven to be randomly allocated and not affected by reverse causation [16]. By using these additional genetic variants as instrumental variables (IVs) for the exposure of risk factors, Mendelian randomization (MR) provides a new method for causal inference in human epidemiological studies [17]. Consequently, the aim of this two-sample MR (TSMR) study was to complete the causal inference for the effect of exposure to PM2.5 on the risk of depression through the Genome-Wide Association Study (GWAS) database.
Materials and Methods
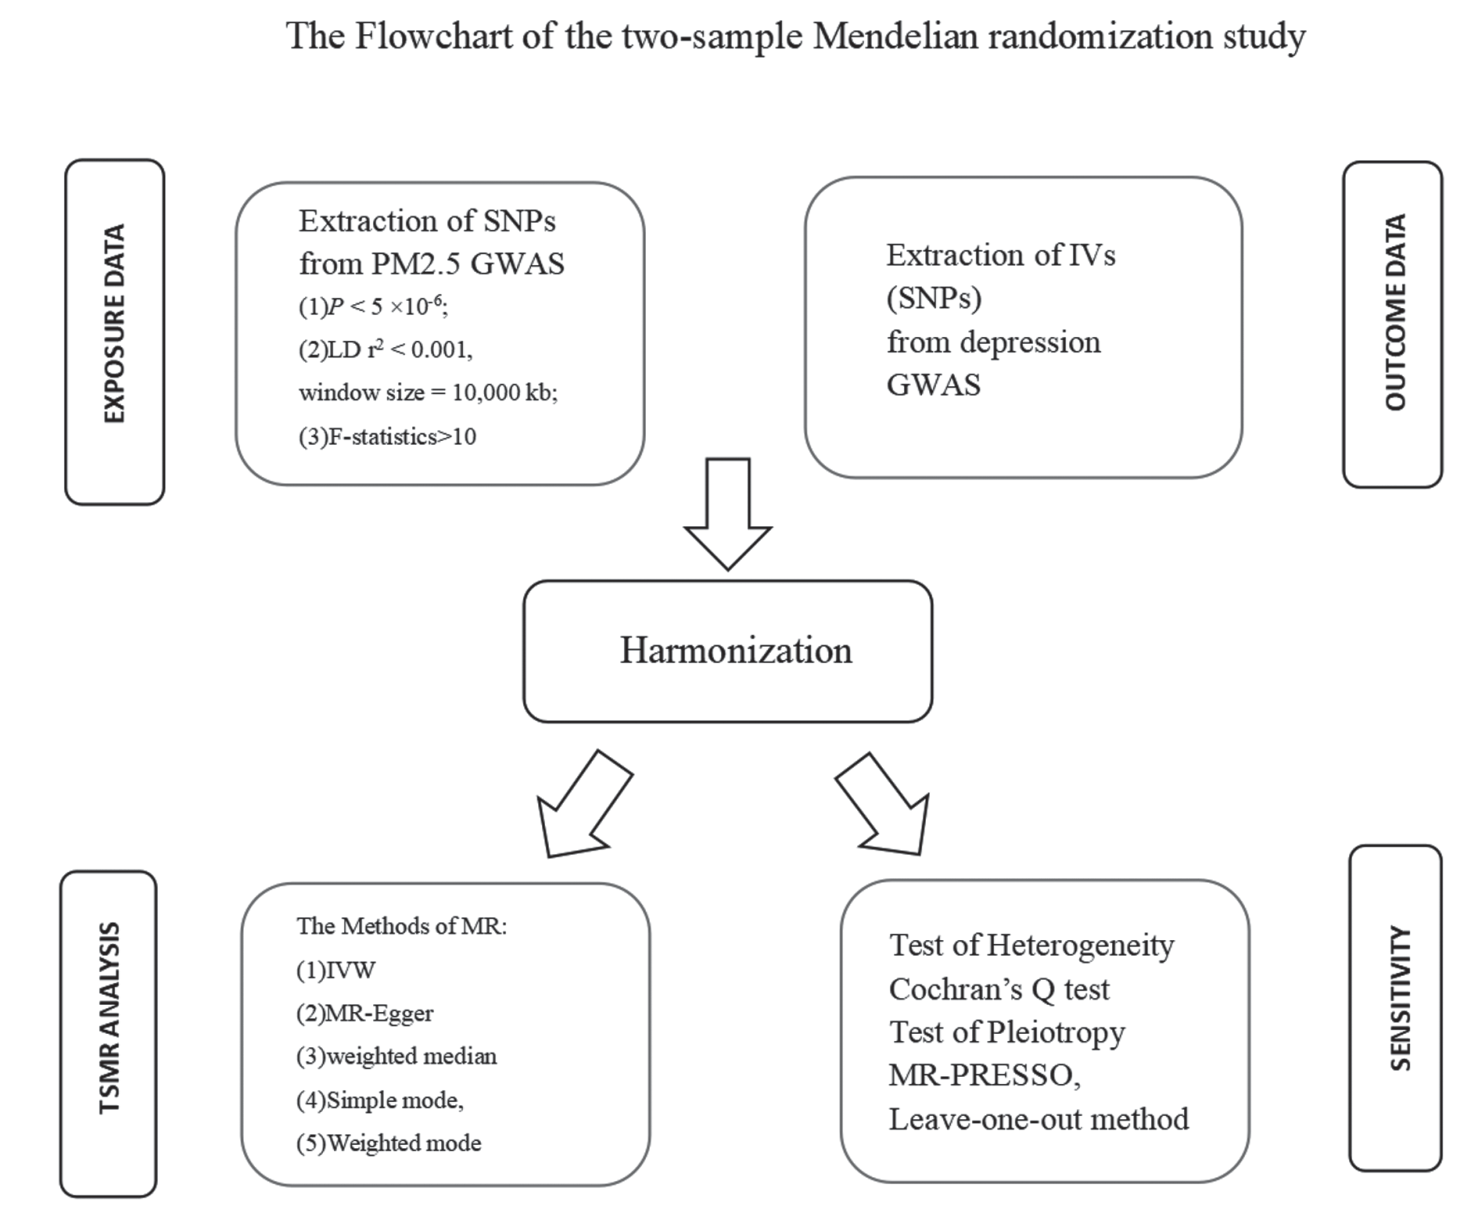
The flowchart of the TSMR study evaluating the relationship between exposure to PM2.5 and the risk of depression has been shown in Fig. 1. Ethics approval was not necessary for the reason that GWAS summary data used in our study were acquired from a public database (the IEU Open GWAS database, https://gwas.mrcieu.ac.uk/). PM2.5 exposure-related single nucleotide polymorphisms (SNPs) were extracted from the database as exposure factors (423,796 individuals of European ancestry; GWAS ID: ukb-b-10817). Body mass index (BMI) and smoking have been indicated as risk factors for depression [18, 19]. The BMI-related SNPs (ukb-b-19953) and smoking-related SNPs (ukb-b-223) were also extracted as exposures for adjusting the direct causal effect between PM2.5 exposure and depression. To reduce the risk of bias derived from participant overlap, depression-related SNPs were extracted from non-UK Biobank datasets as an outcome (173,005 individuals of European ancestry with 59,851 cases and 113,154 controls; GWAS ID: ieu-a-1188) [20, 21]. The sample overlap rate (about 9%) of the two samples cannot lead to an increase in the type 1 error rate (a web application at https://sb452.shinyapps.io/overlap) [20].
Instrumental Variables (IVs) Selecting
The SNPs can be used as IVs in the analysis of TSMR after the following essential prerequisites should be met. Assumption 1: PM2.5 exposure-related IVs are significantly associated with PM2.5 exposure; Assumption 2: PM2.5 exposure-related IVs can only influence depression through exposure to PM2.5; Assumption 3: PM2.5 exposure-related IVs are not associated with other confounders that related to either PM2.5 exposure or depression.
PM2.5 exposure-related SNPs with values of P<5 × 10⁻⁶ should be selected as PM2.5 exposure-related IVs [22]. To remove IVs with linkage disequilibrium (LD), the clump parameters (LD r2<0.001 and distance window 10,000) were set. The PM2.5 exposure-related IVs can be used to predict PM2.5 exposure when the value of F-statistics >10 [23]. The formula [24] of the F-statistic is listed as follows: F = (R2 × (n − k − 1)) /(k × (1 − R2)); R2 = 2 × (1-MAF) × MAF × beta2; It should be noted that n is the sample size in the GWAS related to PM2.5, k is the number of PM2.5 exposure-related IVs, beta is the effect size of PM2.5 exposure-related IVs, and MAF is minor allele frequency. In addition, PM2.5 exposure-related IVs should not be depression-related SNPs (P>5 × 10⁻⁵). The echo SNPs, which may result in bias, should not be retained in this study [25].
The Analysis of TSMR
The statistical analysis of our TSMR has been completed using R version 4.2.2 software with two packages (“TwoSampleMR” and “MR-PRESSO”) [26]. The causal estimates derived from the method of inverse-variance weighted (IVW) are reliable without directed pleiotropy. Therefore, when we can determine that SNPs do not have pleiotropy, the IVW is a principal method used in MR studies [27, 28]. The IVW method combines the Wald ratios, which were used to estimate the causal effects based on each of the IVs, to provide a pooled causal effect estimate [29]. IVW (random-effect model) was primarily used to assess the causality between long-term PM2.5 exposure and depression. The other four methods (weighted median, MR-Egger, Simple mode, and weighted mode) were also completed to confirm the causal association. Multivariate MR (MVMR) analysis have been performed to estimate the direct causal effect of PM2.5 on depression.
Sensitivity and Pleiotropy Analysis
To satisfy the third assumption of TSMR, pleiotropy testing should be necessarily completed to verify that PM2.5 exposure-related IVs are not associated with any PM2.5 exposure-related and depression-related confounding factors. The Q statistic was performed as a heterogeneity detector to test the heterogeneity among PM2.5 exposure-related IVs (IVW and MR Egger methods). The Q statistic showed values of P above 0.1 indicating that the heterogeneity between PM2.5 exposure-related IVs was insignificant. If the P value <0.1, heterogeneity was considered to be present [30]. The leave-one-out method should also be employed to evaluate the impact of a single PM2.5 exposure-related IVs on the estimates of TSMR.
A non-zero intercept, which was tested by MR-Egger regression, was also viewed as a marker of pleiotropy (P<0.05) [26]. MR-PRESSO is composed of three components such as global testing, outlier testing, and distortion testing [31]. A P value less than 0.05 was evidence of pleiotropy [32].
Results and Discussion
The PM2.5 Exposure-Related IVs
Forty-six PM2.5 exposure-related SNPs were found as the PM2.5 exposure-related IVs without LD. The F-statistics of each SNP ranged from 20.53 to 66.68.
The Analysis of TSMR
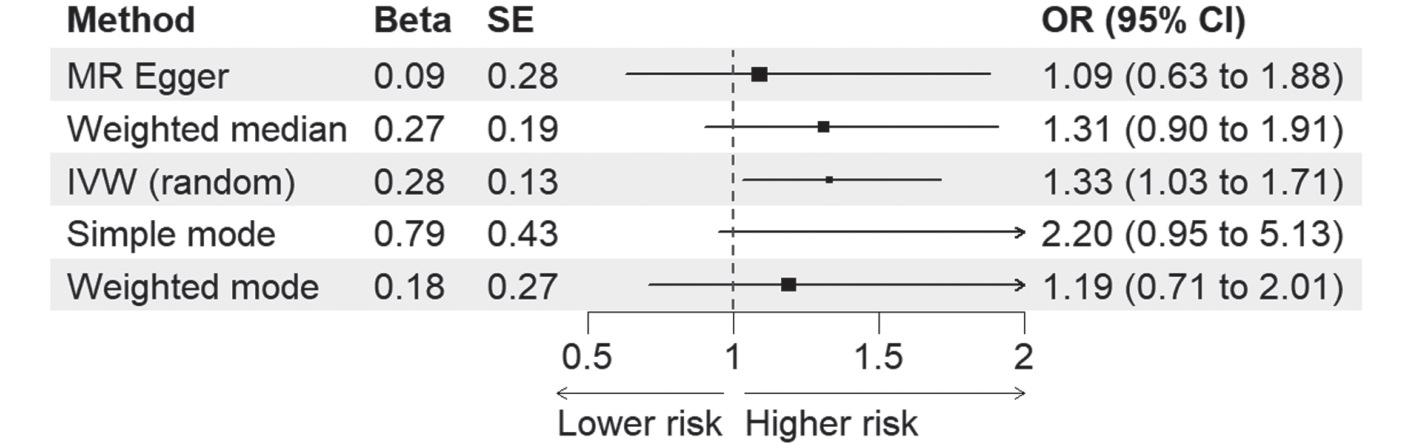
The estimates derived from the five methods of TSMR analysis were calculated as follows: (1) odds ratio (OR) = 1.33, 95% confidence intervals (CIs) 1.03-1.71, P = 0.026 (Random-effect model of IVW); (2) OR = 1.31, 95% CI = 0.90-1.91, P = 0.154 (weighted median);
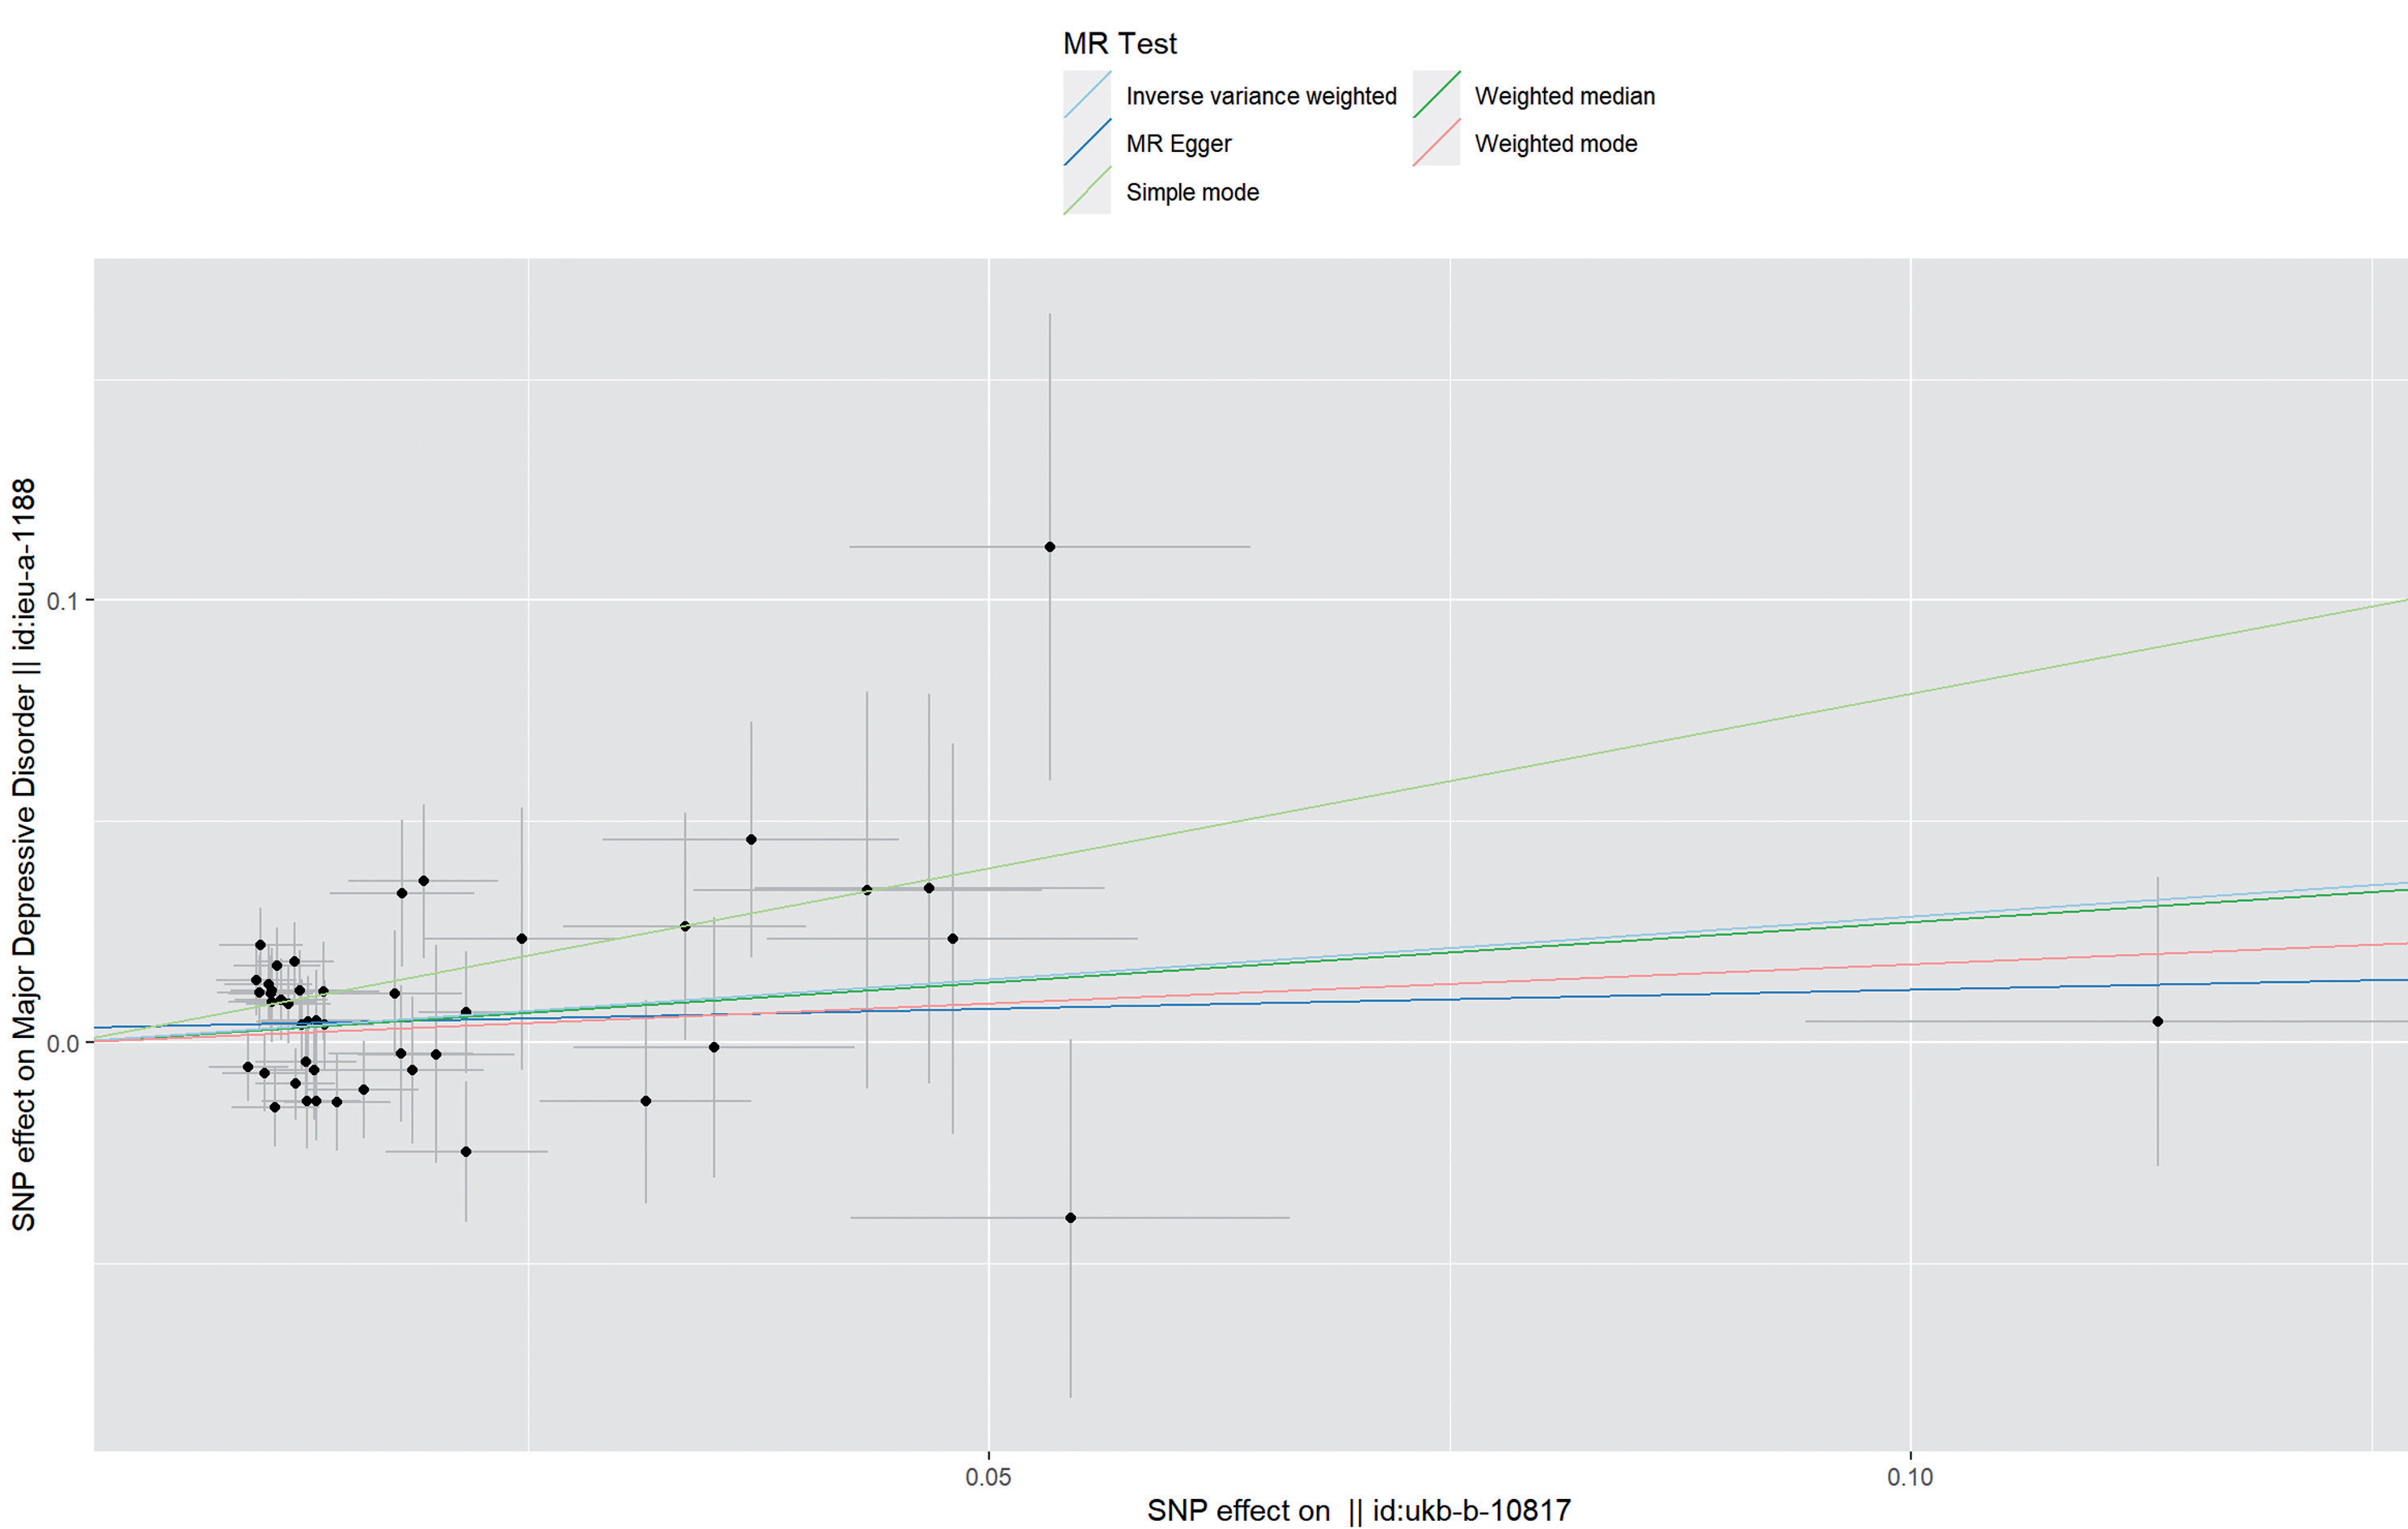
(3) OR = 2.20, 95% CI = 0.95-5.13, P = 0.074 (Simple mode); (4) OR = 1.19, 95% CI = 0.71-2.01, P = 0.51 (Weighted mode) (5) OR = 1.09, 95% CI = 0.63-1.88, P = 0.758 (MR egger) (Forest plots in Fig. 2); The results derive from the four methods (Median weighted, Simple mode, Weighted mode, and MR Egger) were insignificant. Significant results were found in the principal method (Random-effect model of IVW). The positive values of ORs were all present in the five methods (Scatter plot in Fig. S1). In addition, after adjusting for smoking and BMI in the MVMR analysis separately, the relationship between exposure to PM2.5 and the risk of depression remained significant. Therefore, our TSMR analysis supplies a piece of evidence that exposure to PM2.5 is a risk factor for depression.
Sensitivity and Pleiotropy Analysis
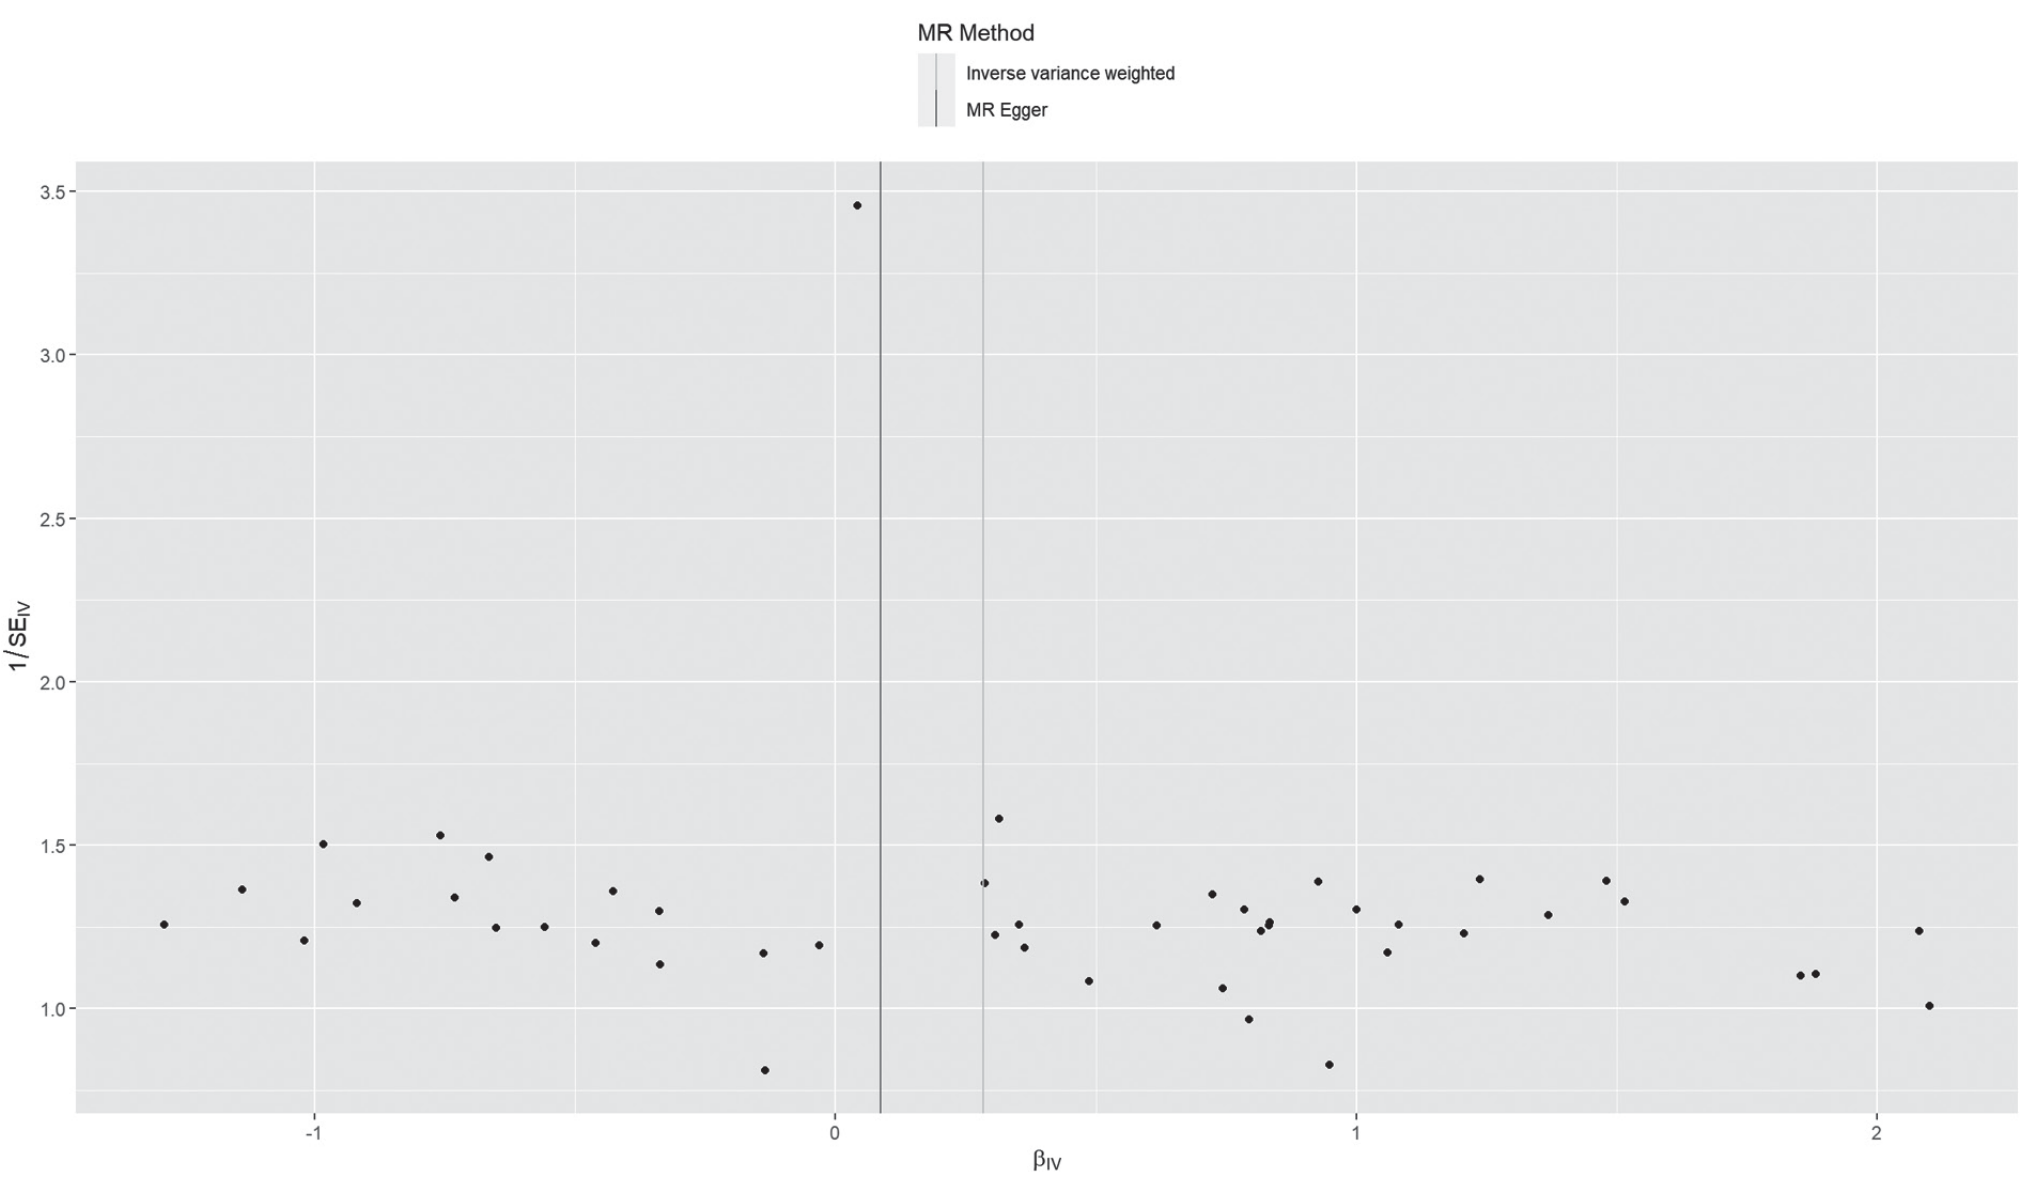
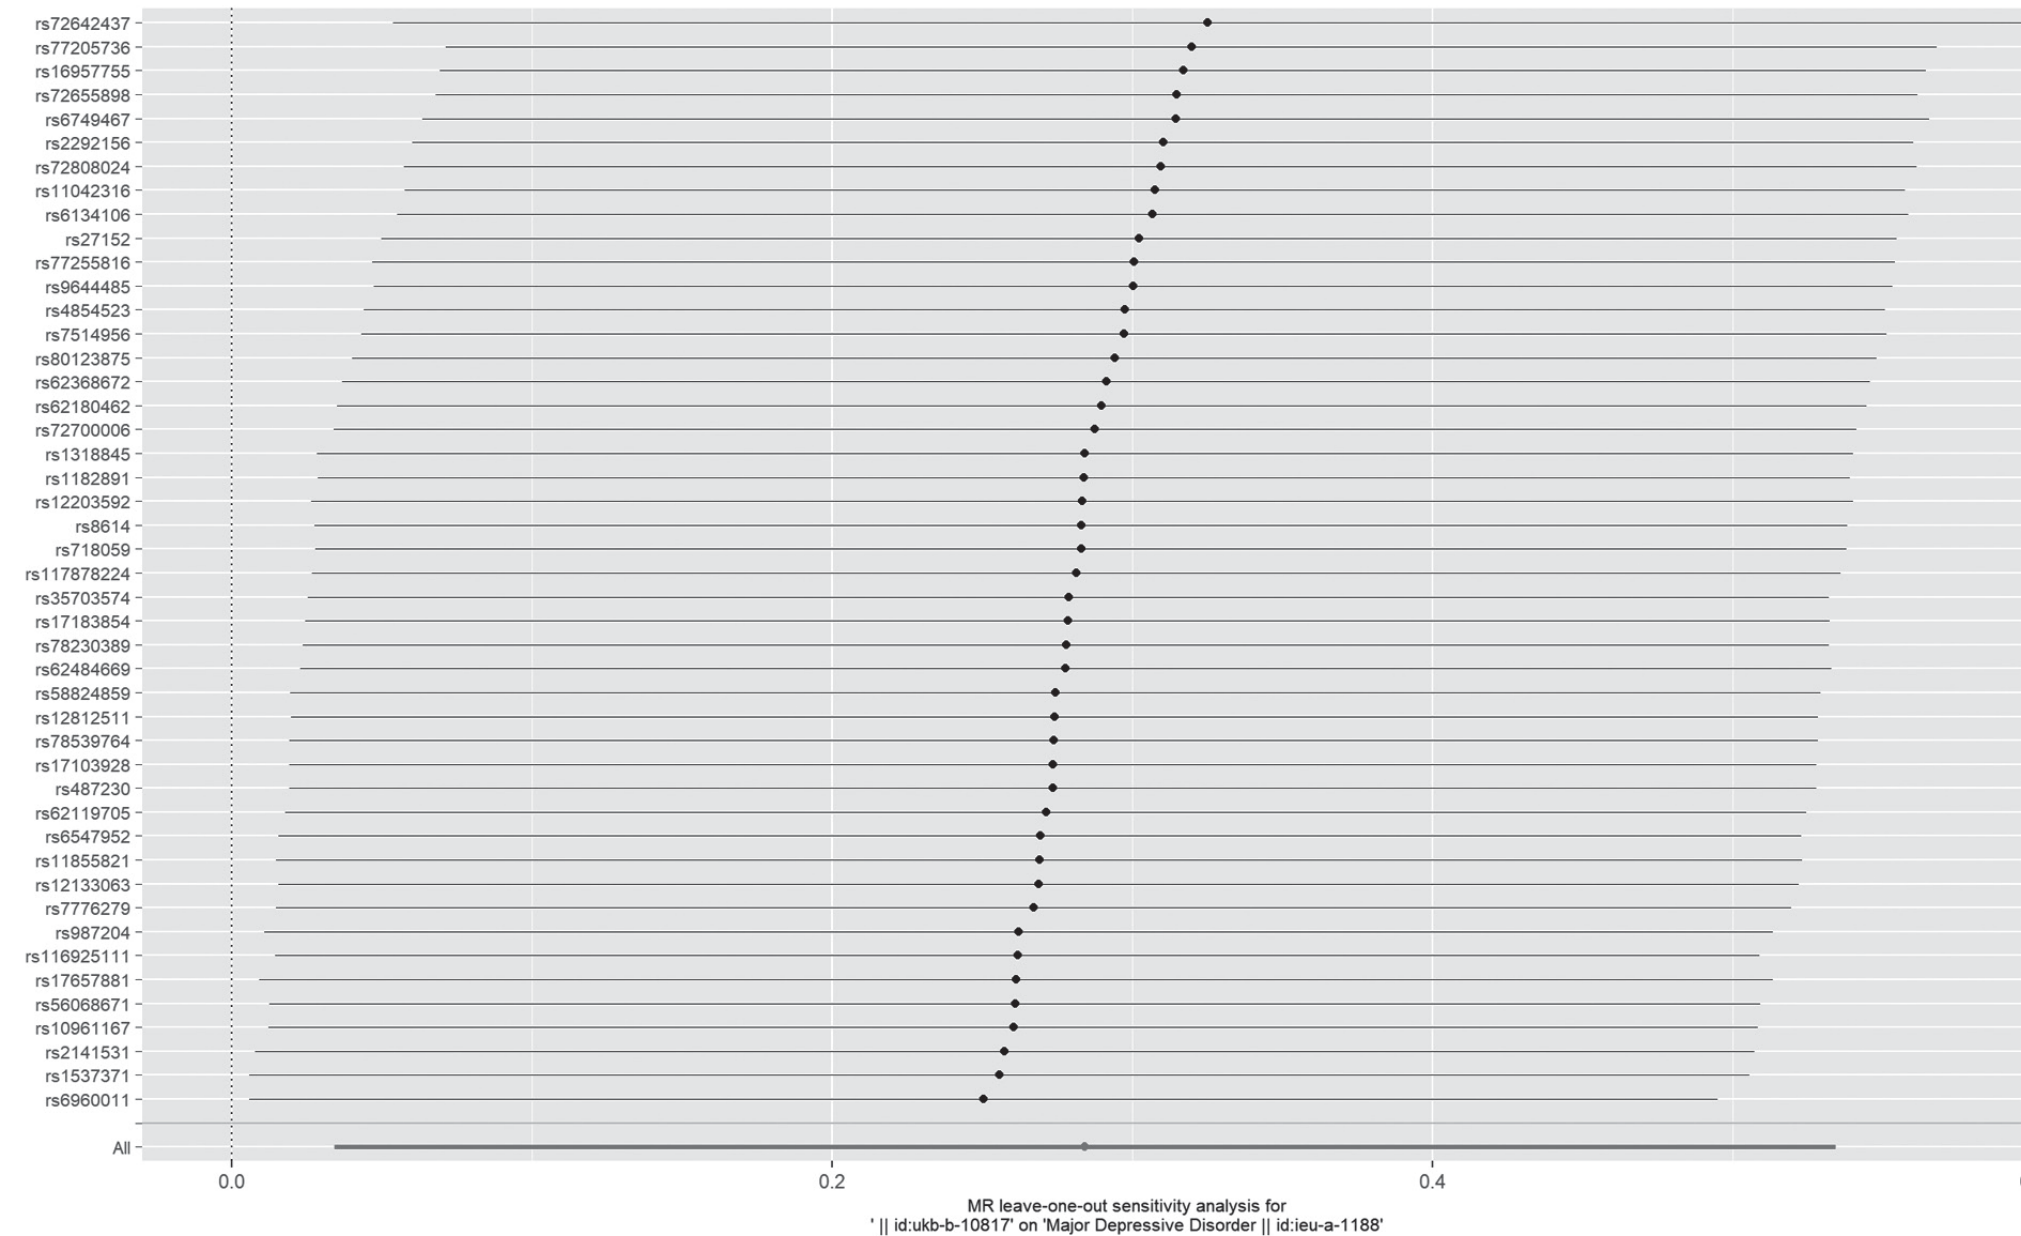
The Q statistic showed values of P = 0.059 for IVW and 0.056 for MR Egger. The heterogeneity among the 46 PM2.5 exposure-related IVs was significant (Funnel plot in Fig. S2). Therefore, the random-effect model was suitable for the method of IVW. In addition, both the Egger-intercept with P value = 0.426 and the test of MR-PRESSO with P value = 0.062 showed that there was no significant pleiotropy. All the results in our TSMR study show that the three essential prerequisites for MR were fulfilled. The 46 PM2.5 exposure-related IVs can be used as IVs for the causal inference in the TSMR. Sensitivity analyses (leave-one-out) have also been performed, and the results could not be significantly changed by each of the IVs (Plot of leave-one-out in Fig. 3). Our TSMR study (IVW) obtained relatively robust results, indicating that PM2.5 exposure is a promoting risk of depression.
The relationship between exposure to PM 2.5 and the risk of depression has been discovered by several human observational studies [11, 33-36]. The results are still controversial, and other human observational studies including several cohort studies found no evidence for the relationship between them [12, 37]. Two systematic reviews, which included cross-sectional studies and cohort studies, have pooled the results of these human observational studies about this issue and provided a comprehensive overview of the evidence that an increased risk of depression was associated with exposure to PM2.5 [13, 14]. However, the evidence of the relationship between them was still insufficient for the causal inference [38-40].
Randomized clinical trials (RCTs), which are generally considered the most reliable and credible experiments for causal inference, are not ethical for a lot of risk factors such as environmental pollution in psychiatry [40]. Achieving random allocation, such as RCTs, is not easy in traditional observational studies. The random allocation of risk-factor exposure can rely on the characteristics of GV, which are randomly inherited from parents to their children. MR studies provide stronger evidence about causality by using GV as a proxy for environmental exposures to provide a random distribution of GV in a population [41, 42]. In our study, 46 PM2.5 exposure-related SNPs were identified as PM2.5 exposure-related IVs, which fulfilled the three assumptions. Our TSMR analysis first supplies evidence based on TSMR that long-term exposure to PM2.5 is a risk factor for depression. Therefore, we hypothesize that improvements in air quality and reductions in PM2.5 exposure can be conducive to reducing the risk of depression.
There are several strengths in our study: (1) Although numerous studies have focused on the relationship between PM2.5 and mental health. MR studies focusing on PM2.5 exposure and health problems are very limited [27, 43, 44]. MR studies focusing on PM2.5 exposure and mental health problems are urgently need to be carried out. To our knowledge, we have performed the first TSMR study for evaluating the causality between PM2.5-exposure and depression, which is the novelty of this study. (2) Large-scale PM2.5 exposure GWAS datasets with 423,796 participants (9,851,867 SNPs) and depression GWAS datasets with 173,005 participants (13,554,550 SNPs) were calculated for the results of our TSMR. (3) We use five computational methods such as the random-effect model of IVW for robust results.
(4) The results of our TMSR represent the result of life-long exposure to PM2.5.
Several limitations should be discussed in our TMSR.
(1) The GWAS datasets of the European population were used in our TMSR. The findings of our TSMR should be replicated and verified in various races in the future and may be not suitable for non-European population.
(2) Although we used multiple computational methods, we are still unable to ensure the complete elimination of horizontal pleiotropy, which may affect the results or our TMSR. Additionally, using genetic proxies rather than real-world data, an association between PM2.5 exposure and non-genetically-determined depression cannot be ruled out by our TSMR. The results in our TSMR should be verified by actual measured data [21, 45, 46].
(4) Our TMSR is difficult in exploring the mechanism of PM2.5 exposure on depression.
Psychological health is closely related to physical health [47]. For example, outdoor physical activities can prevent both obesity and depressive symptoms, while ambient PM2.5 pollution may reduce outdoor physical activities [48-51]. Physical activities may reduce the risk of gestational diabetes mellitus (GDM) for some pregnant women [52]. One MR study has indicated a causal relationship between exposure to PM2.5 and the risk of GDM [44].
In addition, oxidative stress (OS) has been considered a critical mechanism of PM2.5-toxicity [53-55]. Compared to ambient PM 2.5 concentrations, the oxidative activity of PM2.5 may represent a major determinant of PM2.5-toxicities [56-58]. Elemental carbon, which can be found in particulate matter, readily causes the oxidative potential of PM [59]. Exposure to PM2.5 markedly elevated the expression levels of inflammatory cytokines and oxidative stress genes in the macrophages of mice [60]. One study has shown that PM2.5-oxidative damage may lead to the apoptosis of melanocytes [61]. Exposure to PM2.5 impaired the function of the brain such as spatial learning, memory, inquiry ability, and sensory function, which were related to abnormal expression of apoptosis-related proteins and ultrastructure changes in myelin sheaths and mitochondria [62]. An animal study showed that the Nrf2/ NLRP3 signaling pathway, which can modulate inflammation, might have a crucial role in the PM2.5 exposure-related depression [63]. The findings of another animal study indicate that the development of emotions and cognition can be impaired by PM2.5 exposure, possibly through the CREB/BDNF signaling pathway [64]. The exact pathogenesis of the effect of PM2.5 exposure on depression remains to be further studied.