

Introduction
From 1978 to 2018, with the rapid development of industrialization and the market economy, China’s urbanization rate increased rapidly from 17.92% to 59.58%. However, the long-term extensive development model has changed the vulnerability of the ecological environment and led to environmental degradation. Among them, the problem of air pollution caused by fine particle matter has become the focus of public opinion and academic research in recent years. PM2.5 in fine particles can directly reach human alveoli due to its relatively small diameter, causing great harm to the human body [1]. Approximately 1 million people died from long-term exposure to PM2.5 in China in 2013-2017, more than 10% of the national death toll. Research results show that PM2.5 has caused serious harm to citizens’ physical (respiratory diseases, etc.) and mental health (mental diseases, etc.) [2-4]. Simultaneously, in recent years, urban air quality has been incorporated into China’s binding indicators for socio-economic development. Evidently, PM2.5 is poised to become a focal point in China’s future endeavors pertaining to atmospheric pollution control, concurrently representing a significant subject of interest within the realm of international atmospheric environmental research [5, 6]. The Yangtze River Basin, characterized by its extensive geographical reach and dense population activities, plays a pivotal role in China’s socio-economic development. With the continuous advancement of industrialization and economic development, the high population density and dense road transportation networks have resulted in diminishing pollution buffer zones between cities. Consequently, this basin has faced significant challenges related to air pollution [7].
In recent years, both domestic and international academic communities have made notable progress in researching pertinent aspects of PM2.5. In terms of the research scale, the current main units are the whole country [8-10], urban agglomerations [11-14], provinces [14], and individual cities. In addition, existing research mainly focuses on seasonal and spatial changes in PM2.5 concentration in international metropolises or pollution-sensitive cities. And the time span covered is relatively short. The spatiotemporal distribution characteristics, influencing factors and driving forces of PM2.5 concentration have not yet been comprehensively analyzed on a large scale and long time frame. In terms of the properties of PM2.5, spatial agglomeration, spatial variability, and human inhalable microorganisms were mainly analyzed. In terms of influencing factors, existing research has noted that the causes of PM2.5 pollution include not only air temperature, precipitation, dust and terrain [15], air pressure [16], wind speed, wind direction, precipitation, SO2, NO2, CO, O3 concentrations [17-18] and other physical and geographical factors but also per capita GDP, urbanization, population density, traffic factors, energy consumption factors, and other economic and social factors [19-21]. However, some studies have also confirmed that economic and social factors have a greater impact on PM2.5 pollution in China [22]. Research methods mainly include the gray correlation model, geographical detector method [17], geographically weighted regression model [23], principal component analysis [24], Gaussian mixture regression [25], and spatial econometric model [26]. The gray correlation model must subjectively determine the optimal value of each index. Principal component analysis is difficult to apply to large-scale and long-term time series research when source analysis is performed [27]. Moreover, the linear relationship and data distribution assumptions in the geographically weighted regression model have certain limitations. The premise of using the Gaussian mixture model is to make distribution assumptions on the data, including the proportion and number of data categories. However, the use of geographic detectors can directly test the coupling of multiple variable space-time distributions, eliminating the error caused by data distribution assumptions and subjective judgments and improving the accuracy of experimental results [28, 29]. Therefore, it is widely used in analysis to study the spatial-temporal differentiation characteristics of pollutants [30, 31].
Overall, the research areas of many previous studies are mainly based on a single scale, such as the whole country, a province, or a single urban area. In addition, the spatial-temporal differentiation characteristics are difficult to identify effectively at different scales. Thus, this study breaks through traditional single-scale research, starts from the perspective of spatial multiscale based on the annual average concentration data of PM2.5 and urban socioeconomic data from 2009 to 2018, and comprehensively uses the methods of time-space analysis and geographic detectors in GIS to study the Yangtze River. The temporal and spatial evolution characteristics of PM2.5 in the watershed and its influencing factors are expected to be vital to the joint prevention and control of air pollution.
Data Sources and Research Methods
Data Sources
The data sources are mainly divided into two parts:
(1) PM2.5 concentration data. This research uses the atmospheric PM2.5 remote sensing retrieval dataset (V4.CH.02) provided by the Atmospheric Composition Analysis Group of Dalhousie University in Canada from 2009 to 2018. The download link is http://fizz.phys.dal. ca/~atmos/martin/?page_id=140. Compared with the point source data provided by ground monitoring points in the existing research, satellite monitoring data have the advantages of a long time span, high resolution, and low degree of human interference. Therefore, using this dataset can well reflect the real situation of PM2.5 concentration in the region. In view of this, this study uses the vector data of each administrative division boundary line as a mask in GIS and performs partition statistics on the raster data with an accuracy of 10 km. Finally, the annual average data of PM2.5 in each city in the Yangtze River Basin are extracted, and the spatial and temporal analysis of GIS is used to visualize PM2.5 in different administrative regions of China.
(2) Socioeconomic data. These data are mainly derived from the 2010-2019 China Urban Statistical Yearbook. The spatial heterogeneity of PM2.5 concentration in China is notably pronounced, reflecting a complex array of contributing factors. These factors encompass a spectrum of natural elements, including atmospheric circulation patterns, wind direction and frequency, and precipitation. Concurrently, anthropogenic influences encompass industrial particulate emissions, coal combustion, crop residue burning, and vehicular exhaust emissions, among others. To conduct a comprehensive analysis of the influencing factors behind PM2.5 concentration variations, panel data spanning the years 2009, 2012, 2015, and 2018 from 11 provincial-level regions were selected. Employing the geographic detector methodology facilitated the detection of spatial differentiation characteristics and the identification of driving forces responsible for spatial disparities.
Human activities, as direct instigators of environmental pollution, have consistently remained a focal point in research on the impact of PM2.5 pollution. Environmental factors, such as temperature, wind speed, humidity, and the three-dimensional spatial morphology of urban areas, can exert influences on the diffusion of airflows and particulate matter, thus being considered indirect influencing factors on PM2.5 concentrations within the atmosphere. Regarding energy consumption, serving as a pivotal conduit for China’s economic development, it shoulders the weight of significant industrial progress. Concurrently, the Yangtze River trunk line, holding the distinction of being the world’s busiest inland waterway with the highest transport volume for consecutive years, features well-developed ports along its route, a high level of urbanization, and factors related to transportation, such as vehicular emissions and urban road infrastructure, undoubtedly contribute to increased PM2.5 concentrations.
By sorting out existing research and on the basis of available data, 11 variable factors affecting PM2.5 pollution are finally selected, including four population and urbanization factors, namely, population density, proportion of urban built-up areas, per capita GDP, and urban greening rate; five industries and energy consumption factors, namely, the proportion of tertiary industry employees, industrialization level, science and technology expenditure, industrial soot emissions, and industrial sulfur dioxide emissions; and two traffic factors, namely, the actual urban road area and the total number of urban buses at the end of the year.
Research Methods
Spatial Autocorrelation Analysis
In the global spatial autocorrelation, the average similarity of PM2.5 concentration in the adjacent area unit can be expressed by the Moran index, which is calculated as shown in Formula (1).
Where I represent the global Moran index; xi and xj are the PM2.5 concentrations of city i and city j, respectively; and x is the average PM2.5 concentration of the whole city. wij represents the spatial weight between city i and city j, which is calculated by the Queen proximity method. When i = j, the spatial weight is 0; n is the number of research units, that is, the total number of cities. The value range of the global Moran index is [−1,1]. When I = 0, no correlation exists between the regional units; when I>0, a positive spatial autocorrelation exists. The stronger the agglomeration is, when I<0, a negative spatial autocorrelation is found; the smaller the value is, the stronger the spatial dispersion.
The significance level of the local Moran index can be measured by the Z statistic, which is calculated as shown in Formula (2).
In the formula, ZI is the significance level, and E[I] and V[I] are the mathematical expectation and variance of the local Moran index, respectively.
Geographic Detector
Geographic detectors have been widely used in various fields, such as natural society. Its research scope includes the township scale to the national scale. At present, it is mainly used in the fields of social economy and ecological environment. In these applications, a geographic detector was mainly used to analyze the driving force and influencing factors of various phenomena and the interaction of multiple factors, and its calculation is shown in Formula (3).
In the formula, q represents the contribution value of the factor to the variable Y; i = 1, 2, ..., L is the stratification (class/area) of the factor or variable; σi2 and Ni are the variance and the number of samples of the i-th layer; and σ2 and N are the variance and the sample size of the whole area, respectively. If the stratification is generated by variable Y, its spatial differentiation becomes more evident with the increase in the q value. If the stratification is generated by the factor X, then the degree of interpretation of the factor to the variable Y increases as the q value increases, which can be measured by 100 × q %. The value range of q is [0,1]. When q = 0, the factor has no correlation with the variable Y; when q = 1, the factor can completely explain the spatial differentiation of the variable Y. The p value is defined by the noncentral F distribution, and the q value is tested for significance through the p value. If the p value is less than 0.05, then the alternative hypothesis is satisfied, and the null hypothesis is rejected; if the p value is greater than or equal to 0.05, then the q value is not significant, and no evidence is found to reject the null hypothesis.
Table 1.
PM2.5 Concentration Standard Value.
Interaction detection evaluates whether the interaction between the X1 and X2 factors will affect the explanatory power of Y. By comparing the q value of each single factor with the q value after the superposition of the two factors, the strength of the interaction between the two factors can be judged. The symbol “∩” is used to represent the interaction between the two factors. Let the influence of the factor interaction be q (X1∩X2). If q (X1∩X2)>q (X1) + q (X2), it is nonlinear enhancement. If q (X1∩X2) > Max (q (X1), q (X2)), it is a two-factor enhancement; if q (X1∩X2) = q (X1) + q (X2), the two factors are independent; if Min (q (X1), q (X2))<q (X1∩X2)<Max(q (X1), q (X2)), it is a single-factor nonlinear attenuation; if q (X1∩X2)<Min (q (X1), q (X2)), it is nonlinear attenuation.
Results
Analysis of the Time Series Characteristics of PM2.5
in the Yangtze River Basin
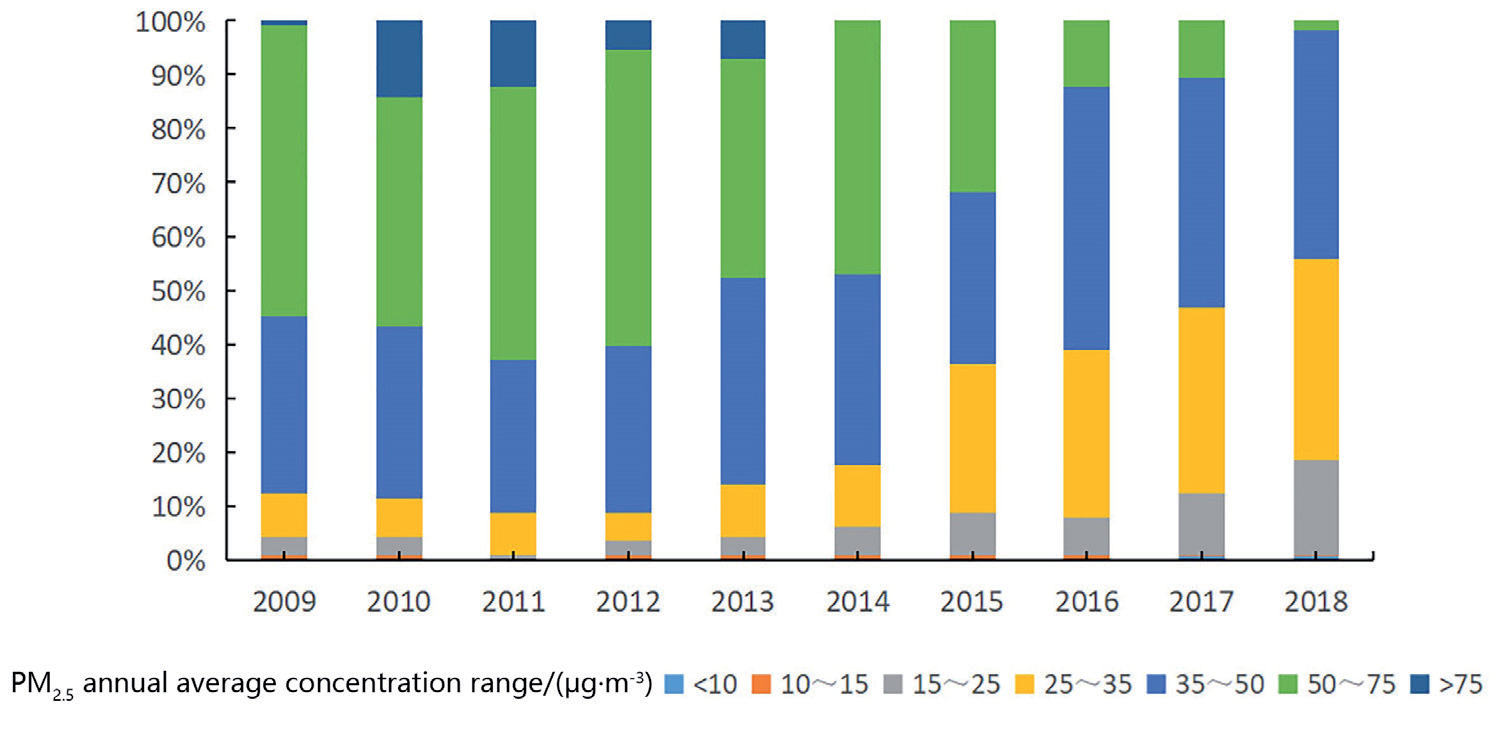
To reflect the spatial distribution of PM2.5 in each prefecture-level city of each urban agglomeration clearly, the legend is unified to compare the spatial and temporal changes in PM2.5 more effectively and avoid the excessive influence of extreme values on the classification, referring to the World Health Organization and China’s Ambient Air Quality Standards (Table 2); the annual average concentration of urban PM2.5 is divided into seven intervals. The proportion of the number of cities in the Yangtze River Basin from 2009 to 2018 is analyzed (Table 3).
The specific results are as follows (Fig. 1): 1) The overall trend of cities below 10 μg/m3 (annual average base value) is not evident, and the number of cities is relatively small. 2) The proportion of cities with an annual average mean PM2.5 below 35 μg/m3 (the annual mean limit in China) continued to increase from 12.38% in 2009 to 55.75% in 2018. 3) The proportion of cities with a grade of more than 75 μg/m3 peaked to 14.16% in 2010, followed by a wave-like decline, and no cities of this level appeared until 2014. This phenomenon is related to the important directive documents related to the prevention and control of air pollution issued by the state during 2010–2012 (“Guidance on Promoting Joint Prevention and Control of Air Pollution to Improve Regional Air Quality,” “Air Pollution Prevention and Control Action Plan,” etc.). It shows that after 2010, as the government began to pay attention to the continuous growth of PM2.5 concentration, the cities exceeding this level were well controlled. 4) From 2009 to 2014, the proportion of cities with an average annual PM2.5 concentration exceeding 35 μg/m3 changed most evidently, showing a trend of “first increasing and then decreasing” from 87.61% to 44.25%, and the decrease was nearly doubled. It reached the highest value of 91.95% in 2011 and 2012 and then began to decline sharply, falling to the lowest value of 44.25% in 2018. Overall, the number of cities with low concentrations of PM2.5 increased from 2009 to 2018, whereas the number of cities with high PM2.5 concentrations decreased, and urban air pollution improved with relevant government control.
Table 2.
PM2.5 Concentration Global Moran’s I Index.
| Year | Moran ‘s index | z score | p value |
|---|---|---|---|
| 2009 | 0.8202 | 20.4118 | 0 |
| 2012 | 0.8408 | 21.3599 | 0 |
| 2015 | 0.9752 | 25.1254 | 0 |
| 2018 | 0.8895 | 21.6705 | 0 |
Table 3.
Global Detection Results of PM2.5 pollution causes in China.
Analysis of Spatial Variation Characteristics of PM2.5 in the Yangtze River Basin
To explore the spatial differentiation characteristics of PM2.5 concentration further, this study spatially clustered the mean value of PM2.5 concentration in the Yangtze River Basin over the years. After comprehensive consideration, representative 2009, 2012, 2015, and 2018 were selected for visual analysis. After comprehensive consideration, representative 2009, 2012, 2015, and 2018 were selected for visual analysis.
As shown in Fig. 2, the low-value areas of PM2.5 concentration below 35 μg/m3 are mainly concentrated in Qinghai Province, Tibet Autonomous Region, Yunnan Province, Chongqing City, Guizhou Province, Sichuan Province, Shaanxi Province, Gansu Province, and other regions. Therefore, the change trend of PM2.5 concentration in the central and western regions of the Yangtze River Basin is small, and the change in the northeastern region is more significant. The high-value areas with more than 50 μg/m3 are mainly concentrated in Hubei, Jiangsu, Zhejiang, Anhui, and other regions. In 2012, the concentration of PM2.5 in Jingzhou, Xiaogan, Wuhan, and Ezhou in the eastern part of Hubei Province and Yueyang, Changsha, and Xiangtan in the northern part of Hunan Province decreased in comparison with 2009, but in 2015, a large area of high pollution appeared. Hubei and Anhui increased to high-pollution areas, and the concentration of PM2.5 decreased until 2018.
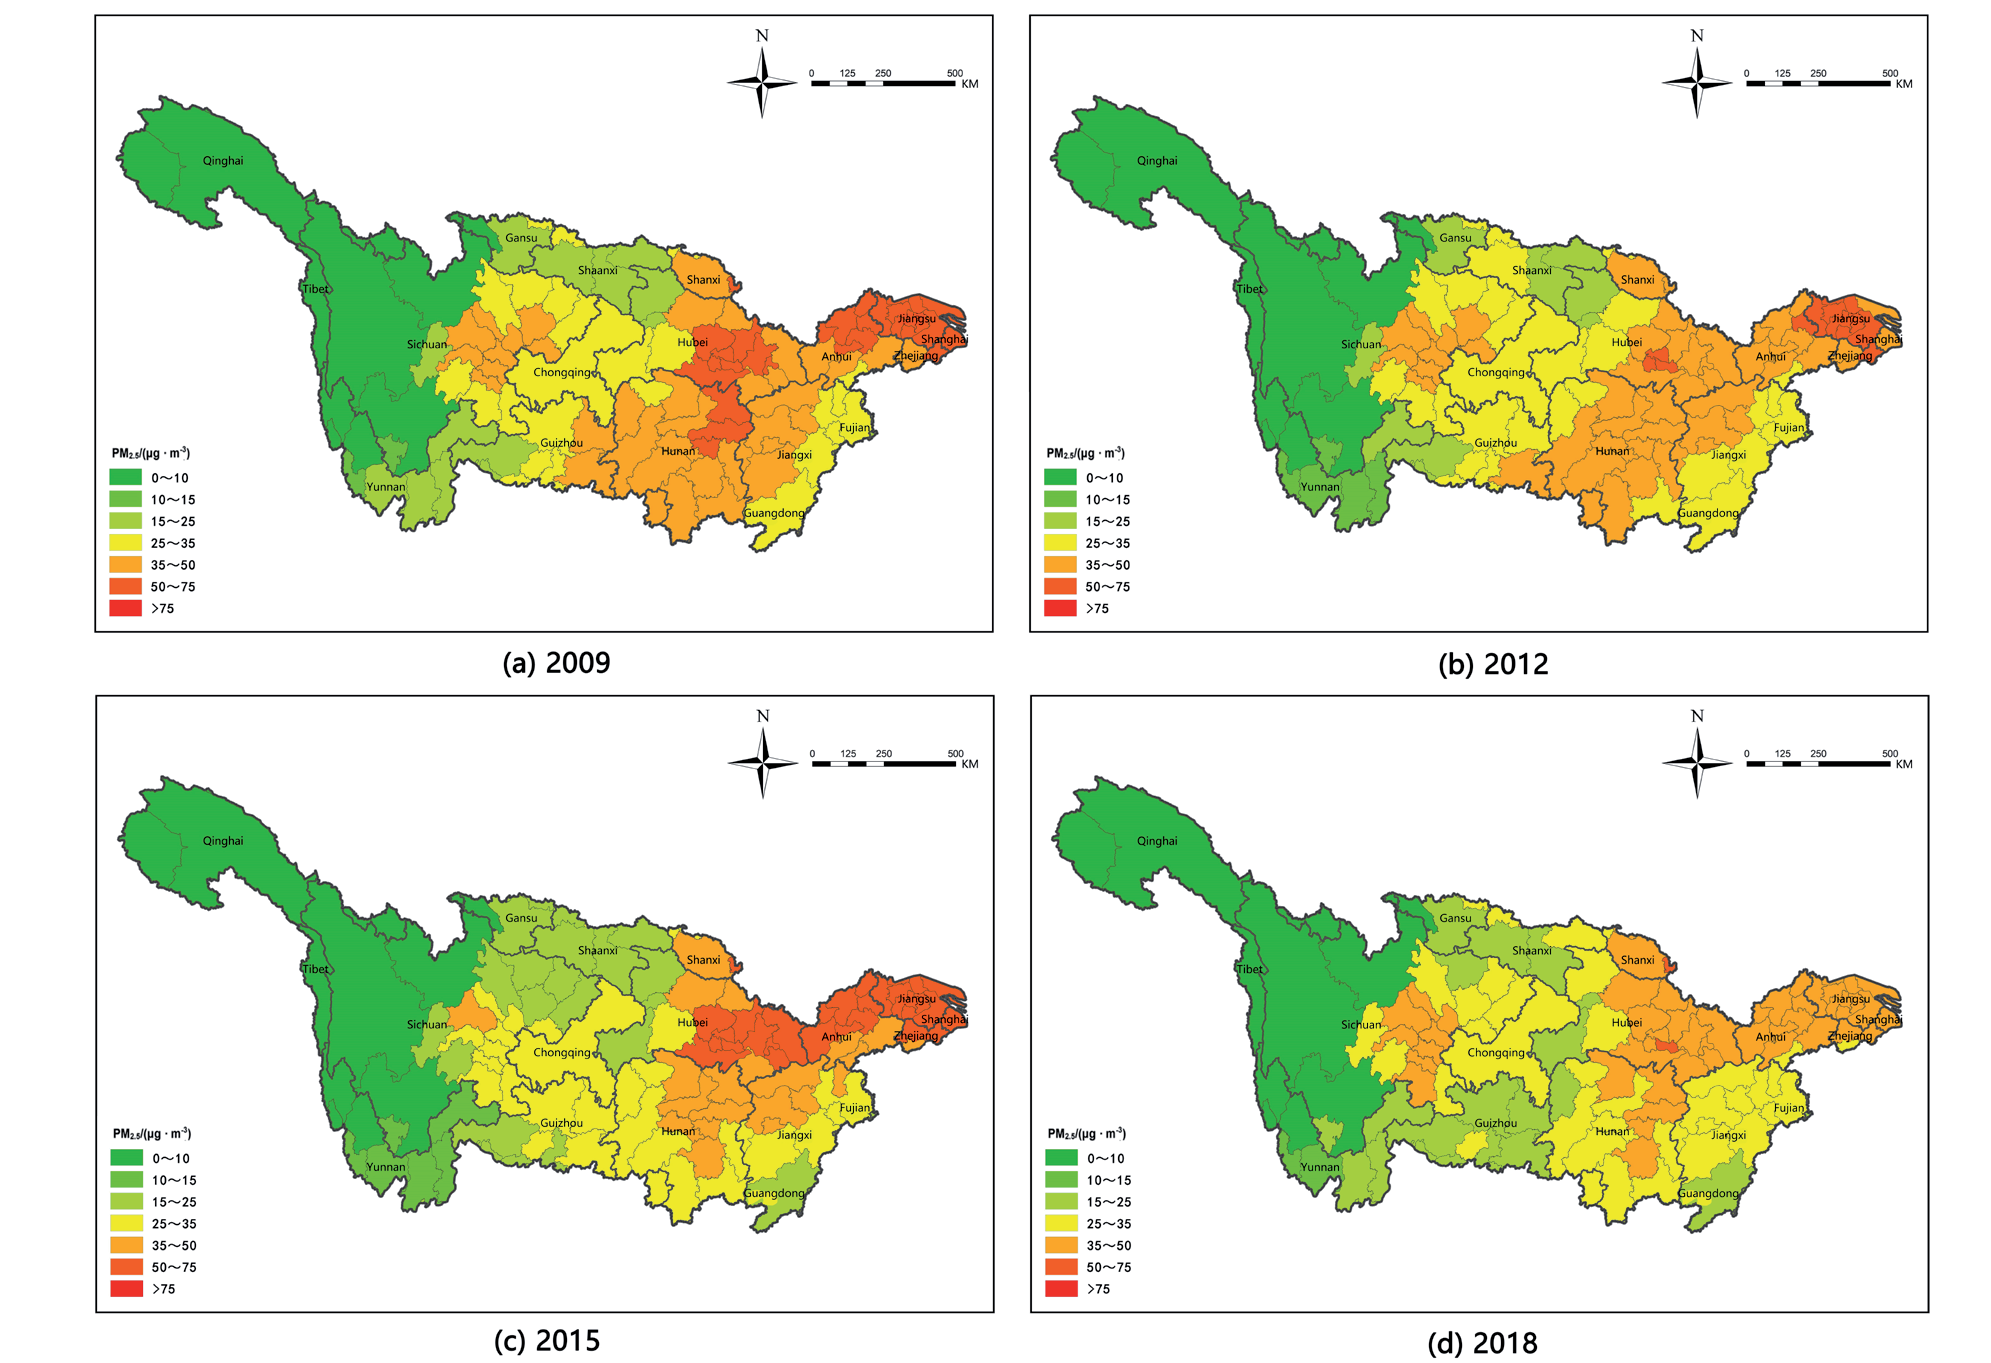
In general, the distribution of low-value areas of PM2.5 annual average concentration in the Yangtze River Basin from 2009 to 2018 is relatively stable, and the high-value areas generally show a trend of decreasing first, then increasing and then decreasing. Considering the large economic differences among cities, the pollution concentration of PM2.5 may have an inseparable geospatial correlation with population density and economic activity density. Therefore, to compare the differences more significantly between cities and realize the analysis of multiscale spatial–temporal differentiation characteristics and its influencing factors, this study analyzes the Yangtze River Basin from the perspective of social economy, with a view to the joint prevention and control of air pollution and the construction of ecologically civilized cities.
Analysis of Temporal and Spatial Pattern Evolution of PM2.5 Concentration in the Yangtze River Basin
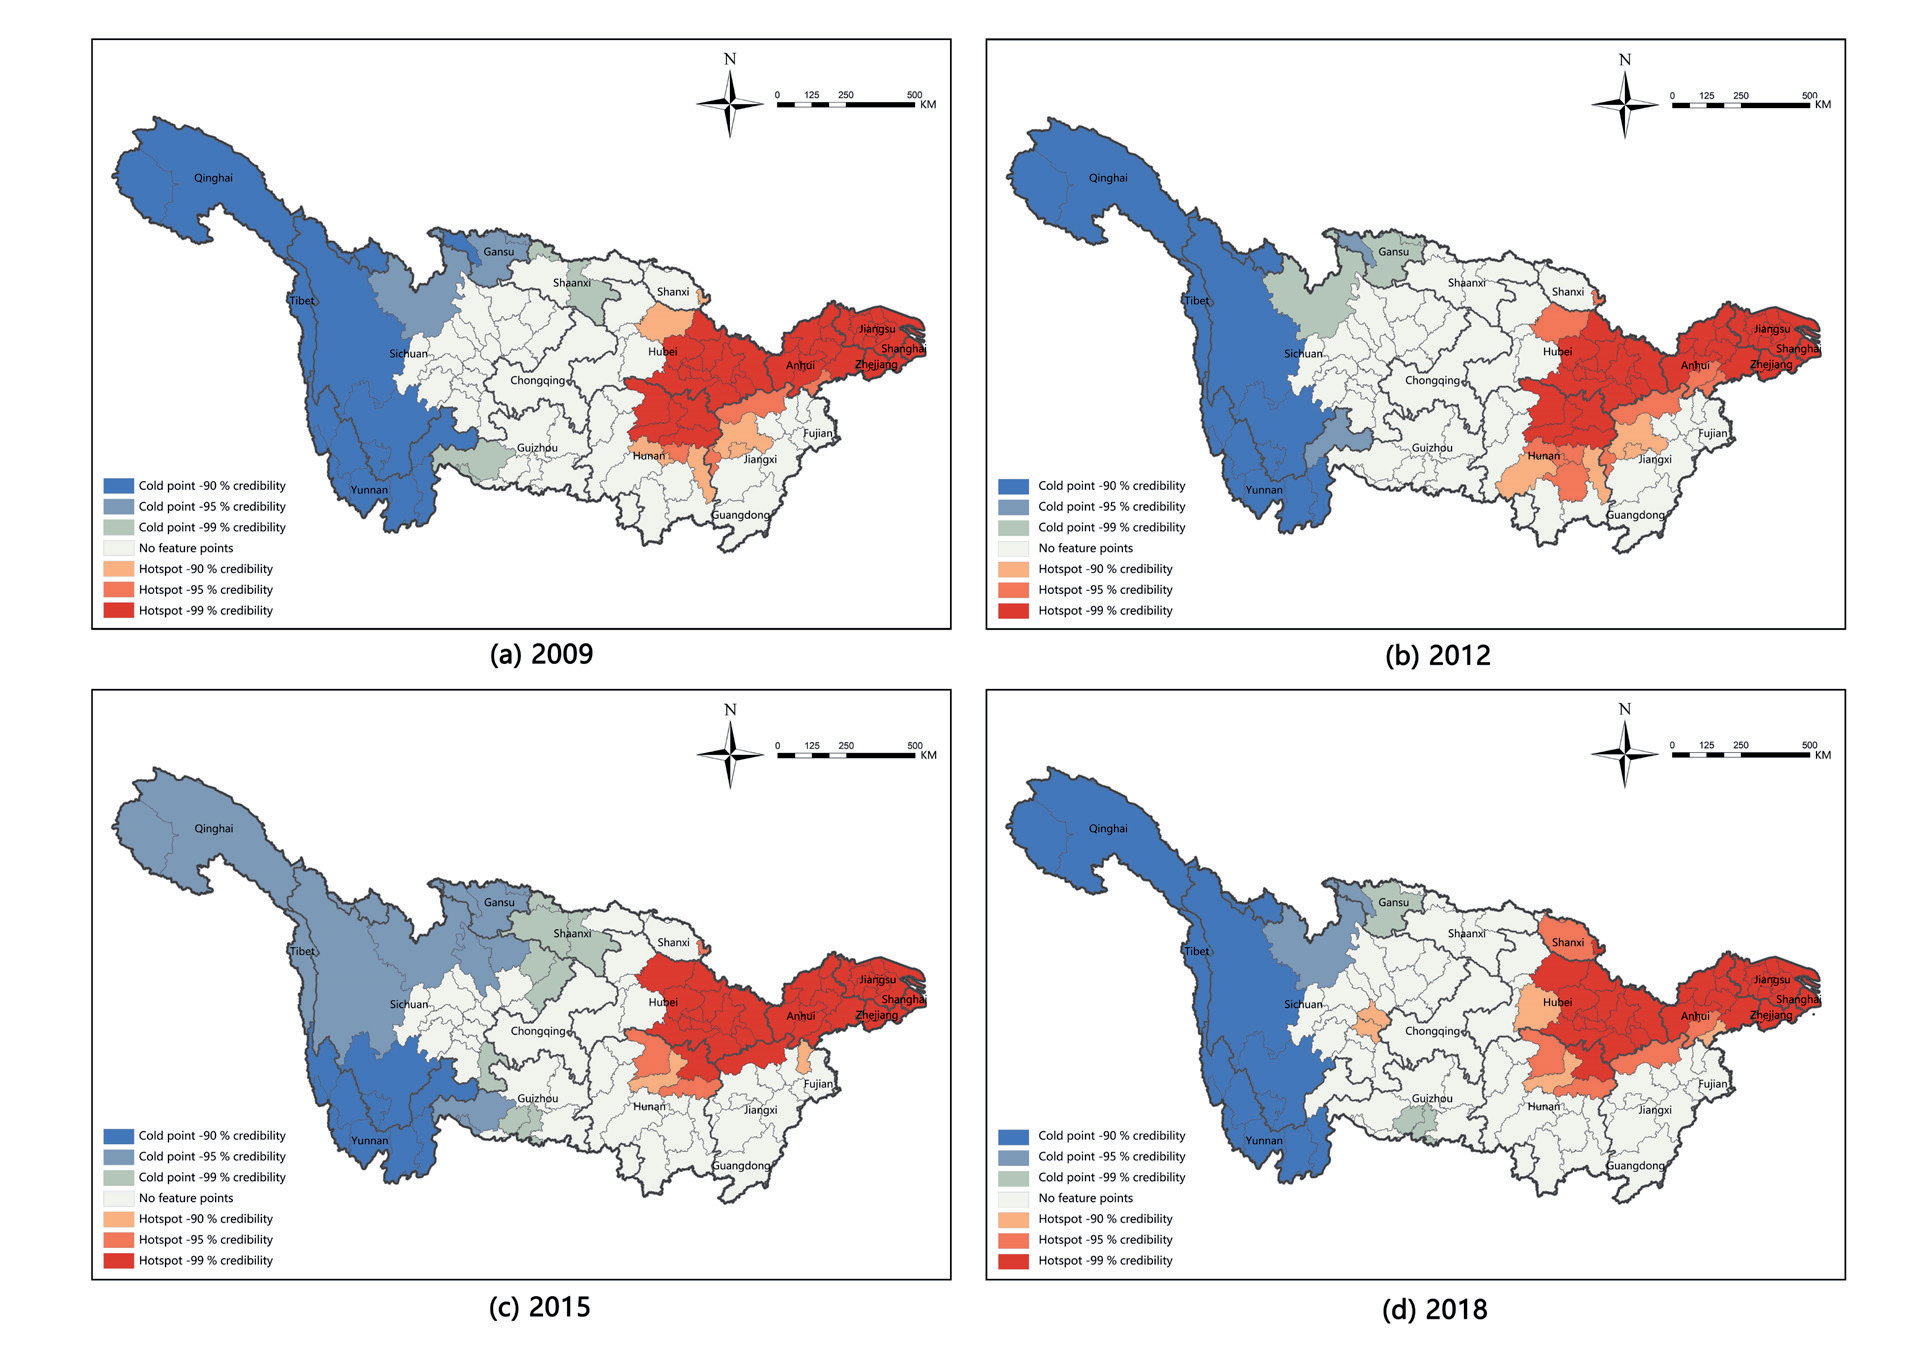
The results of the spatial autocorrelation test of PM2.5 concentration in cities in the Yangtze River Basin from 2009 to 2018 by GIS software are shown in Table 2. The Moran’s index under the Queen spatial weight matrix was greater than 0.8, which passed the significance test at the 1% level, indicating that PM2.5 in the Yangtze River Basin cities showed spatial aggregation during 2009-2018, and the “cold spot-hot spot” aggregation characteristics could be further analyzed by GIS. In summary, the geographic detector method can be used to study the influencing factors of PM2.5 concentration.
The spatial aggregation pattern of the PM2.5 annual average concentration in the Yangtze River Basin in 2009, 2012, 2015, and 2018 is shown in Fig. 3. Overall, the spatial-temporal agglomeration effect is evident, showing an “east-hot, west-cold” agglomeration pattern. From 2009 to 2018, the high-value agglomeration area expanded to the middle of the Yangtze River Basin and then shrank to the northeastern Hubei Province, northern Hunan Province, Anhui Province, Jiangsu Province, Zhejiang Province, and Shanghai City, which have always maintained high-value clusters. The low-value accumulation areas are concentrated in the western part of the Yangtze River Basin, Qinghai Province, Tibet Autonomous Region, Yunnan Province, western Guizhou Province and other places, and the trend of range change is not significant. In 2009, the hot spots were mainly concentrated in the northeastern coastal areas of the Yangtze River Basin with high population density, developed economy, and large traffic energy consumption. In 2012, it began to spread to the central region. Changde, Yueyang, Yiyang, Changsha, Loudi, Xiangtan, Hengyang, and other places in Hunan Province began to have high-value clusters. However, after 2015, the hotspots began to shrink to the north of the Yangtze River Basin, and the hotspots in Loudi, Xiangtan, Hengyang, and other places in Hunan Province did not continue to appear. During 2009-2018, the cold spots of PM2.5 concentration were mainly distributed in the Tibet Autonomous Region and Yunnan Province, which were mainly characterized by mountains and plateaus, sparse population, and relatively underdeveloped economy.
Table 4.
Interactive Dominant Factor Interpretation.
Analysis of Influencing Factors of PM2.5 Concentration
Single-Factor Contribution Analysis
Before conducting the geographical detector, this study used SPSS software to conduct correlation analysis on 11 variables and verified that no collinearity problem exists among the variables. Then, from the data collected from the China Statistical Yearbook, the urban socioeconomic data in the Yangtze River Basin in 2009, 2012, 2015, and 2018 were taken as the analysis object, and data were standardized. Afterward, the geographical detector method was used to analyze the influence of each influencing factor on the annual average concentration of PM2.5. The results are shown in Table 3. Population and urbanization factors, industry and energy consumption factors, and traffic factors have varying degrees of influence on the temporal and spatial distribution of PM2.5. Among them, population density and the proportion of urban built-up areas in the population and urbanization index layer are strongly correlated factors.
(1) Driving factors of population and urbanization
Given that the q values of population density and proportion of urban built-up area have the largest values among all influencing factors, they contribute the most to PM2.5. The detection results of urban population density were 20.93%, 30.91%, 19.75%, and 28.92%, showing a “W-shaped” evolution trend of “rising first, then falling, and then rising.” The q-values of urban built-up areas are 30.00%, 27.83%, 21.99% and 31.22%, respectively, showing a “V-shaped” evolution trend of “declining first and then rising” as the degree of urban construction changes. The contribution value of the urban green space rate to PM2.5 is only lower than that of population density, and its q values are 11.00%, 23.34%, 26.26%, and 20.14%. Studies have shown that vegetation absorbs atmospheric pollutants during photosynthesis; thus, the effect of PM2.5 concentration can be alleviated by increasing greening construction. The contribution values of per capita GDP were 13.62%, 13.91%, 25.15%, and 15.62%. Economic development and human activities also have a greater impact on PM2.5.
(2) Driving factors of industry and energy consumption
The contribution value of industrialization level and science and technology expenditure to PM2.5 has certain fluctuation, and the overall trend is “first increasing and then decreasing.” The q values are 12.95%, 18.80%, 14.23% and 14.04%, 26.35%, 32.63%, 14.50%. As industrial production increases energy consumption, its emissions are one of the important sources of urban air pollution. Industrialization is the main driving factor of PM2.5 pollution in most areas. The number of employees in the tertiary industry has a greater impact on PM2.5 and is relatively stable, with q values of 19.47%, 19.80%, 20.25%, and 19.47%. Given that the 12th five-year plan for 2011-2015 proposed scientific and technological innovation to accelerate industrial upgrading and transformation, the improvement of industrial production efficiency has reduced industrial pollution to a certain extent. The contribution of industrial smoke and dust emissions and industrial sulfur dioxide emissions decreased from 8.06% and 8.08% in 2009 to 3.26% and 2.08% in 2018, and their contribution to PM2.5 concentration decreased.
(3) Driving factor traffic
The actual road area and the total number of urban buses at the end of the year can roughly reflect the traffic situation value of the city. The q values of the actual road area at the end of the year are 23.98%, 24.75%, 18.75%, and 13.61%, showing a downward trend. At the end of the year, the contribution value of the total number of buses to PM2.5 in real cities increased from 14.18% in 2009 to 16.39% in 2015 and maintained an upward trend but decreased to 14.17% in 2018. This decline is related to the popularization and use of new energy buses nationwide in 2016. At the end of 2016, the total number of new energy buses nationwide exceeded 160,000. Air pollution caused by automobile exhaust emissions decreased with the increase in the number of new energy buses and taxis. With the further promotion of new energy buses and taxis, the impact of total urban buses on PM2.5 concentration may continue to decline at the end of the year.
Analysis of the Interaction Mechanism of Leading Factors
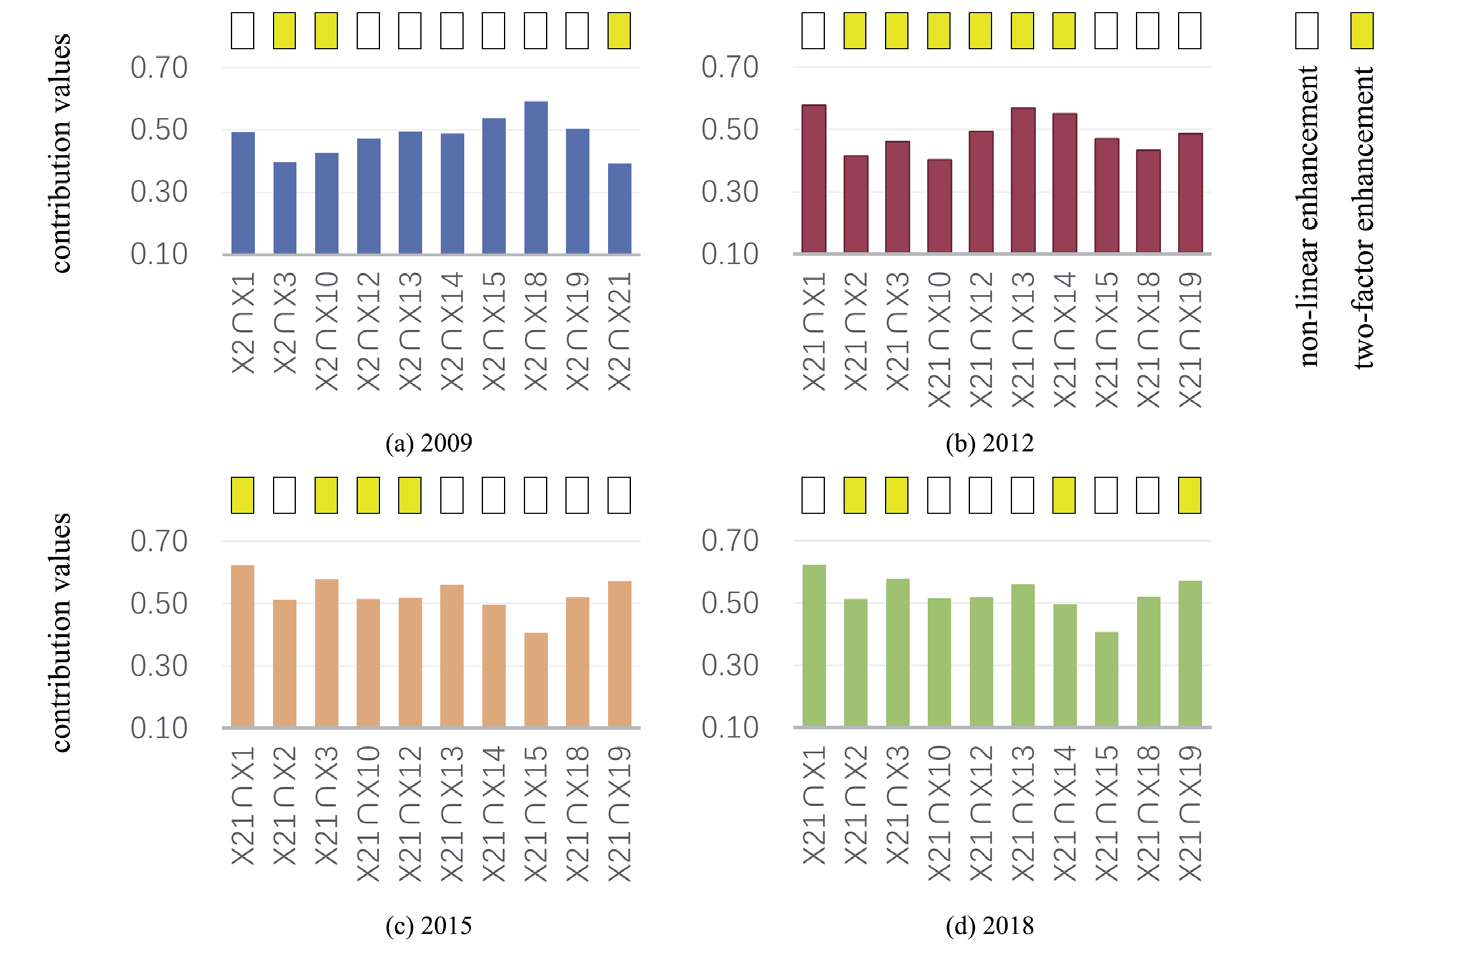
Many factors affect the concentration of PM2.5 in the Yangtze River Basin, and the driving factors are complex. Accurately identifying the dominant factors, especially the interaction mechanism between different factors, is the most difficult and key to alleviating air pollution. Geographic detectors were used to detect the dominant interaction factors of cities in the Yangtze River Basin during the four-year period, and the detection results are shown in Fig. 4.
In terms of single-factor detection results, the dominant factor in 2009 and 2018 was the proportion of urban built-up areas, with q values of 30.00% and 31.22%, respectively, indicating that the proportion of urban built-up areas in these two periods can reflect 31% of the PM2.5 spatial distribution. In 2012 and 2015, the dominant factor was population density, and its q values were 30.91% and 32.63%, respectively, indicating that the population density dominant factor could explain 32% of the PM2.5 situation. In the detection results of interaction dominant factors, the strength of interaction between a single dominant factor and another factor is significantly greater than that of a single factor, and a nonlinear strengthening or double factor strengthening relationship is found between the dominant factor and other factors. The interaction analysis of each factor influences the spatial differentiation characteristics of PM2.5 concentration, but some differences are found in the intensity of interaction in different periods. Fig. 4 shows that the average q values of the dominant interaction factors in 2009 and 2018 were 47.98% and 47.23%, respectively, and the q values of the dominant interaction factors increased by 17.98% and 16.01%, respectively, compared with the single dominant factor. Among the dominant interaction factors, the interaction between the dominant factor of urban built-up area and industrial smoke and dust emissions has the largest contribution to PM2.5 concentration, which are 59.13% and 56.59%, respectively. These values increased by 29.13% and 25.37%, respectively, compared with the single dominant factor. Results show that in the case of moderate urban construction and development, increasing scientific and technological innovation and accelerating industrial upgrading and transformation have the best mitigation effect on PM2.5 pollution. The contribution rate of dominant interaction factors increased greatly in 2012 and 2015, and the average q values after interaction were 48.57% and 53.00%, respectively. Among them, the q value of the population density dominant factor and per capita GDP in the dominant interaction factor is the largest, which is 57.70% and 62.19%, respectively, which is 26.79% and 29.56% higher than that of a single dominant factor. Results show that in the case of population density growth, the rapid growth of per capita GDP has the greatest impact on PM2.5 concentration.
Discussion
Existing studies have explored the mechanistic role of PM2.5 in air pollution using approaches based on land use models, nighttime light data, and employing methods such as random forest regression and spatiotemporal dynamics. ZHOU Liang et al. utilized geostatistics, geographic detectors, and spatial analysis techniques to assess the spatiotemporal evolution patterns and driving factors of PM2.5 concentration in China [32, 33]. In a parallel study, Jianhua Cheng et al. employed statistical analysis, hotspot analysis, spatial autocorrelation, mean centers, and geographic detectors to investigate the spatiotemporal variations in the air quality index of major Chinese cities. Their findings revealed that forested areas and industrial land use exerted a more substantial influence on PM2.5 concentration than other land use types.
Considering this, this study departs from traditional single-scale research and adopts a spatial multiscale perspective. Drawing upon annual average PM2.5 concentration data spanning the years 2009 to 2018 and urban socioeconomic data, as well as utilizing atmospheric PM2.5 remote sensing inversion datasets, a comprehensive approach that integrates GIS spatial-temporal analysis and geographic detectors is employed. The objective of this investigation is to examine the spatiotemporal evolution characteristics of PM2.5 in the Yangtze River Basin from 2009 to 2018, along with an exploration of its influencing factors.
Population and urbanization factors, industry and energy consumption factors, and traffic factors have varying degrees of influence on the temporal and spatial distribution of PM2.5. The material transmission and exchange in the atmosphere is uneven, causing local circulation in the city, thereby changing the atmospheric environment, and resulting in PM2.5 Concentrations exhibit spatial heterogeneity. These factors can significantly affect the spatial-temporal heterogeneity of PM2.5. How to identify the dominant factors accurately and explore the interaction mechanism of different factors is a difficult and innovative point in the study of air pollution influencing factors.
The detection results of interactive dominant factors reveal that the interaction between population density and per capita GDP, the proportion of urban built-up areas, and industrial smoke and dust emissions have a huge impact on PM2.5 concentration. The research results show that the population density and the proportion of urban built-up area in the population and urbanization index layer are the dominant factors. Population density is closely related to the intensity of human activities. The higher the population density, the higher the intensity of human activities, and the higher the PM2.5 concentration. This relationship occurs mainly because the increase in population density leads to an increase in the demand for housing and travel and building construction projects brings environmental pollution. The increase in car ownership also brings more exhaust emissions, producing a large amount of nitrogen oxides and pollutants, such as carbon dioxide and sulfur dioxide. At the same time, human activities after population aggregation bring more production and domestic waste. The incineration of domestic waste and the combustion of industrial raw materials lead to an increase in PM2.5 concentration. Empirical studies in developed countries have shown that high-density residential areas bring more serious air pollution. Therefore, the population density must be further reduced to decrease the concentration of PM2.5 [34].
The dominant factor in 2009 and 2018 is the proportion of urban built-up areas, and its interaction with other factors can significantly enhance the intensity of another factor. Urban construction land is the main area of human activities and energy consumption and the main source landscape of air pollution. Green spaces can reduce PM2.5 by adsorbing and purifying air pollutants through vegetation. Many international studies have shown that land use factors are closely related to PM2.5 concentration, and different land use types have different effects on air pollution. Construction land is the most influential factor of PM2.5 concentration in many land use types. The larger proportion of urban construction land indicates that more frequent economic activities occur in the city, which bring more air pollutants. The development degree of Chinese cities is mainly related to the area of construction land, which is also consistent with the conclusion of international research. The urban construction land shows accumulation characteristics. When the scale of construction land is large, the residents’ living, industrial activities, economic activities, and traffic behavior on the construction land bring considerable air pollution.
Urban industry and energy consumption are also important factors affecting air pollution. This study explores the impact mechanism from the perspective of industrial structure, technological innovation, and industrialization level. In addition to exploring the direction and degree of influence of the secondary industry on PM2.5 concentration, the influence mechanism of the tertiary industry on PM2.5 concentration was further explored. From 2009 to 2015, China’s industrialization level had an increasing impact on PM2.5 concentration, and its source landscape function continuously improved. From 2015 to 2018, the impact of the industrialization level decreased significantly, indicating that China’s industrial structure and industrial transformation strategy are conducive to alleviating air pollution and creating a “blue sky.” The influence of the proportion of personnel in the tertiary industry and the variable of science and technology expenditure has been remarkable for a long time, and the parameters are high. Highlighting the service industry and technology can considerably improve the air environment. Science and technology expenditure mainly represents the city’s emphasis on industrial science and technology progress, which brings greener and more efficient industrial technology, reduce pollutant emissions, and improve air quality.
Urban traffic is closely related to air pollution. Vehicle emissions are an important source of PM2.5 pollution. However, this study examines the mechanism of traffic on PM2.5 from the two variables of urban road area and urban bus volume. The urban road area reflects the number of urban cars from the side. The larger the number of cars, the larger the road area delineated in the process of urban planning and urban construction, and the more automobile exhaust emissions, which reflects the significant improvement effect of urban road area on PM2.5 concentration. The total amount of urban public transport can alleviate urban air pollution. The significant difference between public transportation and car commuting lies in commuting efficiency, commuting capacity, and pollution emissions. Cities around the world are implementing policies to reduce the use of motor vehicles and prioritize the development of public transportation to solve traffic congestion, air pollution and greenhouse gas emissions. Private car travel increases the traffic burden, causes traffic congestion and parking conflicts, and reduces air quality and environmental quality. Therefore, the encouragement of public transportation, especially in high-density residential areas, significantly reduce PM2.5 concentrations and improve air environmental quality.
This study investigates PM2.5 in the Yangtze River Basin mainly from the perspective of socioeconomic factors but does not involve natural factors (such as wind speed, sunshine speed, air humidity, temperature, and rainfall), which may also have a significant impact on PM2.5 pollution. In the later stage, the quarterly or monthly changes in the annual average concentration of PM2.5 must be studied further for the joint prevention and control of air pollution.
In response to the problem of PM2.5 emissions caused by human activities in the Yangtze River Basin, the government can alleviate the problem of high population density by optimizing the population layout and formulating effective population migration policies. The industrial structure must be adjusted, the development of low-pollution green industries must be prioritized without restricting industrial development and economic downturns, support for policies on green industries must be increased, and the transformation of investment and industrial structures must be promoted. Furthermore, the transportation system must be optimized, the popularization of new energy vehicles must be encouraged and supported, advanced public transportation systems must be used, and the utilization rate of motor vehicles must be reduced through reasonable traffic diversion. In the case of moderate urban construction and development, scientific and technological innovation should be increased, industrial transformation should be accelerated, and the impact of human activities on PM2.5 should be prevented and controlled.
Conclusion
(1) The proportion of cities with PM2.5 annual average concentrations below 35 μg/m3 (China’s annual average limit) continued to increase from 12.38% in 2009 to 55.75% in 2018. After reaching the highest value of 14.16% in 2010, the proportion of cities exceeding the 75 μg/m3 level, followed by a wave-like decline, did not appear until 2014. From 2009 to 2014, the proportion of the number of cities with an average annual PM2.5 concentration exceeding 35 μg/m3 had the most evident change, showing a trend of “rising first and then falling” from 87.61% to 44.25%, nearly doubling the rate of decrease. Therefore, from 2009 to 2018, the number of cities with low PM2.5 concentrations increased, whereas the number of cities with high PM2.5 concentrations decreased, and urban air pollution improved with relevant government control.
(2) The overall PM2.5 concentration in the Yangtze River Basin is higher in the east and lower in the west, with different interannual changes in different regions. The low-value areas of PM2.5 concentration below 35 μg/m3 are mainly concentrated in the upper reaches of the Yangtze River Basin. The PM2.5 concentration has a small change trend in this area, but the change is more significant in the northeastern area. The high-value areas of more than 50 μg/m3 were mainly concentrated in the middle and lower reaches of the Yangtze River Basin. The distribution of low-value areas for the overall annual average concentration of PM2.5 was relatively stable, and the high-value areas showed a trend of “first decreasing, then increasing, and then decreasing.
(3) The spatial-temporal agglomeration effect is evident, showing an agglomeration pattern of “east-hot, west-cold.” From 2009 to 2018, the high-value clusters expanded to the central part of the Yangtze River Basin and then shrank to the north. The middle reaches and lower reaches of the Yangtze River have always maintained high-value clusters. The low-value accumulation area is concentrated in the western region of the Yangtze River Basin and other places, and the trend of range change is not significant.
(4) While each variable concurrently engages in interactions, they also exhibit varying degrees of influence on the spatiotemporal distribution of PM2.5. Among them, population density and the proportion of urban built-up areas in the population and urbanization index layer are the dominant factors, and the interaction between population density and per capita GDP, the proportion of urban built-up areas, and industrial smoke and dust emissions have a great impact on PM2.5 concentration. The Yangtze River Basin must be under the condition of moderate urban construction and development and must increase scientific and technological innovation and accelerate industrial transformation to prevent and control the impact of human activities.

