

Introduction
In the 75th session of the United Nations General Assembly in 2020, China announced its goal to peak carbon emissions by 2030 and achieve carbon neutrality by 2060 [1, 2]. As one of the major sources of global carbon emissions, the construction industry is a critical sector for China to achieve its “dual carbon” targets [3, 4]. According to the China Building Energy Consumption and Carbon Emission Research Report published by the China Association of Building Energy Efficiency, the total energy consumption of the entire construction process in China reached 2.27 billion tons of standard coal in 2020, accounting for 45.5% of the national energy consumption. By 2060, energy demand in the construction sector is projected to increase by 50% [5], highlighting the significant importance of controlling carbon emissions in this industry to achieve national energy conservation and emission reduction goals [6]. However, the long-term reliance on high-carbon fossil fuels in the construction industry has resulted in a pronounced carbon lock-in effect [7]. Therefore, exploring the total carbon emissions, identifying carbon lock-in characteristics, and devising feasible carbon unlock pathways are crucial steps toward achieving the sector’s “dual carbon” targets.
Extensive research has been conducted on carbon emissions in the construction industry from various perspectives, primarily focusing on carbon emission measurement, carbon emission efficiency evaluation, and analysis of factors influencing carbon emissions. Regarding carbon emission measurement, methods such as input-output analysis [8], life cycle assessment [9], and IPCC carbon emission accounting [10] have been widely adopted. Among these, the IPCC carbon emission accounting method is extensively used due to its simplicity in calculating carbon emissions across industries using emission factors [11, 12]. Researchers have utilized various models in evaluating carbon emission efficiency, such as the total-factor energy efficiency framework [13] and the generalized data envelopment analysis model [14], to investigate energy utilization efficiency in the construction sector. Analytical frameworks that treat carbon emissions as undesirable outputs have also been employed to optimize the construction industry’s evaluation of carbon emission efficiency. For analyses of influencing factors, most studies have examined aspects such as population size [15], economic development [16], energy intensity [17, 18], and industrial structure [19, 20]. Findings indicate that energy intensity is the primary factor suppressing carbon emission growth, whereas economic growth and urbanization are the key drivers of increasing carbon emissions.
However, existing studies predominantly focus on measuring and analyzing total carbon emissions and efficiency, with limited systematic evaluation of the pressure exerted by construction-related carbon emissions on ecosystems. Most previous studies have analyzed carbon emissions from the perspective of direct emissions and efficiency, but few have examined the ecological burden imposed by these emissions. As a comprehensive indicator, ecological carbon footprint converts carbon emissions into the land area required for ecosystems to absorb these emissions, thus quantifying the impact of carbon emissions on ecosystems [21]. This indicator not only reflects the total carbon emissions but also reveals their spatial distribution characteristics across regional ecological resources. Unlike conventional carbon emission studies, which focus primarily on economic and technological aspects, the ecological carbon footprint approach offers an integrated perspective that links carbon emissions with regional ecological capacity, providing a more holistic understanding of the environmental burden of the construction industry. Consequently, ecological carbon footprint analysis provides a novel perspective for comprehensively assessing the relationship between construction industry carbon emissions and economic development. It facilitates a deeper understanding of the construction industry’s regional characteristics and driving mechanisms in achieving the “dual carbon” targets.
This study contributes to the literature by systematically analyzing the spatiotemporal evolution of carbon emissions in the construction industry from the perspective of ecological carbon footprints, emphasizing regional disparities and the ecological burden of emissions. Incorporating spatial econometric techniques bridges the gap between carbon emission analysis and ecological impact assessment, offering a more nuanced understanding of the spatial distribution and development trends of carbon emissions in China’s construction sector. Based on the theory of ecological carbon footprint and spatial econometric analysis methods, this study integrates the decoupling model, Theil index, and spatial autocorrelation analysis to comprehensively examine the spatiotemporal evolution and regional disparities of carbon emissions in China’s construction industry. By unveiling the dynamic changes in carbon emissions and their ecological pressures, it provides novel insights into how regional variations in carbon emissions relate to economic growth and ecological sustainability, which has important policy implications for achieving low-carbon development and regional carbon reduction coordination.
Materials and Methods
Carbon Emission Calculation for the Construction Industry
This study employs the carbon emission coefficient method to calculate carbon emissions in the construction industry, dividing them into direct and indirect emissions [22]. Direct emissions stem from energy consumption during construction activities, while indirect emissions are derived from the production of construction materials consumed by the industry. Based on the IPCC 2006 Guidelines for National Greenhouse Gas Inventories [23], this study selects 12 primary energy sources, such as raw coal and coke, as direct sources of carbon emissions, and 5 construction materials, such as cement and steel, as indirect sources. The calculation formula is as follows:
Table 1.
Carbon emission factors associated with energy sources.
Where C, Cdir, and Cind represent total carbon emissions, direct carbon emissions, and indirect carbon emissions in the construction industry, respectively; Ei and Mj are the consumption of energy i and construction material j, respectively; ai and βj are the carbon emission coefficients for energy i and construction material j, respectively; εj is the recycling coefficient for construction material j. The constants 44 and 12 represent the molecular weight of CO2 and the atomic weight of carbon, respectively. Carbon emissions are converted into CO2 emissions by multiplying by 44/12. The carbon emission coefficients for various energy sources and construction materials are shown in Tables 1 and 2 [24, 25].
Decoupling Status of Carbon Emissions in the Construction Industry
To evaluate the relationship between the ecological carbon footprint of the construction industry and economic growth, this study adopts the Tapio decoupling model to calculate the Decoupling Index (DI) between the carbon footprint and the output value of the construction industry in various provinces [26, 27]. The Tapio model compares the rate of change in carbon footprint with the rate of change in economic output. The formula is as follows:
Where Δ represents the difference between two time periods; C represents the carbon emissions of the urban construction industry; G represents the total output value of the construction industry; E represents the Decoupling Index. Based on these metrics, the decoupling status is classified into six categories (Table 3). Strong decoupling indicates a reduction in the carbon footprint alongside economic growth, representing an ideal low-carbon development model. This state often reflects successful coordination between economic expansion and carbon reduction achieved through technological advancements, energy structure optimization, or policy interventions. This is commonly observed in scenarios where green building technologies, renewable energy adoption, or new construction materials are widely implemented. In contrast, weak decoupling occurs when the carbon footprint increases but at a slower rate than economic growth. This indicates that the construction industry has partially achieved emission reduction targets, though environmental burdens persist. This state suggests that energy-saving and emission-reduction measures are beginning to take effect but require further optimization. Expansive negative decoupling reflects a situation where the carbon footprint grows faster than economic output, signifying increasing environmental pressure due to economic development. This unsustainable state is often found in regions with expanding energy-intensive industries or lacking effective emission reduction policies.
Table 2.
Carbon emission factors associated with construction materials.
| Material Type | Steel | Wood | Cement | Flat Glass | Aluminum |
|---|---|---|---|---|---|
| Carbon Emission Factor | 1.789kg·kg-1 | -842.8kg·m3 | 0.815kg·kg-1 | 0.966kg·kg-1 | 2.6kg·kg-1 |
| Recycling Coefficient | 0.8 | 0.2 | 0.0 | 0.7 | 0.85 |
Table 3.
Decoupling state discrimination.
In the context of economic downturns, decoupling statuses exhibit different characteristics: Recessive decoupling occurs when carbon emissions decline as economic activity contracts, but the reduction in emissions is smaller than the economic decline. This often results from passive emission reductions, indicating that fundamental improvements in carbon emissions have not been achieved. Recessive negative decoupling reflects a sharp reduction in economic activity accompanied by an even greater decrease in carbon emissions. This state is often driven by industrial restructuring or policy-enforced interventions. Strong negative decoupling is the least favorable state, where economic recession coincides with increased carbon emissions. This scenario typically indicates declining energy efficiency or failed environmental governance, representing a dual economic and environmental crisis.
Ecological Carbon Footprint of the Construction Industry
This study applies the ecological footprint method to calculate the ecological carbon footprint of the construction industry, aiming to quantify the industry’s carbon emission pressure on the ecological environment and analyze its regional distribution and trends. Based on energy consumption data from the construction industry in 30 provinces in China from 2012 to 2021, combined with a carbon sequestration capacity calculation model grounded in Net Primary Productivity (NPP) [28], the study systematically estimates the impact of construction activities on ecosystems. The calculation of the ecological carbon footprint begins with determining the ecological area required to absorb carbon emissions, with carbon sequestration capacity being the key factor. This study calculates carbon sequestration capacity using the NPP-based formula:
Where Cabs represents the carbon sequestration capacity of a unit area of the ecosystem (tons/hectare); NPP is the net primary productivity (tons of dry matter/ hectare/year); β is the carbon absorption coefficient, indicating the amount of carbon fixed per ton of dry matter (commonly set at 0.47). This study employs remote sensing data and land use information to derive NPP values for different land types across provinces. Combined with land cover area data, the total carbon sequestration capacity of various ecosystem types can be calculated. After determining the carbon sequestration capacity, the ecological carbon footprint is calculated using the following formula:
Where CFeco represents the ecological carbon footprint (hectares); C is the carbon emissions of the construction industry (tons); Cabs is the carbon sequestration capacity per unit area (tons/hectare). By integrating carbon emissions from the construction industry with the carbon sequestration capacity of ecosystems, the ecological carbon footprint quantifies the ecological area required to absorb the emissions. This approach allows for assessing the environmental pressure exerted by the construction industry.
Theil Index
To quantify regional disparities in the ecological carbon footprint of the construction industry across 30 provinces in China, this study employs the Theil index, a statistical measure based on information entropy that evaluates data distribution inequality [29, 30]. By decomposing the total disparity, the Theil index provides insights into the sources of differences, facilitating an understanding of the spatial distribution characteristics of the ecological carbon footprint in the construction industry. The overall formula for the Theil index is:
Where T represents the overall Theil index, reflecting the inequality in the distribution of the ecological carbon footprint across all provinces; N is the total number of provinces; yi is the ecological carbon footprint value of province i;
Where R is the number of regions, Nr is the number of provinces in region r; and
TD reflects the inequality in the distribution of the ecological carbon footprint within each region and is calculated as:
Where Tr is the Theil index for region r; calculated using the same method as the total Theil index.
Spatial Autocorrelation Analysis
To explore the spatial distribution characteristics and regional clustering of the ecological carbon footprint in the construction industry, this study adopts spatial autocorrelation analysis, including both global and local spatial autocorrelation analyses [31]. Spatial autocorrelation analysis quantitatively measures the spatial correlation of the ecological carbon footprint in the construction industry, revealing its spatial distribution patterns and regional disparities.
Global Spatial Autocorrelation Analysis
Global spatial autocorrelation is assessed using the Global Moran’s I index, which evaluates the overall spatial distribution pattern of the ecological carbon footprint of the construction industry across the entire study area [32]. The calculation formula for Global Moran’s I is:
Where n is the number of study units (provinces); Wij is the spatial weight matrix, indicating the spatial adjacency relationship between units i and j; xi are the ecological carbon footprints of units i and j, respectively;
Local Spatial Autocorrelation Analysis
To further explore spatial heterogeneity and identify specific regional spatial correlation patterns, this study employs Local Indicators of Spatial Association (LISA) to evaluate the spatial correlation of the ecological carbon footprint within regions. The LISA index is calculated using the following formula:
Where Ii is the local spatial autocorrelation index for unit iii and n, Wij, xi, xj, and
Regional Divisions of the Study Area
Mainland China is typically divided into three regions – eastern, central, and western – based on geographical location and economic development levels. This division not only considers natural geographic conditions but also reflects each region’s economic development stages and industrial structure characteristics. The eastern region includes Beijing, Tianjin, Hebei, Liaoning, Shanghai, Jiangsu, Zhejiang, Fujian, Shandong, and Guangdong. These provinces and cities are located in coastal areas, constituting China’s most economically developed region with high levels of urbanization and population density. The eastern region has a strong industrial foundation, with significant proportions of tertiary and high-tech industries, an optimized energy structure, and an early adoption of green building technologies. It plays a leading role in achieving China’s “dual carbon” goals. The central region includes Shanxi, Inner Mongolia, Jilin, Heilongjiang, Anhui, Jiangxi, Henan, Hubei, and Hunan. Positioned in the heartland of China, this region serves as a critical hub connecting the eastern and western regions. The central region’s economy is primarily based on agriculture and heavy industry. In recent years, industrialization and urbanization processes have accelerated; however, coal remains the dominant energy source, and the carbon emission pressures from the construction industry are significant. As such, the central region is a key focus area for China’s low-carbon transition. The western region comprises Chongqing, Sichuan, Guizhou, Yunnan, Shaanxi, Gansu, Qinghai, Ningxia, and Xinjiang. Characterized by complex terrain and abundant natural resources, the western region has relatively low levels of economic development. Infrastructure construction and urbanization are advancing rapidly, driving the swift growth of the construction industry and a notable increase in carbon emissions. At the same time, the western region boasts rich clean energy resources, such as hydropower, wind power, and solar energy, making it a strategic area for China’s future low-carbon development. Due to data availability issues, this study does not include Tibet, Hong Kong, Macao, and Taiwan in its research scope.
Data Sources
This study focuses on the ecological carbon footprint of the construction industry in 30 provinces of China from 2012 to 2021. The required data include construction industry energy consumption, land use, net primary productivity (NPP), and economic statistics. Energy consumption data for the construction industry are sourced from the China Energy Statistical Yearbook and the China Statistical Yearbook. These data cover the consumption of coal, petroleum, natural gas, and other energy types, expressed in ten thousand tons of standard coal, providing the basis for calculating carbon emissions in the construction industry. Consumption data for steel, wood, cement, and flat glass are obtained from the China Building Statistical Yearbook. Land use data are derived from the annual land use dynamic monitoring data published by the National Bureau of Statistics and land resource departments. These data include the area distribution of different land types (e.g., forests, arable land, grassland) in each province and are used to estimate the carbon sequestration capacity of various ecosystems. NPP data come from MODIS satellite remote sensing monitoring (MOD17A3HGF product) with a resolution of 500 meters. Remote sensing images are used to extract NPP values for different land types in each province, and regional total carbon sequestration capacity is calculated by combining NPP values with land area data. The NPP data have undergone standardized correction and interpolation to ensure temporal and spatial consistency and comparability. Economic data for the construction industry, such as output value and investment scale, are obtained from the China Statistical Yearbook and provincial statistical yearbooks. These data provide essential support for analyzing the relationship between the ecological carbon footprint and economic activities in the construction industry.
Results
Total Carbon Emissions in the Construction Industry
From 2012 to 2021, China’s total carbon emissions from the construction industry showed a fluctuating upward trend, increasing from 5.83×10⁷ tons in 2012 to 6.61×10⁷ tons in 2021. Although certain years (e.g., 2016) witnessed temporary declines, the overall carbon emission pressure intensified. The dynamic changes in total carbon emissions varied significantly among the eastern, central, and western regions, exhibiting pronounced spatial differences.
In the eastern region, carbon emissions gradually decreased over the study period, falling from 2.44×10⁷ tons in 2012 to 2.08×10⁷ tons in 2021. This decline is likely closely related to the region’s industrial upgrading and energy structure optimization. However, some provinces, such as Tianjin, experienced continuous growth in carbon emissions during the study period, indicating persistent regional challenges in advancing low-carbon transitions.
In the central region, total carbon emissions generally increased during the study period, with Henan Province showing a particularly sharp rise from 1.46×10⁶ tons to 8.01×10⁶ tons. This highlights the significant carbon emission pressure accompanying rapid economic growth in the central region.
In the western region, carbon emissions showed a gradual upward trend overall. Sichuan Province, in particular, exhibited a remarkable increase, with emissions rising from 2.48×10⁶ tons in 2012 to 4.80×10⁶ tons in 2021. This reflects the high-carbon characteristics of urbanization and infrastructure development in the western region.
From a regional perspective, the proportion of total national carbon emissions contributed by the eastern region steadily declined during the study period, while the shares of the central and western regions increased. This trend illustrates a shift in construction industry carbon emissions from the eastern region to the central and western regions. This shift may be attributed to accelerated industrialization and urbanization in the central and western regions, alongside a higher reliance on energy-intensive activities in the construction industry. The eastern region has achieved initial success in reducing carbon emissions through industrial upgrading, energy structure optimization, and energy-saving technology adoption, whereas the central and western regions remain in a high-carbon development phase. Such imbalances have further exacerbated disparities in the spatial distribution of carbon emissions.
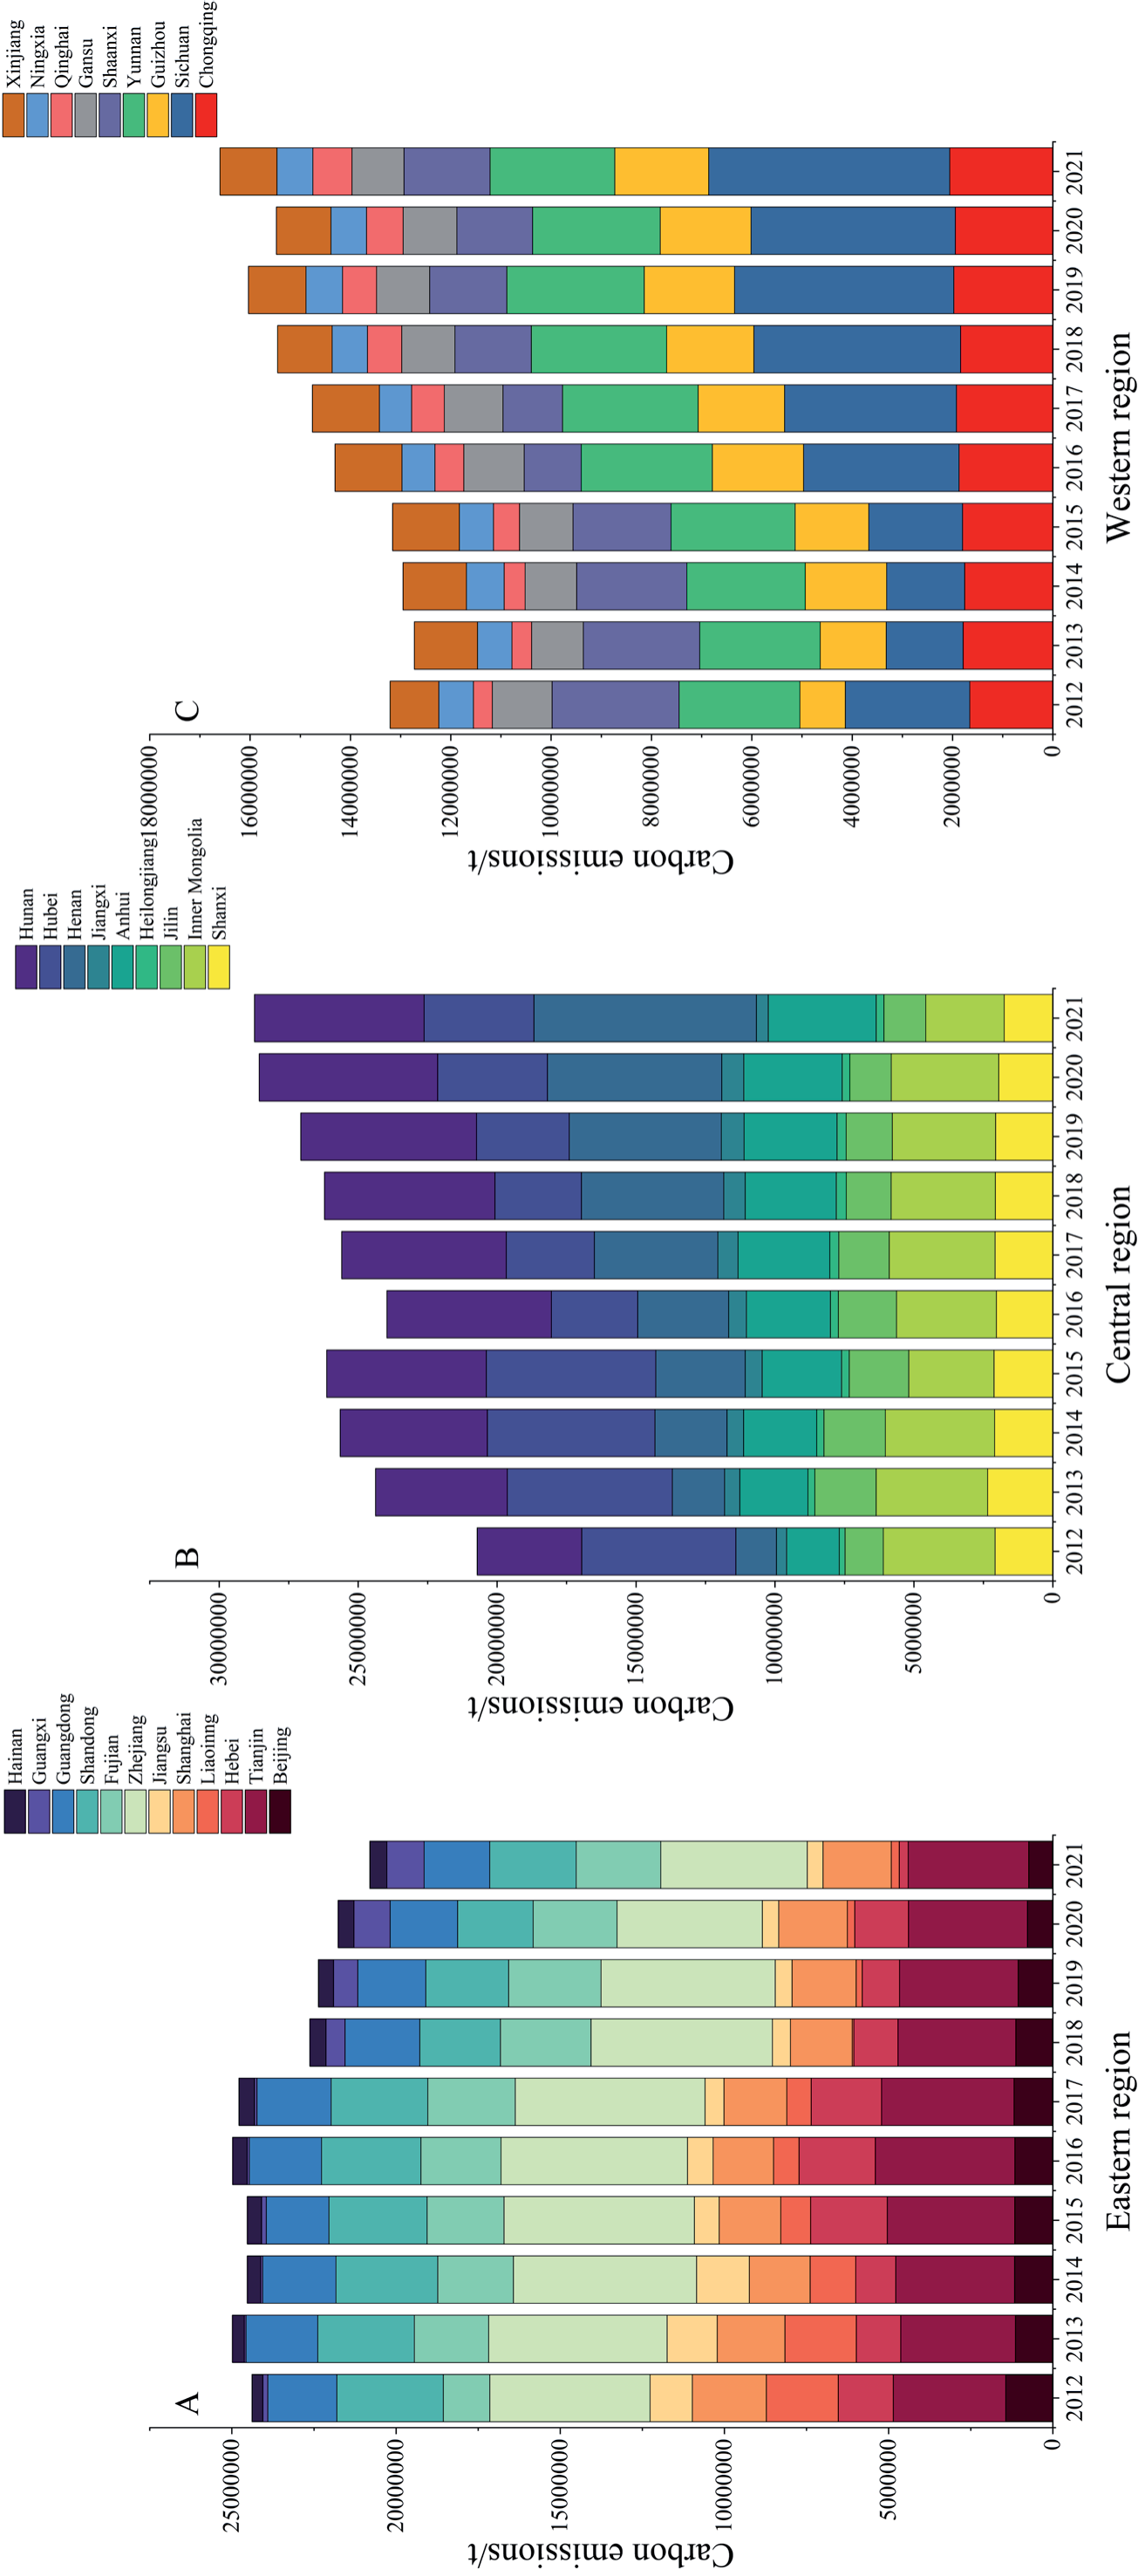
At the provincial level, dynamic changes in carbon emissions showed notable differences. Provinces such as Henan and Sichuan experienced rapid growth in carbon emissions, indicating higher energy consumption intensity in their construction industries and potentially slower adoption of low-carbon technologies. In contrast, economically developed regions such as Beijing and Shanghai saw continuous declines in carbon emissions during the study period, reflecting the significant contributions of energy-saving technologies, green building policies, and industrial upgrading to emission reductions.
A few provinces, such as Tianjin and Xinjiang, though starting from a lower carbon emissions baseline, exhibited noticeable growth trends that warrant attention.
Further analysis of intra-regional differences revealed that disparities among provinces within the eastern region narrowed over time while those within the central and western regions widened. For example, the gap in carbon emissions between Henan and Jiangxi in the central region continued to expand, likely due to differences in economic development levels, construction industry scales, and energy structures. Similarly, disparities among provinces in the western region were significant, with Sichuan’s carbon emissions rising rapidly while Ningxia and Qinghai maintained relatively stable levels. These differences not only reflect the diversity of development models within regions but also suggest variations in the applicability of policies and technologies across regions (Fig. 1).
Decoupling Relationship between Carbon Emissions and Economic Development in the Construction Industry
To evaluate the coordination between carbon emissions and economic growth in China’s construction industry, this study uses the Tapio decoupling model to analyze the decoupling relationship across 30 provinces from 2012 to 2021. At the national level, the overall decoupling status during this period is classified as “weak decoupling”, indicating that decoupling between carbon emissions and economic growth has not been fully achieved, and the carbon emission pressure from the construction industry remains significant. However, there are notable differences in decoupling types across regions and provinces, reflecting imbalances in regional economic development and low-carbon transition progress.
From a regional perspective, the eastern region exhibited a “weak decoupling” status between 2012 and 2016 but transitioned to “strong decoupling” during both 2016-2021 and the overall study period (2012- 2021). This suggests significant achievements in carbon reduction and green development, likely driven by industrial upgrading, technological innovation, and the implementation of green building policies. In contrast, the central and western regions remained in a state of “weak decoupling” throughout the study period, indicating that the growth rate of carbon emissions has not yet been fully decoupled from economic growth. This phenomenon may be associated with these regions’ rapid urbanization and industrialization phases, which are characterized by high energy consumption intensity in the construction industry and insufficient promotion of low-carbon technologies.
At the provincial level, the decoupling types varied significantly. In the eastern region, Beijing, Jiangsu, Shanghai, and Shandong maintained a “strong decoupling” status throughout the study period, reflecting the notable success of these economically developed provinces in advancing low-carbon buildings, optimizing energy structures, and improving construction efficiency. However, Tianjin and Zhejiang displayed a “recessive negative decoupling” status during 2016-2021, indicating that while economic growth slowed, carbon emissions did not decrease effectively. This may result from slow energy structure adjustments or inadequate promotion of green technologies.
In the central region, Henan consistently exhibited an “expansive negative decoupling” status during the study period, indicating that economic growth in its construction industry was accompanied by rapid increases in carbon emissions, leading to substantial emission reduction pressures. Conversely, Shanxi and Hubei achieved “strong decoupling” during 2012-2021, likely attributable to energy structure optimization and effective implementation of energy-saving and emission-reduction policies.
The decoupling characteristics of the western region were relatively uniform, with most provinces, including Chongqing, Sichuan, and Guizhou, showing “weak decoupling”, indicating a continued reliance on high-carbon energy sources for construction industry development. However, Gansu achieved “strong decoupling” during 2016-2021, reflecting efforts toward a green transformation in its construction industry.
The differences in decoupling types highlight the uneven development stages of the construction industry and the progress of low-carbon transitions across regions. The eastern region has taken the lead in achieving “strong decoupling”, demonstrating the effectiveness of green development policies and technology dissemination. In contrast, the central and western regions have yet to achieve significant decoupling due to variations in economic development stages and policy implementation intensity. Provinces such as Henan in the central region and Qinghai in the western region have persistently exhibited “expansive negative decoupling”, indicating the persistence of high-carbon economic development models.
Table 4.
Decoupling Relationship between Carbon Emissions and Economic Development in China’s Construction Industry.
From a temporal perspective, most provinces in the eastern region achieved “strong decoupling” between 2016 and 2021, and some provinces in the central and western regions, such as Yunnan and Gansu, also demonstrated progress in decoupling during this period. This suggests an accelerated green transition nationwide. However, the overall decoupling status at the national level remains “weak decoupling”, indicating that the systemic reduction of carbon emissions in the construction industry and its coordination with economic growth still require further improvement (Table 4).
Ecological Carbon Footprint of the Construction Industry
From 2012 to 2021, China’s construction industry’s total ecological carbon footprint showed a fluctuating upward trend, increasing from 7.38×10⁴ tons/km2 to 7.55×10⁴ tons/km2. Although there was a temporary decline in 2016, the overall footprint remained at a high level. This trend indicates that the carbon pressure exerted by the construction industry on ecosystems remains substantial during economic development, and transitioning to a low-carbon model requires sustained effort.
At the regional level, the ecological carbon footprint varied significantly across the eastern, central, and western regions. The eastern region experienced a general decline in its carbon footprint, decreasing from 2.77×10⁴ tons/km2 in 2012 to 2.25×10⁴ tons/km2 in 2021. This reduction is likely associated with promoting green building technologies and improving energy efficiency. However, some provinces, such as Zhejiang, maintained a relatively high ecological carbon footprint during the study period, reaching 6.37×10³ tons/km2 in 2016, reflecting the ecological pressure caused by high-density construction.
In contrast, the central region exhibited an upward trend in its ecological carbon footprint, rising from 2.35×10⁴ tons/km2 in 2012 to 3.10×10⁴ tons/km2 in 2021. This trend indicates that the rapid development of the construction industry in the central region has imposed considerable pressure on the ecological environment. Henan Province, in particular, showed a significant increase, with its carbon footprint rising from 1.66×10³ tons/km2 to 8.65×10³ tons/km2.
The western region’s ecological carbon footprint remained relatively stable, from 2.27×10⁴ tons/km2 in 2012 to 2.20×10⁴ tons/km2 in 2021. Despite the overall stability, certain provinces, such as Sichuan, saw a notable rise, particularly between 2017 and 2021, when its carbon footprint increased from 3.82×10³ tons/km2 to 5.19×10³ tons/km2. This may be linked to the accelerated infrastructure development and urbanization in the western region.
At the provincial level, changes in ecological carbon footprints varied widely. Developed provinces such as Beijing, Shanghai, and Jiangsu experienced significant declines in their carbon footprints during the study period, by approximately 50%, 13%, and 64%, respectively. This demonstrates the positive impact of energy-saving and emission-reduction policies, technological innovation, and energy structure optimization in these regions. In contrast, provinces such as Henan, Sichuan, and Fujian saw significant growth in their ecological carbon footprints, reflecting the ecological pressures associated with rapid development.
Some provinces showed uneven changes in ecological carbon footprints. For example, Guangxi’s footprint increased dramatically, from 1.68×10² tons/km2 to 1.23×10³ tons/km2, likely due to the rapid expansion of the construction industry and increased energy consumption in recent years. Meanwhile, Ningxia and Qinghai exhibited minimal changes in their footprints between 2012 and 2021, indicating relatively stable construction industry growth, though their low-carbon development capabilities still require improvement.
Table 5.
Ecological Carbon Footprint of China’s Construction Industry.
From a temporal perspective, the national ecological carbon footprint experienced significant fluctuations around 2016. The eastern region showed an overall decline, while the central and western regions exhibited upward trends. This suggests a shift in the spatial distribution pattern of carbon emissions and economic growth in China’s construction industry, with high carbon pressures gradually moving toward the central and western regions. Regional disparities have also widened, as the eastern region has made significant progress in low-carbon transitions, whereas the central and western regions face more arduous emission reduction tasks (Table 5).
Analysis of Regional Differences in Ecological Carbon Footprint
From 2012 to 2021, the overall Theil index of the ecological carbon footprint of China’s construction industry fluctuated from 0.0099 to 0.0142, reflecting varying levels of regional disparities in carbon footprint distribution across different years. The overall Theil index peaked in 2018 at 0.0142 and reached its lowest point in 2015 at 0.0099. These fluctuations suggest that multiple factors influence regional and intra-regional disparities in carbon footprint distribution during economic development and the low-carbon transition.
The intra-regional Theil index reflects disparities within individual regions. The intra-regional Theil index remained relatively low in the eastern region, averaging 0.0110, indicating a relatively balanced carbon footprint distribution. However, in certain years (e.g., 2013 and 2018), the intra-regional disparity increased significantly, reaching 0.0150 and 0.0158, respectively. This could be attributed to uneven application of green technologies and varying rates of construction industry development across provinces.
The intra-regional Theil index initially displayed a downward trend in the central region, decreasing from 0.0100 in 2012 to 0.0065 in 2018 but rising again to 0.0103 in 2021. This indicates that intra-regional disparities initially narrowed but have widened in recent years due to economic growth and the expansion of the construction industry. Major contributors to this disparity may include provinces with larger construction sectors, such as Henan and Shanxi.
The intra-regional Theil index fluctuated significantly during the study period in the western region, ranging from 0.0078 to 0.0135. Overall, disparities within the western region were more pronounced, likely due to differences in economic development levels and uneven progress in energy structure adjustments. For example, the significant differences in carbon footprint levels between Sichuan and Gansu may have amplified intra-regional disparities.
The inter-regional Theil index reflects differences in ecological carbon footprint distribution among the eastern, central, and western regions. During the study period, the inter-regional Theil index remained relatively low, ranging from 0.0002 to 0.0029, indicating that intra-regional factors rather than inter-regional differences primarily drove regional disparities in the construction industry’s ecological carbon footprint.
From a temporal perspective, the inter-regional Theil index peaked in 2018 and 2021 at 0.0027 and 0.0029, respectively, suggesting that disparities in carbon footprint distribution among the eastern, central, and western regions widened during these years. This may be related to the rapid growth of the construction industry in the central and western regions and continued carbon reduction efforts in the eastern region. In other years, the inter-regional Theil index remained relatively low, such as 0.0002 in 2013, indicating minimal inter-regional disparities.
Decomposition analysis shows that intra-regional differences primarily drove changes in the overall Theil index. While the eastern region had a relatively high overall carbon footprint, its distribution was more balanced internally. In contrast, the central and western regions exhibited significant internal disparities, particularly in the central region, where disparities have widened in recent years, reflecting regional development imbalances.
Table 6.
Regional Differences in the Ecological Carbon Footprint of China’s Construction Industry.
The relatively low intra-regional Theil index in the eastern region suggests that promoting green building technologies and implementing energy-saving policies have effectively fostered balanced regional development. Conversely, the higher internal disparities in the central and western regions highlight the uneven adoption of emission reduction technologies and policies. To achieve a more balanced distribution of the carbon footprint nationwide, greater attention should be given to addressing intra-regional disparities in the central and western regions (Table 6).
Global Spatial Autocorrelation Analysis of Ecological Carbon Footprint
Moran’s I index results indicate that from 2012 to 2021, the Moran’s I values for the ecological carbon footprint of China’s construction industry were all positive, ranging from 0.067 to 0.1103. This suggests a certain degree of positive spatial autocorrelation, meaning that similar values tended to cluster spatially to some extent. However, the overall Moran’s I values were relatively low and did not pass the significance test (P>0.05), indicating that the spatial correlation of the ecological carbon footprint across the country was weak and primarily characterized by random spatial distribution.
Over time, Moran’s I index declined from 0.1103 in 2012 to 0.0718 in 2021, reflecting a weakening spatial clustering in the ecological carbon footprint. Notably, from 2016 to 2021, Moran’s I values remained below 0.1, suggesting a trend toward a more uniform spatial distribution of the construction industry’s ecological carbon footprint nationwide. This trend could be attributed to the diffusion of green building technologies and emission reduction policies across regions, gradually narrowing spatial differences in carbon footprints.
In terms of Z-values and P-values, although Moran’s I index was relatively high in certain years (e.g., 2012 and 2015), the corresponding P-values consistently exceeded 0.05, failing to reach significance levels. This indicates that the spatial clustering of the ecological carbon footprint was weak and that its distribution was likely influenced by various random factors rather than being driven by clear spatial association patterns (Table 7).
Moran’s I index changes reflect the evolution of the spatial pattern of ecological carbon footprints. In the early period (2012-2015), higher Moran’s I values may be associated with concentrated construction activities in the eastern region and slower low-carbon development in the central and western regions, resulting in more pronounced spatial clustering effects. In the later period (2016-2021), as the construction industry rapidly developed in the central and western regions, interregional differences in carbon footprints narrowed, and random spatial distribution patterns became more evident.
Further analysis reveals that the weak spatial correlation of the Moran’s I index may be attributed to several factors:
1. Differences in the construction industry development models and energy structures among provinces.
2. Uneven regional adoption of green building policies and technologies.
3. Implementation of nationwide carbon emission control policies, which contributed to a more balanced distribution of ecological carbon footprints across regions.
These findings suggest that while regional disparities persist, efforts to promote green technologies and policies have gradually contributed to reducing spatial differences in carbon footprints, leading to a more uniform distribution over time.
Table 7.
Global Spatial Autocorrelation Analysis of the Ecological Carbon Footprint of China’s Construction Industry.
Local Spatial Autocorrelation Analysis
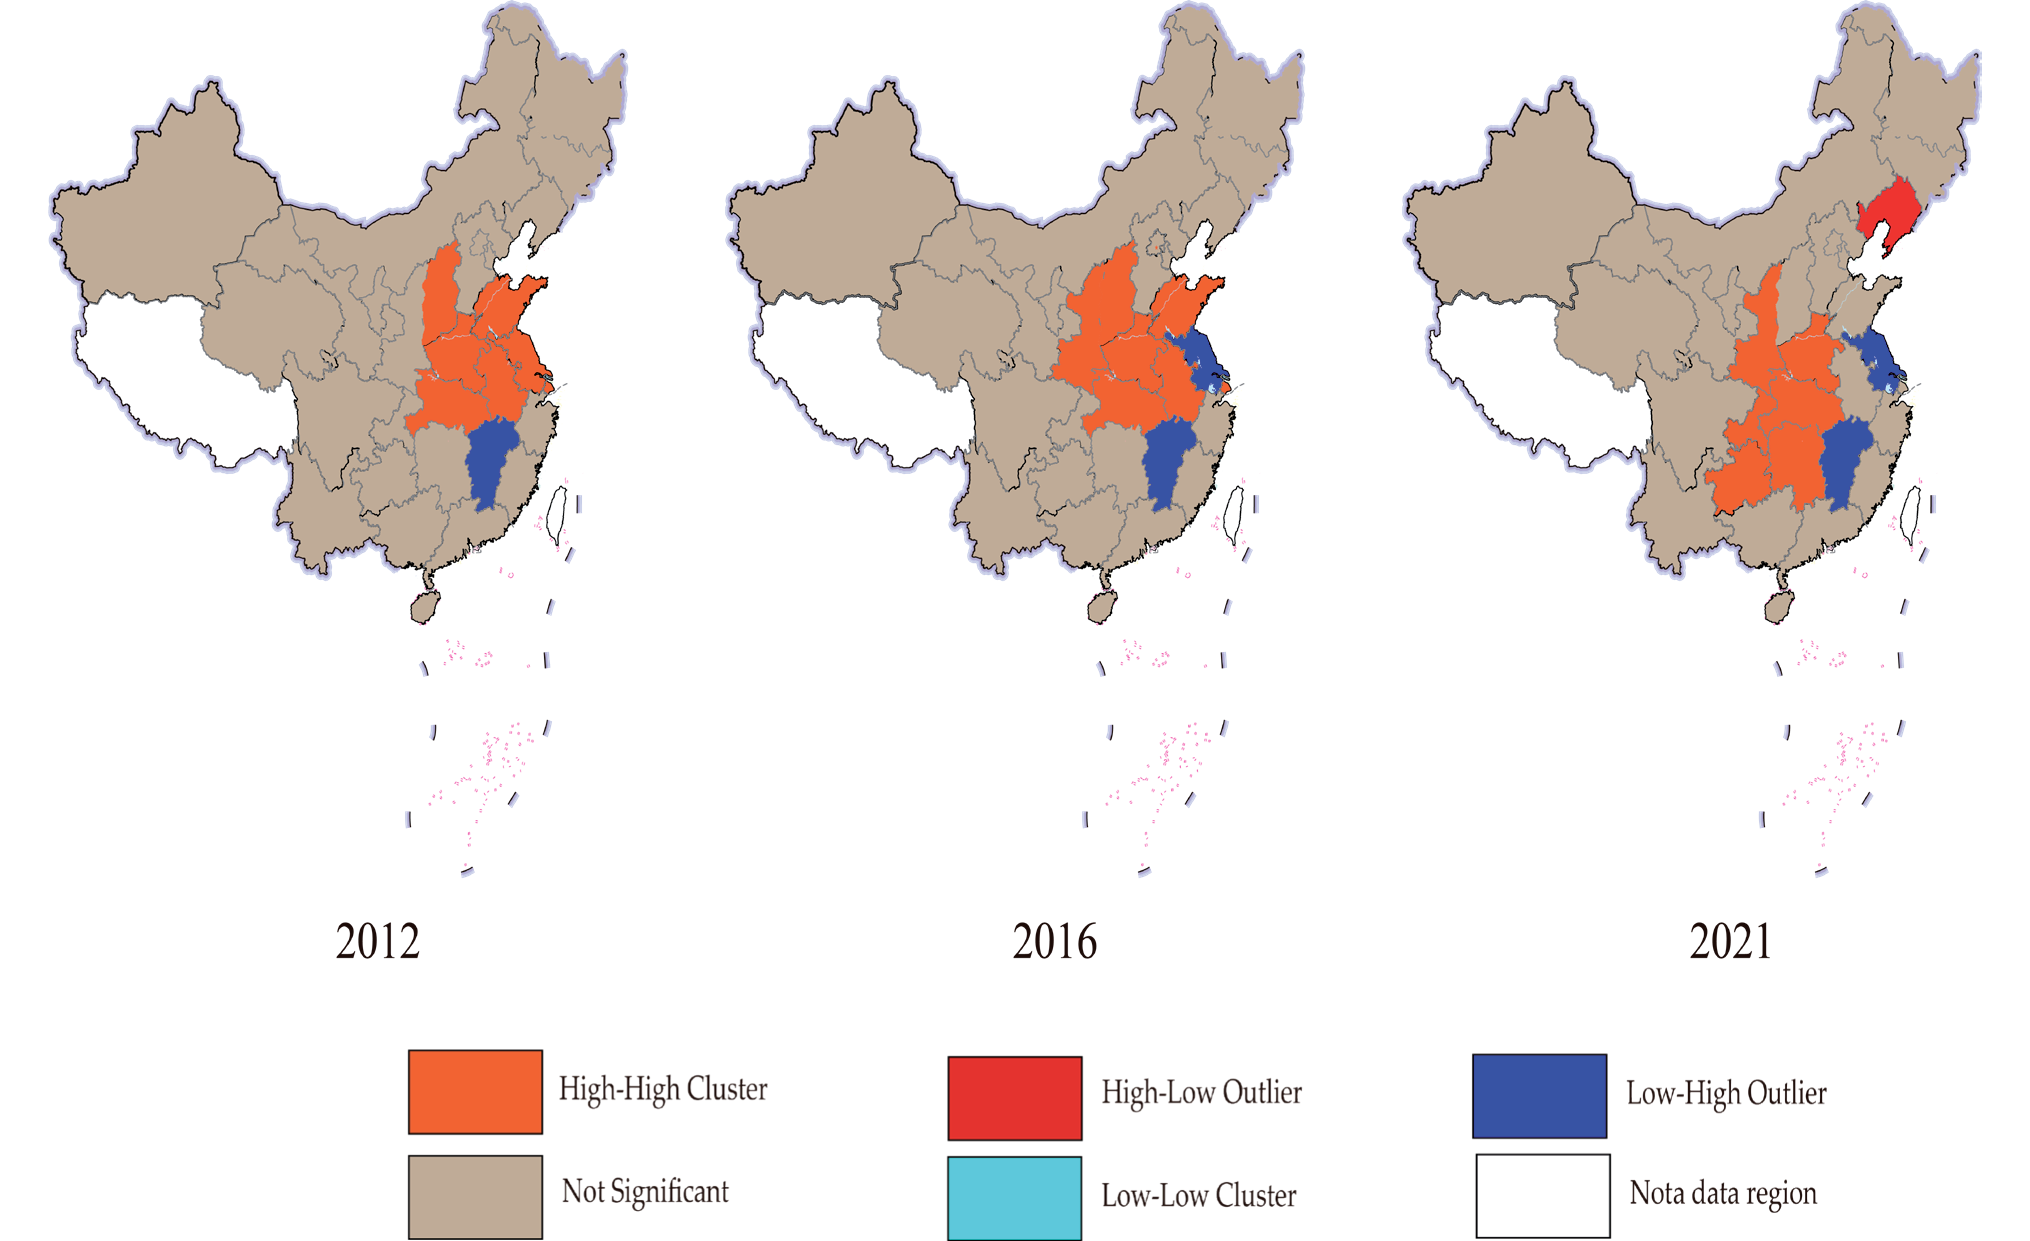
This study conducted a Local Indicators of Spatial Association (LISA) analysis for 2012, 2016, and 2021 to explore the spatial heterogeneity and clustering characteristics of China’s construction industry’s ecological carbon footprint. The results reveal significant patterns of high-high clustering and low-high outliers in the spatial distribution.
High-High Clustering
Regions with high-high clustering were primarily concentrated in the central and eastern regions, with significant dynamic changes observed over the study period. In 2012, high-high clustering areas included Shanxi, Henan, Anhui, Jiangsu, Shandong, Hubei, and Shanghai. These provinces, characterized by advanced construction industries and high ecological carbon footprints, exhibited strong interactions with neighboring high-value regions, forming significant clusters. By 2016, the high-high clustering range expanded to include Shaanxi, reflecting the growing influence of the western region’s construction industry on the distribution of carbon footprints. 2021 high-high clustering areas shifted southward, including Shaanxi, Henan, Hunan, Hubei, Guizhou, and Chongqing. This indicates that with the rapid development of the construction industry in the central and western regions, the clustering effect of carbon footprints in these areas has intensified.
Low-High Outlier Pattern
The low-high outlier pattern persisted in Jiangxi throughout the study period and extended to Jiangsu in 2016. This pattern suggests that these regions had relatively low ecological carbon footprints, contrasting sharply with the high footprints of their neighboring areas. This could be attributed to slower construction industry development and more effective promotion of green building technologies in Jiangxi and parts of Jiangsu, leading to lower carbon footprint levels than adjacent regions.
High-Low Outlier Pattern
In 2021, Jilin exhibited a high-low outlier pattern, indicating that Jilins’ construction industry had a high ecological carbon footprint, while its neighboring areas had lower footprints. This phenomenon reflects the uneven development of the construction industry in the northeastern region and highlights the potential spillover effects of high-carbon areas on adjacent low-carbon regions.
Dynamic Changes in Spatial Patterns
Analysis across the three time points reveals significant dynamic changes in the spatial distribution of the ecological carbon footprint. In 2012 and 2016, high-high clustering areas were mainly located in the central and eastern regions, which are traditional hubs of construction industry activity. By 2021, however, these high-high clustering areas had clearly shifted to the central and western regions. This change indicates that as construction industry activities have spatially shifted and green development policies have been gradually implemented, the central and western regions have become core areas for high-carbon footprint clustering.
The persistent presence of low-high and high-low outlier patterns underscores the construction industry’s uneven development levels and disparities in carbon footprint distribution across regions. These findings highlight the need to address regional imbalances in construction industry development and mitigate the spillover effects of high-carbon areas on neighboring low-carbon regions (Fig. 2).
Discussion
The results of this study demonstrate that from 2012 to 2021, the total carbon emissions of China’s construction industry exhibited a fluctuating upward trend, with significant regional differences in distribution and dynamics. In the eastern region, total carbon emissions gradually declined, reflecting the positive outcomes of green building technology adoption and low-carbon policy implementation in developed areas. In contrast, the central and western regions experienced significant increases in total carbon emissions, particularly in Henan and Sichuan provinces, indicating a spatial shift of construction industry development focus toward these regions. This trend aligns with existing research, suggesting that the characteristics of carbon emissions in China’s construction industry are significantly influenced by regional economic development stages and industrial restructuring [33, 34].
Although the eastern region showed a decline in carbon emissions, the reduction rate did not fully match economic growth, with a “weak decoupling” relationship persisting. In comparison, the central and western regions remained in states of “expansive negative decoupling” or “weak decoupling”, reflecting the continuation of high-carbon economic development models. These regional disparities highlight the considerable challenges the central and western regions face in future carbon reduction efforts.
Analyzing ecological carbon footprints reveals the spatial distribution and changing trends of carbon pressures on ecosystems. While the eastern region exhibited an overall decline in ecological carbon footprints, the central and western regions showed significant increases, especially in Henan and Guizhou provinces, where rapid growth in carbon footprints underscores the sustained ecological pressure from construction industry expansion. Consistent with previous research [35], this study confirms the spatial shift of China’s construction industry carbon footprints from the eastern to the central and western regions. This shift is closely related to infrastructure development and urbanization and reflects the uneven implementation of low-carbon technologies and regional policies.
The decomposition analysis of the Theil index reveals that intra-regional disparities are the primary contributors to the overall differences in carbon footprints, while inter-regional disparities are relatively small. This finding is consistent with existing studies [36, 37], highlighting the need to address intra-regional imbalances in carbon emissions. For example, the recent rise in the Theil Index in the central region indicates widening disparities in economic development and carbon footprint distribution. Additionally, fluctuations in the Theil Index in the Western region may be attributed to variations in construction industry development speeds and levels of low-carbon technology adoption.
Moran’s I index and local spatial autocorrelation analysis provide further insights into the spatial distribution characteristics of the ecological carbon footprint. Although the positive values of Moran’s I suggest a certain degree of spatial clustering, the low values and lack of statistical significance indicate that the spatial distribution is largely random. However, local spatial autocorrelation analysis reveals high-high clustering regions predominantly concentrated in the economically developed central and eastern areas in earlier years. By 2021, these high-high clustering regions had gradually shifted to the central and western regions, including Shaanxi, Henan, Guizhou, and Chongqing, reflecting the growing carbon footprint clustering effects of these areas’ rapidly developing construction industry.
The persistent low-high and high-low outlier patterns further illustrate the uneven levels of low-carbon development across regions. For example, Jiangxi consistently displayed a low-high pattern, indicating spatial spillover effects from adjacent high-carbon regions. In 2021, Jilin exhibited a high-low pattern for the first time, suggesting high carbon emissions in its construction industry paired with weaker regional green development capabilities. These spatial characteristics indicate that multiple factors, including economic development levels, policy implementation intensity, and resource endowments, influence the imbalances in carbon footprint distribution.
The findings of this study not only reveal the significant regional differences in carbon emissions and ecological carbon footprints but also underscore the specific challenges and opportunities for policy implementation and technology adoption in different regions. Despite its success in reducing carbon emissions in the eastern region, the ongoing challenge lies in maintaining this momentum. As urbanization levels plateau, the focus must shift to integrating more advanced technologies, such as smart construction and next-generation energy-saving materials, while ensuring that policies promoting low-carbon development reach smaller cities that may still lag behind. For the central and western regions, the rapid economic expansion has led to increased carbon emissions, primarily due to the reliance on coal-based energy and traditional construction techniques. The key challenge here is to shift from high-carbon development models to low-carbon alternatives, which requires not only the adoption of cleaner technologies but also robust policy enforcement. These regions can benefit from targeted government incentives that encourage renewable energy integration and carbon-neutral construction technologies, such as solar-integrated buildings and energy-efficient materials.
Moreover, the Western region faces the additional challenge of delayed technology adoption, largely due to cost constraints and limited access to low-carbon technologies. However, this region also holds significant potential due to its abundant renewable energy resources, such as wind and solar power. Harnessing these resources to power construction projects and integrate them into the construction process can offer a unique opportunity for low-carbon development. Policies prioritizing renewable energy use in the construction sector and fostering regional cooperation between the eastern and western regions for knowledge transfer could catalyze much-needed progress in this area. A dual approach is necessary for the central region: accelerating the adoption of advanced green construction technologies while maintaining economic growth. Encouraging industrial upgrades and energy-efficient building practices could serve as a model for the western region, where construction is expanding rapidly.
To address these challenges, a coordinated, region-specific policy framework is crucial. National policies must be tailored to account for different regions’ distinct developmental stages and capacities, particularly in promoting green construction technologies and incentivizing low-carbon construction practices. Furthermore, enhancing interregional collaboration through knowledge exchange and joint emission reduction efforts can facilitate more effective implementation of green development strategies. The findings also suggest that while some regions, especially the eastern region, have made significant strides in achieving low-carbon development, the central and western regions still face substantial hurdles. Bridging these gaps requires a strategic and synchronized approach to policy implementation, fostering technological innovation, and ensuring equitable access to green development opportunities across all regions.
Compared with existing research, the main contribution of this study lies in its comprehensive analysis of carbon emissions, ecological carbon footprints, and spatial distribution characteristics, revealing the deeper mechanisms behind the spatiotemporal changes and regional disparities in the construction industry. While Ning et al. emphasized the growth trend of carbon emissions in the central and western regions [38], this study extends the analysis by using local spatial autocorrelation to uncover the central and western regions as not only high-carbon growth areas but also potential focal points for future carbon reduction. Furthermore, unlike Shao et al., which focused on the effects of green development in the eastern region [39], this study highlights the critical role of the central and western regions in carbon reduction policies.
The findings of this study suggest that while some progress has been made in transitioning the construction industry to a low-carbon model nationwide, significant regional and intra-regional imbalances remain. By addressing the unique challenges and leveraging the opportunities identified for each region, China can develop a more effective and regionally tailored strategy for achieving its dual carbon goals.
Conclusions
This study reveals significant spatiotemporal differentiation in the carbon emissions of China’s construction industry from 2012 to 2021. While carbon emissions in the eastern region exhibited a declining trend, the central and western regions showed significant increases, particularly in provinces such as Henan and Sichuan, highlighting a spatial shift in high-carbon pressures. Decoupling analysis indicated that the eastern region gradually achieved “strong decoupling”, whereas the central and western regions remained predominantly in states of “weak decoupling” or “expansive negative decoupling”, underscoring the pronounced regional imbalances in green transitions. The ecological carbon footprint analysis revealed a decline in footprint levels in the eastern region, contrasted with increases in the central and western regions. The Theil Index further indicated that intra-regional disparities were the primary contributors to overall differences. Spatial autocorrelation analysis demonstrated weak overall spatial correlation for the ecological carbon footprint nationwide, yet localized high-high clustering areas shifted from the eastern to the central and western regions. The persistent presence of low-high and high-low patterns highlighted regional disparities in green development capacity.
Based on these findings, it is recommended that the promotion of green building technologies be accelerated and that energy structures in the central and western regions be optimized to support low-carbon development. Regional collaborative emission reduction mechanisms should be strengthened, fostering cooperation between the eastern, central, and western regions by sharing low-carbon technologies and policy expertise to bridge the green transition gap. Differentiated emission reduction strategies should be developed for high-carbon-emitting provinces, optimizing the construction industry’s structure and intensifying efforts to promote green building technologies. At the same time, the low-carbon development assessment system should be improved by establishing dynamic monitoring systems for carbon emissions and ecological footprints to provide timely guidance for policy adjustments and enhance emission reduction efficiency. Encouraging nationwide participation and integrating regional policies will collectively drive the green and low-carbon transition of the construction industry, laying a solid foundation for achieving China’s carbon neutrality goals.

