

Introduction
As one of the world’s most important food and oil crops, soybeans play a vital role in agricultural production and economic development. With the rapid advancement of industrialization and urbanization, the problem of soil heavy metal pollution is becoming increasingly serious, among which cadmium pollution is particularly prominent [1, 2]. Cadmium is a highly toxic heavy metal element that not only significantly inhibits the growth and development of plants but also threatens human health through the food chain. Studies have shown that CD stress can inhibit soybean photosynthesis, interfere with material accumulation and physiological metabolism, reduce soybean yield, and affect quality. This problem poses a huge challenge to food security [3] and ecological and environmental protection [4]. Monitoring and controlling cadmium pollution [5] requires not only a clear understanding of the impact of CD stress on crop growth and yield but also effective methods for rapidly assessing crops in polluted areas. Satellite remote sensing [6] has low spatial resolution and is easily affected by weather, making monitoring difficult in real-time. Near-ground laser radar [7] is expensive and has complex data processing, so its application range is relatively narrow. Therefore, developing an efficient and accurate method to assess the impact of CD stress on soybeans has become an important research topic in current agricultural science and environmental science.
This paper uses UAV remote sensing images and hyperspectral data combined with learning models to analyze the effects of CD stress on soybean growth and yield. Soybean field image data with different cadmium pollution gradients were used to analyze the effects of cadmium on photosynthesis and cell stability. The spectral features related to CD stress were extracted through wavelet transform and principal component analysis, and a CD stress recognition model was constructed based on the Transformer model. In addition, a model for predicting the impact of cadmium on soybean yield was established by combining multi-source data, effectively estimating the yield changes under different cadmium concentrations, and providing new ideas for agricultural assessment of cadmium pollution.
Related Work
In recent years, with the continuous development of remote sensing technology, its application potential in agricultural and environmental monitoring has become increasingly prominent. Remote sensing technology [8] can quickly and extensively monitor crop growth and environmental stress responses under non-destructive conditions by acquiring spectral, spatial, and temporal information about crops. Satellite remote sensing technology [9] has been widely used in agricultural production monitoring due to its wide coverage and strong periodicity in acquiring data. However, its spatial resolution is low and easily restricted by weather conditions such as cloud cover. Satellite remote sensing has limited practical effect in high-precision crop monitoring in small areas. Near-ground sensing technologies such as ground sensors and lidar [10] can provide higher resolution and accuracy monitoring data. Still, the equipment is expensive, the operation is complex, and the coverage is limited, so it cannot be widely used in large-scale agricultural production monitoring. The limitations of these methods have resulted in significant deficiencies in the current research on the impact of CD stress on crops in terms of large-scale monitoring methods, data accuracy, and timeliness, which has further prompted researchers to seek more efficient monitoring technologies to fill the gaps in current research.
In the application field of remote sensing technology, UAV remote sensing technology has the characteristics of flexibility, high resolution, and relatively low cost. It has gradually become an emerging means in crop monitoring research. By carrying multispectral [11] and hyperspectral [12] imaging equipment, drones can obtain crop growth information with high spatial and spectral resolution, which is suitable for agricultural monitoring and environmental assessment in small and medium-scale areas. Some studies have successfully used UAV hyperspectral images to extract vegetation indices such as the Normalized Difference Vegetation Index (NDVI) [13] and the Red-Edge Vegetation Index [14], achieving rapid detection of crop stress and quantitative analysis of health status. However, most studies have focused on monitoring general stresses such as water stress [15] and nitrogen stress [16]. There are fewer studies on CD stress, especially on the relationship between crop yield and physiological and ecological characteristics under CD stress. In addition, existing studies have certain limitations in optimizing data preprocessing and feature extraction methods and have failed to fully utilize the potential of hyperspectral data. This paper uses UAV remote sensing technology combined with hyperspectral image analysis to propose an integrated method to study the impact of CD stress on the physiological and ecological characteristics and yield of soybeans, achieve efficient estimation of soybean yield under CD stress, and provide a scientific basis for environmental pollution control and agricultural management.
Table 1.
UAV flight parameter design data.
Materials and Methods
Hyperspectral Recognition Model Design
UAV Video Collection
This study used a UAV with a hyperspectral sensor to collect remote sensing images of soybean fields. In order to ensure the quality and accuracy of the data, a detailed design was carried out for different flight altitudes, speeds, and image resolutions to obtain wide coverage and clear and detailed image data.
The choice of flight altitude was set according to the overall situation of the soybean field. A higher flight altitude of 120-150 m is selected in relatively open and uniform fields. This altitude can ensure a larger range of image coverage and effectively reduce local image distortion caused by individual differences in soybean plants during flight. In areas with more complex terrain or uneven plant distribution, the flight altitude is appropriately lowered to 60-80 m to improve the spatial resolution of the image. By flexibly adjusting the flight altitude, the image coverage is ensured to be extensive, and the details are clear, thereby improving the accuracy of subsequent data analysis. In terms of the choice of flight speed, a moderate flight speed is set according to the requirements of image resolution and acquisition accuracy. A moderate flight speed ensures the continuity of image acquisition and data stability and avoids image blur caused by flying too fast. Moderate flight speed control also provides a sufficient time window for multi-band data collection of hyperspectral sensors, which helps fully record data in different bands and ensure data diversity. The UAV flight parameter design is shown in Table 1.
Table 1 is the design of the UAV flight parameters, including the basic parameters such as the model and specifications of the UAV, and clearly states that the maximum take-off weight is 25 kg and the flight time is up to 40 min. The selection of the hyperspectral sensor is crucial. This study uses a hyperspectral sensor that can cover visible light, near-infrared, and short-wave infrared bands, with a band range of 400-2500 nm, ensuring the multidimensionality of the image data. The hyperspectral sensor has a high spectral resolution and can effectively capture the reflectance characteristics of soybean plants in different spectral bands. Hyperspectral data can more accurately analyze the physiological status of soybeans at different growth stages and distinguish the effects of CD stress. In order to ensure the timeliness and representativeness of the data, the image acquisition plan is strictly carried out according to the growth cycle of soybeans. The physiological changes of soybeans at different growth stages have different effects, and the impact of CD stress on soybean growth is especially obvious. In this regard, multiple flight missions were arranged to collect high-frequency images at key growth stages of soybeans, such as seedling, bud, flowering, and maturity. This collected data covers different ecological states of soybean growth and can better reflect the impact of CD stress on soybean crops at various stages. Table 2 shows the UAV payload equipment.
Table 2 lists the UAV-mounted equipment used in studying the effects of CD stress on soybean physiology and yield, including hyperspectral sensors, multispectral sensors, thermal imaging sensors [17], RGB sensors [18], and positioning and navigation equipment. The frequency and timing of data collection were adjusted according to climate and soybean growth conditions. Before and after the physiological changes that may be caused by CD stress occur, the acquisition frequency can be increased to obtain as much data as possible that can reflect the stress effect. In good weather conditions, image errors caused by strong sunlight and cloud changes can be avoided, and flight missions can be carried out as much as possible to ensure the clarity and accuracy of the images. During the flight mission and data collection process, in order to ensure the stability of the flight path and the continuity of data collection, an advanced flight control system [19] is used to ensure that the UAV flies according to the plan through preset flight routes and real-time monitoring, avoiding deviations from the route and repeated collection. The execution of the flight plan is combined with GPS (Global Positioning System) and inertial measurement unit data [20] to perform real-time correction of the image’s geographic location to ensure that each image’s data has accurate geographic coordinate information.
Table 2.
UAV payload equipment.
Through precise flight strategies and coordinating hyperspectral sensors, high-quality remote sensing images covering soybean fields were successfully obtained, providing a reliable basis for subsequent hyperspectral data processing, feature extraction, and physiological and ecological analysis. The diversity and high resolution of the data provided sufficient information to support the analysis of the effects of CD stress on soybean growth and laid a solid data foundation for the subsequent establishment of accurate physiological and ecological models and yield estimation models.
Data Acquisition and Calibration of CD Stress
In order to accurately construct a quantitative model of the effects of CD stress on the physiological and ecological characteristics and yield of soybeans, the soil cadmium concentration and soybean plant physiological indicators were systematically collected and calibrated. The sensors carried by drones are primarily designed for remote sensing monitoring of the ground surface and vegetation, but their measurement range does not extend directly below the soil surface. Soil sample collection and analysis were performed independently to ensure an accurate assessment of soil cadmium concentrations. The sampling areas were divided according to the degree of cadmium pollution in the fields, and sampling points were set in each area. The sampling points were evenly distributed, which could reflect the spatial heterogeneity of soil cadmium distribution. The boundary points of the cadmium pollution gradient were appropriately increased, and soil samples were collected at two depths, 0-20 cm and 20-40 cm, at each sampling point. These soil samples will be used for subsequent analysis of cadmium concentrations in the soil. This data is the basis for understanding the impact of cadmium stress on soybeans and will be combined with drone remote sensing image data to build and verify the model. It was also necessary to ensure that the outside world did not contaminate the soil during the sampling process. The soil samples were air-dried, ground, and sieved through a 100-mesh sieve, and the microwave digestion method [21] was used for sample pretreatment. The cadmium concentration of each treated sample was measured by inductively coupled plasma mass spectrometry [22]. This method has high sensitivity and can effectively eliminate interference. Standard reference materials were used for quality control. A blank sample and a standard sample were inserted every 20 samples to ensure data accuracy. Fig. 1 shows the sampling and sample pretreatment diagram.
Fig. 1 describes the collection, processing, and analysis process of soil and plant samples. Representative soybean plants were selected from different cadmium pollution gradient areas, and the samples covered the seedling stage, bud stage, flowering stage, and maturity stage. No less than 30 plants were randomly selected from each area, and their growth status and obvious stress symptoms were recorded. Leaf and stem samples were collected from the plants, and the functional leaves of the stems were measured leaf by leaf using a portable chlorophyll meter. The average value was taken to represent the chlorophyll level of the individual plant. The measured value can directly reflect the effect of CD stress on photosynthesis. The activities of superoxide dismutase [23], catalase, and peroxidase were determined by spectrophotometry [24]. Specifically, it includes making leaf homogenate, centrifuging and separating the supernatant, and reacting with the corresponding substrate system. The spectrophotometer can monitor changes in enzyme activity at a specific wavelength. The thiobarbituric acid reaction method determines the malondialdehyde content, which reflects the degree of lipid peroxidation in the plant and evaluates the effect of CD stress on cell membrane stability. The soluble sugar content is determined by the sulfuric acid-anthrone colorimetric method, and the free amino acid content is determined by the ninhydrin method [25] to reveal changes in the plant’s osmotic regulation ability.
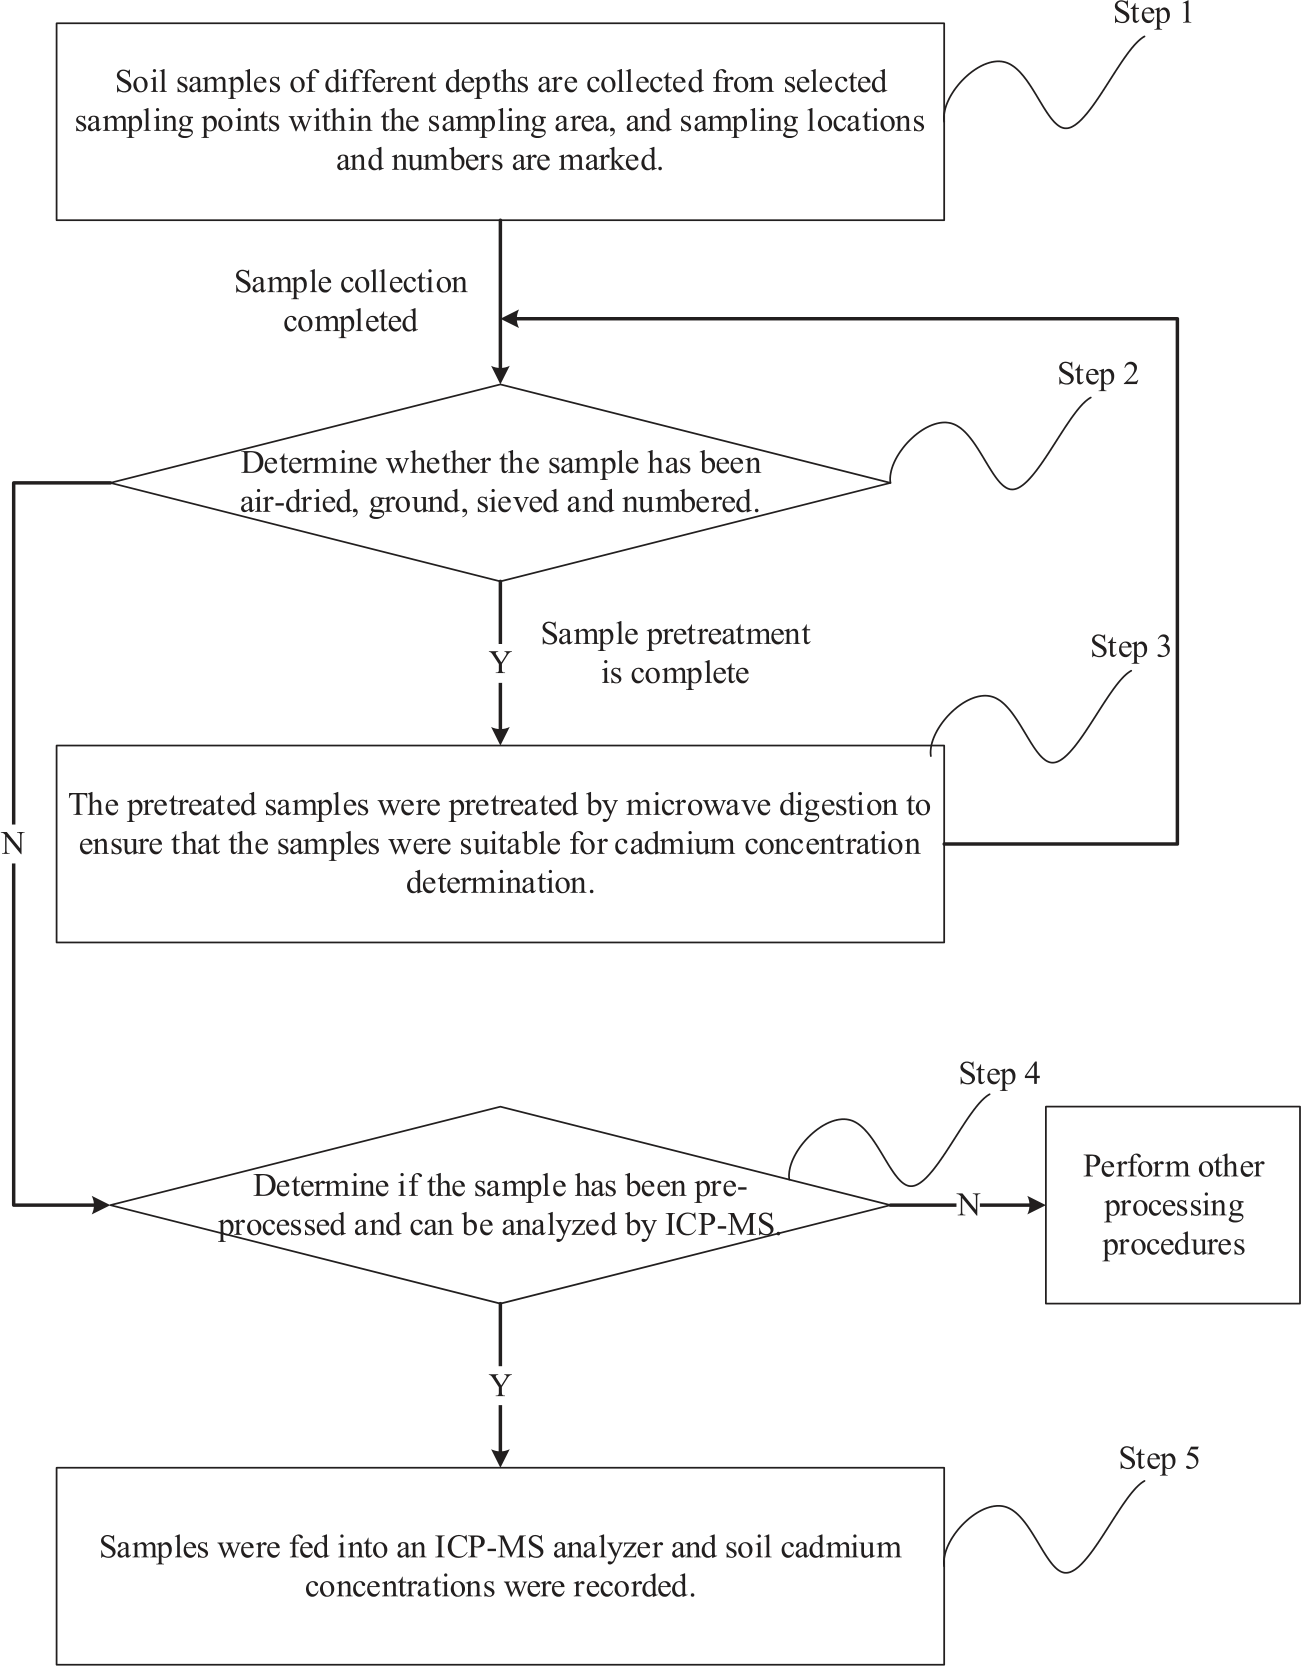
To ensure the data’s accuracy and relevance, special attention was paid to the positional correspondence between plant and soil samples during sampling. When selecting the 30 plants to obtain chlorophyll and other physiological data, we ensured that their sampling locations were the same as the locations of the soil samples used for ICP analysis. The physiological data of each plant can be directly correlated with the soil cadmium content of its growing environment, providing a solid foundation for subsequent data analysis.
After preliminary inspection of the collected soil cadmium concentration and plant physiological index data, extreme values and outliers were removed. The z-score standardization method was used to normalize the data to eliminate the dimension differences of different indicators. With soil cadmium concentration as the independent variable and plant physiological index as the dependent variable, the Pearson correlation coefficient was calculated to screen the significantly correlated indicators. The focus was on the relationship between cadmium concentration and chlorophyll content, antioxidant enzyme activity, and malondialdehyde content. The nonlinear relationship between soil cadmium concentration and plant physiological indicators was explored by combining multi-distance linear regression and a generalized additive model. The rationality of the model was verified by model fitting residual analysis. R2 evaluated the model’s performance and root mean square error (MSE). A segmented regression model was further applied for significant nonlinear relationships to capture the threshold effect of soil cadmium concentration.
Based on the comprehensive analysis of soil cadmium concentration and plant physiological response, the CD stress levels were divided into no stress, mild, moderate, and severe. Each level corresponds to a specific range of soil cadmium concentration and plant physiological index thresholds to ensure that the CD stress level has clear physiological significance. The data was divided into a training set and a validation set. The 10-fold cross-validation method [26] was used to evaluate the stability of the CD stress model and compare the prediction errors of the training set and the validation set to avoid overfitting. To verify the repeatability of the measured data, the sampling was repeated three times in different pollution gradient areas, and the soil cadmium concentration and plant physiological indicators were measured, respectively. The error of the results was controlled within 5% to ensure the reliability of the experimental data.
Hyperspectral Data Preprocessing
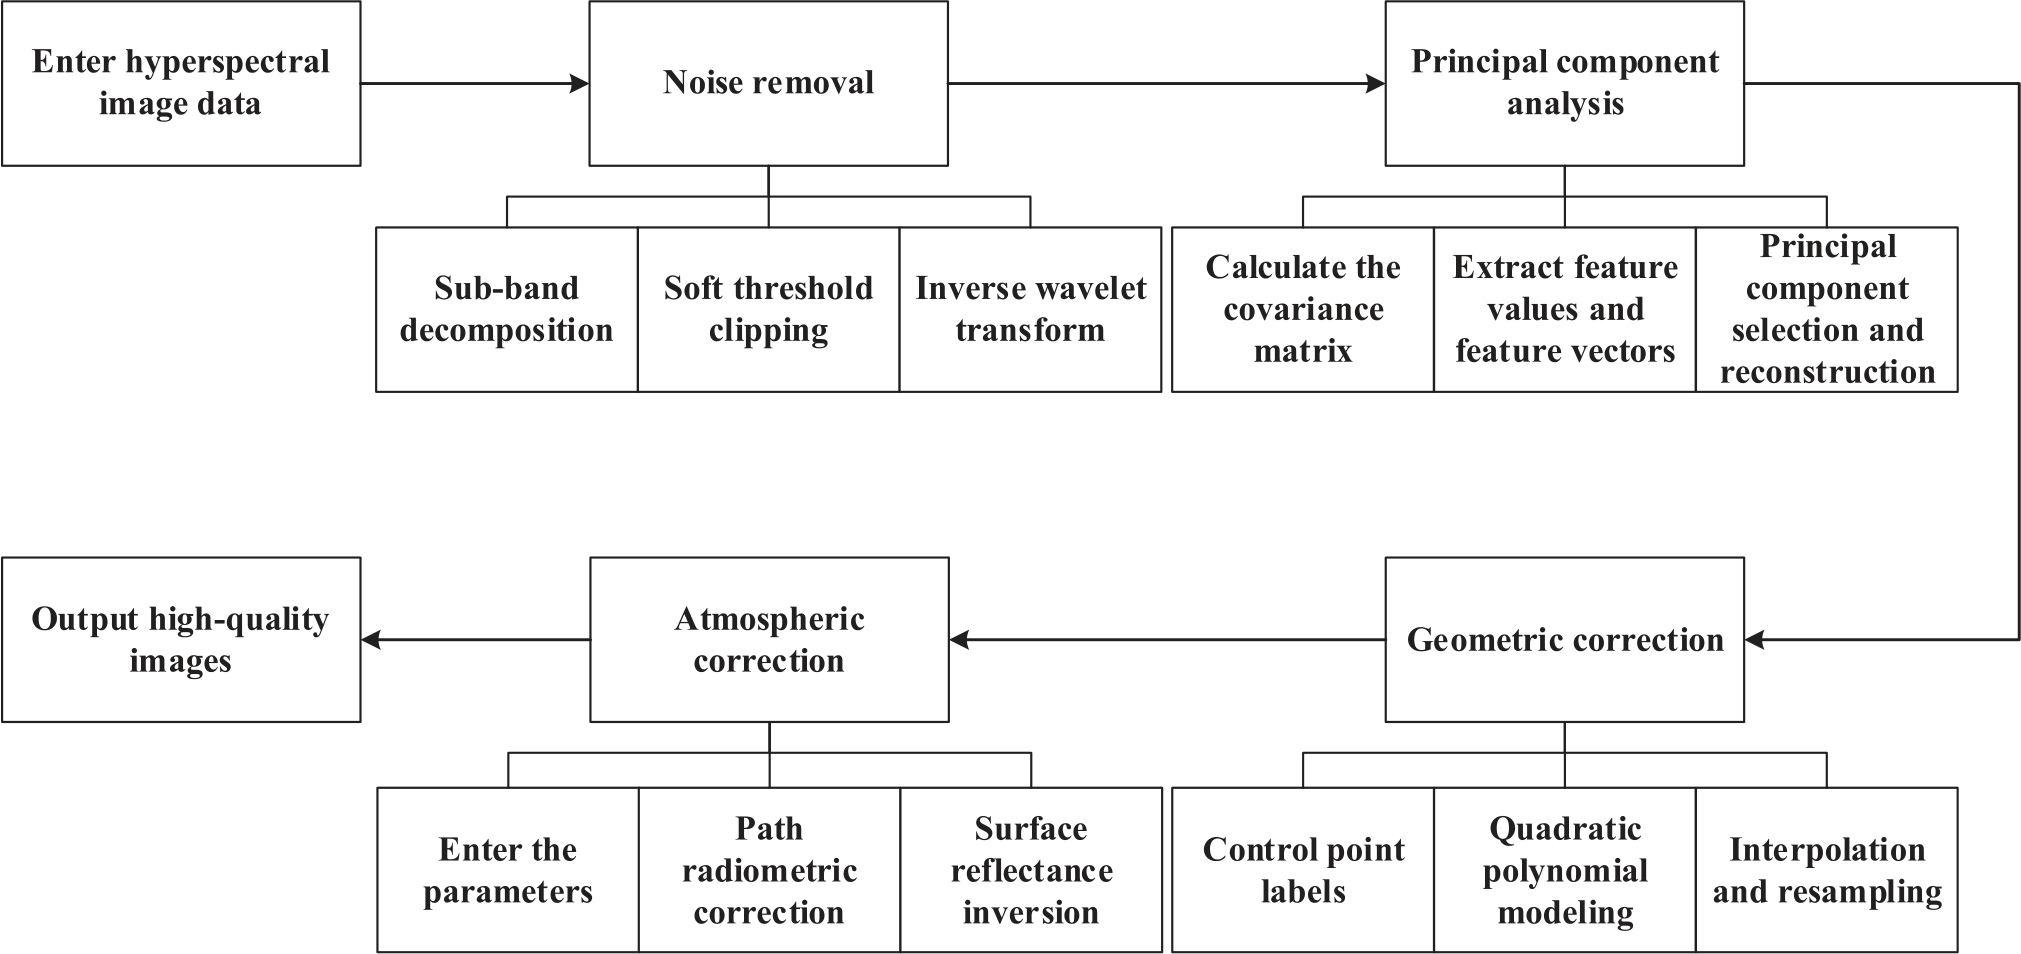
Remote sensing image data has errors caused by sensor noise and environmental interference. In order to improve the data quality, the wavelet transform and principal component analysis method were used to remove the noise. The Daubechies wavelet basis is selected to decompose the image signal [27], and the image is divided into sub-band coefficients of different frequencies. In the high-frequency sub-band, the threshold can be estimated according to the noise variance, and the high-frequency coefficients can be clipped using the soft threshold function to retain the main signal information and suppress the noise signal. The corrected high-frequency and low-frequency coefficients are subjected to inverse wavelet transform to reconstruct the image and generate denoised image data. It can reduce the impact of random noise and avoid excessive loss of important details.
The signal-to-noise ratio is further improved through principal component analysis; the covariance matrix of the image data is calculated, the eigenvalues and eigenvectors are extracted, and the principal components of each band are obtained. The principal components are sorted according to their contribution rate, and the principal components with a contribution rate of more than 99% are retained. The rest are considered noise components and removed. Combining the main components to reconstruct the image, the multi-band data is generated after noise reduction. This can remove the secondary components to reduce the redundancy of image data, optimize the correlation of image data, and ensure that the hyperspectral data reflects the vegetation characteristics more accurately.
The geometric deformation of hyperspectral images can directly affect the subsequent geographic information analysis and feature extraction. In order to ensure the accuracy of the image’s geographic location, ground control points and image registration technology are used for geometric correction. Differential GPS is used to obtain high-precision ground control point coordinates, and easily identifiable features in the image are selected as control points, and the corresponding pixel positions are manually marked. Based on the ground control point data, a quadratic polynomial model is used to establish the transformation relationship from the image coordinate system to the geographic coordinate system. The multivariate regression model can consider the image between multiple independent variables (pixel coordinates of the image) and one or more dependent variables (geographic coordinates) to more accurately describe and predict the relationship between them. By fitting this relationship, the conversion coefficient can be obtained to accurately locate each pixel in the image into the geographic coordinate system. The model form is:
In the formula, (A, B) are geographic coordinates, (M, N) are image pixel coordinates, and α1 and β1 are fitting coefficients. Compared with the reference image, the nearest neighbor interpolation method is used to resample the pixel values to ensure that the image is not distorted after geographic correction and that the geographic coordinate system can be calibrated at the same time. This process can effectively eliminate the image’s tilt, rotation, and local stretching errors, ensure the image’s spatial accuracy, and provide a basis for comparative analysis of multi-temporal images.
In order to eliminate the interference of atmospheric scattering and absorption on hyperspectral data and make the image data closer to the true reflectance of the ground, the ATCOR (Atmospheric Correction) model [28] is used for atmospheric correction. According to the collection area’s climate conditions and terrain characteristics, the mid-latitude summer atmospheric model was selected, and the parameters such as aerosol optical thickness, water vapor content, and initial ground reflectivity of the study area were input. The radiative transfer model (RTM) [29] was used to calculate the effects of atmospheric molecular scattering and aerosol scattering. The path radiation correction formula is:
Δ is the total radiation received by the sensor, Δp is the path radiation, and Δs is the surface reflected radiation. After correcting for atmospheric scattering, the surface reflectivity is inverted according to the radiation transfer formula:
Pd is solar radiation, T is atmospheric transmittance, and Tatm is atmospheric transmission coefficient. Interpolation is used to replace bands with strong water vapor absorption in the image to eliminate the influence of abnormal absorption in the hyperspectral data. After inspection, the preprocessed hyperspectral image has a significantly improved signal-to-noise ratio, the noise level is reduced to less than 5% before acquisition, and the geometric positioning error is controlled within 1 pixel. After atmospheric correction, the root MSE between the reflectance and the measured ground spectral data is less than 0.02, which verifies the accuracy and reliability of the data processing process. It provides a high-quality data foundation for subsequent feature extraction and model analysis. Fig. 2 shows the hyperspectral image preprocessing process. Fig. 2 shows the logical relationship of the hyperspectral data processing process, including each step’s input, output, and processing methods.
Feature Extraction and Physiological and Ecological Analysis
Multiple parameters that can reflect the growth status of vegetation and the impact of stress are selected, including the structural sensitive vegetation index, the soil-regulated vegetation index, and a new index based on the blue edge and green edge reflectance characteristics. Through time series retrospective analysis, the changing trend of the index is monitored at different growth stages to capture the specific response under CD stress. In the index construction, the weight of the normalization factor in the NDVI calculation is optimized to reduce background soil reflection and other non-target interference, given the CD stress effect. By calculating the temporal change rate before and after stress by segmenting the time window function, the stress response dynamics at different stages were evaluated, and it was found that the exponential changes in the seedling and mature stages were most sensitive to the cadmium concentration gradient, laying the foundation for subsequent feature analysis.
In order to break through the limitations of single-band reflectance, the cross-fusion method between bands was used to extract CD stress sensitivity features. Combined with the spectral difference method, the gradient calculation of the continuous reflectance in the range of 400-2500 nm was performed to enhance the differences in specific bands. The band combination screening method based on mutual information gain optimizes the sensitivity of different band combinations to CD stress characteristics. The screening results show that the index after the fusion of 680 nm red light, 740 nm red edge, and 810 nm near-infrared bands is the most significant in distinguishing CD stress.
The dynamic spectral index is used to capture the difference in reflectance changes of soybean plants at different times. The characteristic bands of multi-temporal images were differentiated to construct a dynamic difference matrix. The segmented threshold optimization method based on curve fitting was used to capture the inflection points of stress characteristic changes, and the dynamic characteristics of spectral response were accurately extracted. The vegetation reflectance data was transformed from the time domain to the frequency domain for analysis, and the low-frequency characteristic components caused by CD stress were extracted with the help of the Fourier transform model. The original spectral curve is decomposed by sliding the window to remove high-frequency noise during the processing. Through spectrum reconstruction, the key low-frequency components reflecting the stress effect are retained, and the changes in their energy concentration are analyzed. The effects of CD stress on the reflectance spectrum of soybeans are mainly reflected in the enhancement of low-frequency components and the contraction of spectrum width.
Using the physiological index data sampled in the field, a multivariate nonlinear model is constructed and coupled with the hyperspectral reflectance characteristics for analysis. Using the kernel function optimized support vector regression algorithm, the relationship between reflectance and physiological data was nonlinearly fitted based on the radial basis function. After model training and verification, the R² value between the red edge reflectance feature and the antioxidant enzyme activity was obtained, proving its significant correlation. In order to explore the interaction between multiple indicators, the partial least squares regression method was applied to map the reflectance features to the low-dimensional latent variable space and calculate the feature weight contribution rate. To verify the significance of the extracted features, the non-parametric test method Mann-Whitney U [30] was used to conduct a significance analysis of the feature distribution under different stress levels. Based on the significance test results, the critical threshold of the effect of cadmium concentration on vegetation index was defined in combination with segmented regression analysis, and the distribution range of the characteristic parameters under cadmium concentration stress of 0, 0.5, 1, 2, and 5 mg/kg was clarified.
Construction of Hyperspectral Recognition Model
To accurately classify soybeans under CD stress, a recognition model based on hyperspectral data was constructed, using machine learning algorithms such as Transformer, support vector machine, and random forest suitable for hyperspectral data processing. This model was combined with feature screening and optimization technology to improve classification effect and model stability.
Hyperspectral data contains hundreds of continuous bands with a lot of redundant information. In order to reduce the computational complexity and highlight the characteristics of CD stress, the maximum correlation and minimum redundancy method is used for feature screening. The mutual information value between each band and the CD stress classification label is calculated to evaluate the correlation between the band and the classification target. Then, the mutual information value between each band is used to evaluate the redundancy between bands. The most representative feature bands are selected by maximizing the correlation between the band and the target and minimizing the redundancy between bands.
On this basis, further dimensionality reduction is performed, and the high-dimensional feature space is mapped to the low-dimensional principal component space by combining the principal component analysis method, retaining the principal components with more than 99% cumulative variance contribution rate. The principal component analysis method can not only effectively reduce data redundancy but also retain the main information structure of hyperspectral features, providing concise and effective input features for subsequent model training. When constructing a random forest model, the performance is optimized by adjusting key parameters. The number of decision trees is set at intervals of 50-300 steps to determine the balance between classification accuracy and computational efficiency. The maximum tree depth can be set to a dynamic adjustment mode, and the error curve of the validation set can be used to avoid overfitting. The number of small sample splits can be adjusted to balance the generalization ability and accuracy of the tree. The random forest model constructs multiple decision trees by randomly selecting feature subsets and sample subsets to enhance the robustness of the model to hyperspectral data noise.
The model is fully evaluated using a confusion matrix, classification accuracy, recall rate, and F1 value indicators. The real and predicted distribution of each type of sample in the classification results can be calculated to clarify the classification effect of the model on different CD stress levels. The diagonal elements in the confusion matrix can be observed to evaluate the model’s accuracy for the main classification target. It can be defined as the ratio of the number of correctly classified samples to the total number of samples, which can measure the overall classification ability of the model. The off-diagonal elements analyze the misclassification pattern of the model. For small sample categories, such as the severity level of CD stress, the recall rate is calculated to reflect the model’s ability to identify small categories. Combining precision and recall rate, the F1 value comprehensively evaluates the balanced performance of the model in each classification task. Based on cross-validation, the model’s generalization ability is further verified using an independent test set. Comparing the performance with the training set ensures that the model does not overfit or underfit.
Yield Estimation Model
In order to accurately establish the relationship between CD stress and soybean yield, it is necessary to construct a comprehensive input feature set, combining multi-source data, including key spectral features of hyperspectral images, soil cadmium concentrations, and plant physiological and ecological indicators. The feature extraction process focuses on representativeness and simplicity to ensure the effectiveness of model training and generalization capabilities. Band combinations and derived indices sensitive to CD stress, such as the structure-sensitive vegetation index and red edge spectral features, were screened from hyperspectral images. These features can reflect the physiological changes and stress levels of vegetation. Soil cadmium concentration was used as the core variable to characterize stress intensity, and physiological and ecological characteristics such as soybean chlorophyll content, antioxidant enzyme activity, and soluble sugar content were integrated to enhance the characterization of crop stress responses. Multicollinearity analysis was used to calculate the variance inflation factor between features and eliminate redundant variables with significant collinearity to optimize the feature combination. A recursive feature elimination algorithm further screened the most important variables to ensure that the input feature set had minimal redundancy and maximum representativeness.
A variety of machine learning and statistical modeling methods were used to explore the quantitative relationship between CD stress and soybean yield and optimize the model’s performance. When constructing the benchmark regression model, the input feature set was used as the independent variable, and soybean yield was used as the dependent variable. The model fitted the regression coefficients using the least squares method to explain the direct linear contribution of the explanatory variables to yield. In order to enhance the explanatory power, the interaction term regression was further introduced to capture the interaction effect between cadmium concentration and plant physiological characteristics. Given the nonlinear relationship in the data, the radial basis kernel function [31] was used to support vector regression modeling. The method maps high-dimensional space and transforms complex nonlinear relationships into linear fitting problems, which can optimize hyperparameters and improve model fitting accuracy. Random forest constructs multiple regression trees in an integrated learning manner and builds a robust model through random sampling of features and sample subsets. Its advantage is that it can automatically capture the nonlinear relationship between features and yield and evaluate the importance of features. The model complexity and generalization ability are balanced by adjusting the number of regression trees and the maximum depth.
A nonlinear regression model based on a multi-layer perceptron [32] with input, hidden, and output layers is constructed. Nonlinear activation functions are used to improve the model’s ability to fit complex relationships. Stochastic gradient descent is used to optimize weight parameters, combined with an early stopping strategy to avoid overfitting. The grid search method [33] and the Bayesian optimization method [34] are used to jointly adjust key parameters. The optimal parameter combination is determined through the validation set results. The results of multiple models are integrated through weighted averaging or stacked regression methods, combining the advantages of linear and nonlinear models to improve prediction accuracy and stability. Stacked regression uses the secondary model to learn the prediction results of the primary model and further optimizes the yield estimation.
Method Effect Evaluation
This paper combines UAV remote sensing images with hyperspectral recognition models to analyze the impact of CD stress on soybean physiological and ecological characteristics and achieve yield estimation. In order to evaluate the effectiveness of the proposed method, multi-level evaluation indicators are set, covering different links such as classification, model fitting, and yield estimation to ensure the comprehensiveness and scientificity of the analysis.
Classification Evaluation
Classification evaluation includes classification accuracy, recall rate, F1 value, and confusion matrix. Classification accuracy is the ratio of the number of correct samples to the total number of samples, which is used to measure the accuracy and reliability of the classification model in classifying CD stress levels:
TP, TN, FP, and FN are true positive, true negative, false positive, and false negative, respectively. They reflect the proportion of samples predicted correctly by the model and are the primary criterion for measuring overall performance. They evaluate the comprehensive performance of the classification model on all samples. A high accuracy rate means that the model can accurately identify the CD stress level of most samples.
The recall rate evaluates the model’s sensitivity to different CD stress levels, especially the detection effect on samples of a specific category. It is defined as the ratio of correctly identifying a certain category of samples and pays more attention to the ability to identify small samples of severe stress categories.
The F1 value can comprehensively balance the precision and recall rate and is suitable for unbalanced data sets. The high or low F1 value indicates the ability of the model to accurately and comprehensively identify the target category during classification and quantifies the model’s comprehensive classification performance in various categories.
The confusion matrix can show each stress level classification’s actual and predicted distribution, clearly showing the categories and numbers of misclassifications. This helps analyze the model’s failure points at specific CD stress levels.
Evaluation of the Fit of the Hyperspectral Recognition Model
The coefficient of determination measures the model’s ability to fit the data. The closer the R2 value is to 1, the stronger the model’s explanatory ability is. A lower value indicates that the relationship between hyperspectral data and soybean characteristics has not been fully explored. The R2 value can well reflect the degree of explanation of hyperspectral characteristics on soybean physiological and ecological indicators and stress responses.
In the formula, αi is the actual value,
Performance Evaluation of CD Stress Yield Estimation Model
The mean absolute error (MAE) measures the average absolute deviation between the predicted value and the true value. The smaller the MAE, the higher the model’s accuracy in predicting yield. It can evaluate the overall error margin of the model in predicting soybean yield and reflect the practical applicability of the method.
The relative error represents the ratio of the prediction error to the true value, which can explain the model’s adaptability to different production ranges and provide a relative measure of the prediction error, making it easier to compare model performance under different conditions.
The cross-validation method evaluates the model’s robustness to assess its generalization ability on unseen data, avoiding overfitting and underfitting problems. The 10-fold cross-validation can comprehensively test the model’s stability under different data distributions to ensure high reliability.
Data Appropriateness Evaluation
The signal-to-noise ratio [35] evaluates the noise level to assess the quality of the denoised hyperspectral data. The noise level should be less than 5% of the noise level before acquisition. Too high a noise level can interfere with extracting CD stress features. The purpose is to ensure that the raw data is fully processed and provides high-quality input. The geometric error is the spatial registration error of the remote sensing image. The geometric correction error of the remote sensing image is controlled within 1 pixel to avoid the deviation between the spectral characteristics and the actual distribution of objects and ensure the accuracy of the spatial positioning of the data. The spectral reflectance after atmospheric correction must be consistent with the ground-measured data to reflect the accuracy of the correction algorithm. An error that is too large can lead to failure of trench feature extraction.
Comprehensive Performance Evaluation
The model interpretability is to analyze the feature weight distribution of the model to clarify that the hyperspectral band and remote sensing features contribute the most to the detection and yield estimation of CD stress, which can help understand the data rules and is beneficial to further optimize the model. Time efficiency evaluates the time cost of data collection, preprocessing, and model training to ensure the operability of the method in practical applications, especially its practicality in large-scale agricultural management.
Results
In order to explore the effects of CD stress on the physiological and ecological characteristics and hyperspectral response of soybeans, this experiment conducted a systematic analysis from multiple aspects. The following can present the experimental results from five aspects: changes in soybean physiological characteristics, screening of hyperspectral sensitive bands, evaluation of classification model effects, verification of yield prediction models, and division of physiological thresholds. The detailed analysis of the experimental data not only reveals the multi-level impact of CD stress on soybeans but also provides a scientific basis for the use of hyperspectral technology to monitor crops under heavy metal stress. Fig. 3 shows the impact of CD stress on soybeans’ physiological and ecological characteristics, measured at different flight altitudes.
Fig. 3.
Effects of CD stress on soybean physiological and ecological characteristics measured at different altitudes. a) Chlorophyll content measured at different flight altitudes under different cadmium concentrations. b) Malondialdehyde content measured at different flight altitudes under different cadmium concentrations. c) Soluble sugar content measured at different flight altitudes under different cadmium concentrations. d) Antioxidant enzyme activity measured at different flight altitudes under different cadmium concentrations.
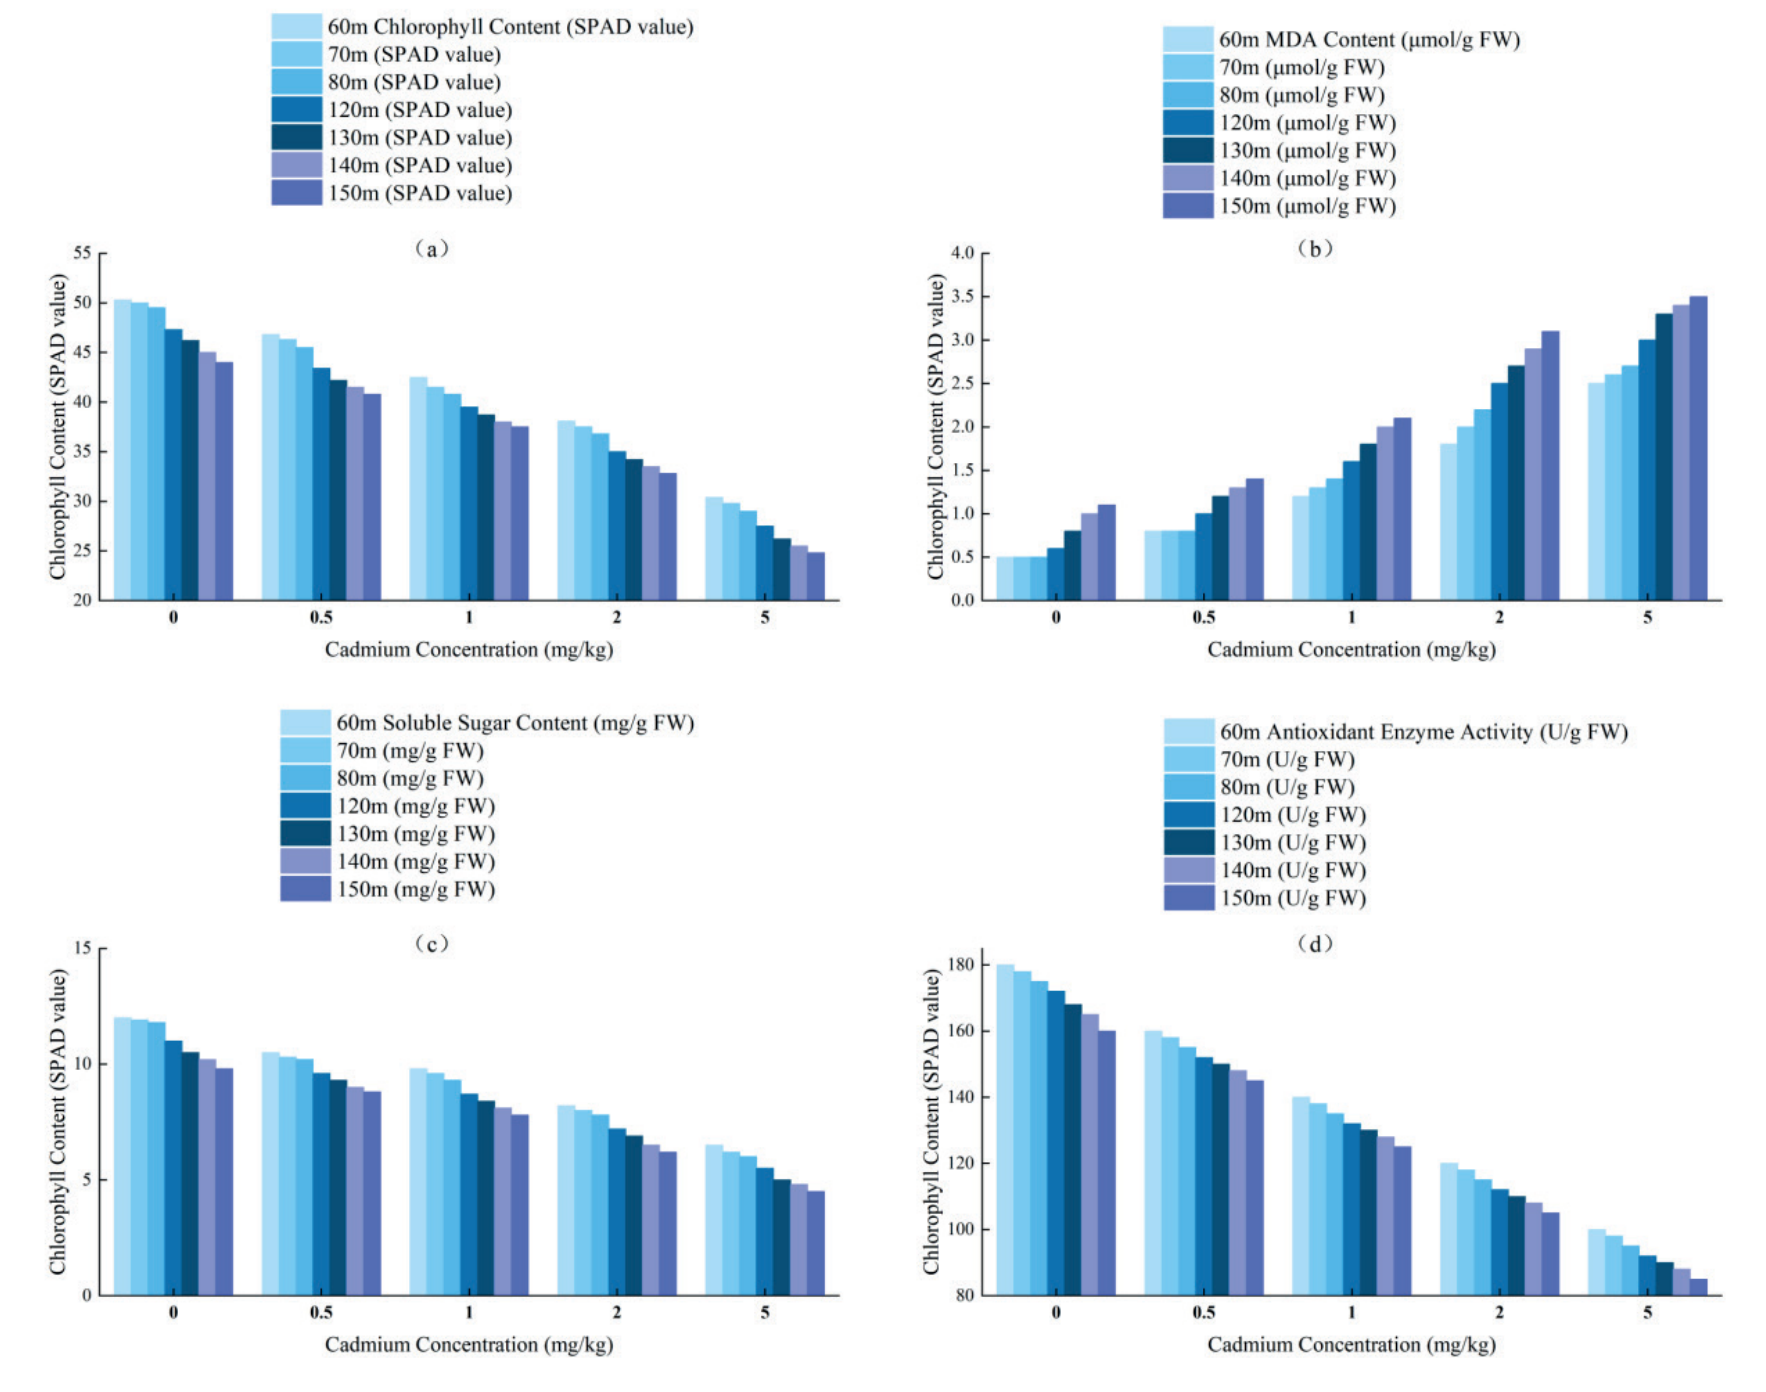
Fig. 3 shows the measurement results of chlorophyll content, malondialdehyde content, soluble sugar content, and antioxidant enzyme activity of soybeans with different cadmium concentrations at different flight altitudes. As the cadmium concentration increases, the chlorophyll content, soluble sugar content, and antioxidant enzyme activity show a downward trend, and the malondialdehyde content increases significantly. At an altitude of 60 m, the SPAD (Soil and Plant Analyzer Development) value of chlorophyll decreased from 50.3 to 30.4, and the antioxidant enzyme activity decreased from 180 U/g FW to 100 U/g FW, indicating that CD stress would inhibit plant photosynthesis, interfere with sugar metabolism, and aggravate oxidative damage. The change in the UAV’s flight altitude has a certain impact on the measured value. Due to the change in ambient light intensity and airflow disturbance, the measured data at different flight altitudes have certain deviations, but the deviation image is within an acceptable range. When conducting field scans, the flight altitude of the drone is adjusted according to the terrain and collection needs. In relatively open and uniform fields, the drone chooses a higher flight altitude of 120-150 m to ensure a wider image coverage. In areas with more complex terrain or uneven plant distribution, the flight altitude is appropriately reduced to 60-80 m to improve the spatial resolution of the image. This change in flight altitude will have a certain impact on the measured values. Due to changes in ambient light intensity and airflow disturbances, there is a certain deviation in the data measured at different flight altitudes. By using data processing technology, this deviation is effectively corrected and compensated for in subsequent analysis so that the final data results have acceptable accuracy and reliability. Therefore, despite the change in drone altitude, data such as CD, chlorophyll, and antioxidant enzyme activity can still be effectively compared and analyzed within the evaluated geographical area. Under high cadmium concentrations, the physiological metabolism of plants shows a significant inhibitory effect, providing reliable data support for studying the impact of CD stress on plants.
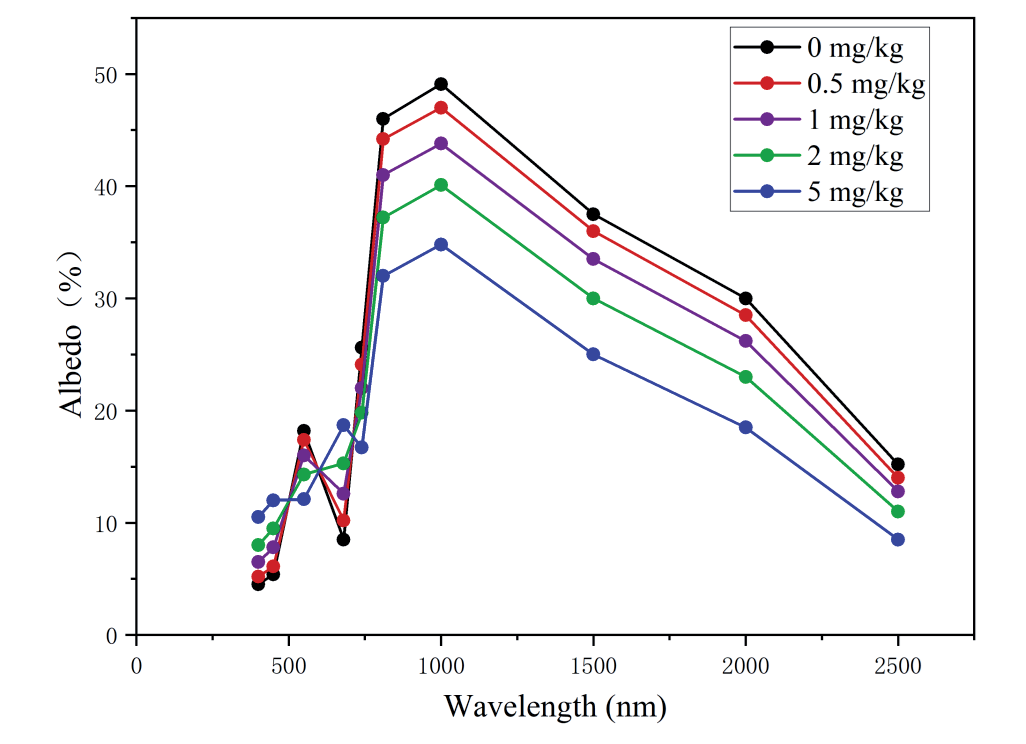
Fig. 5.
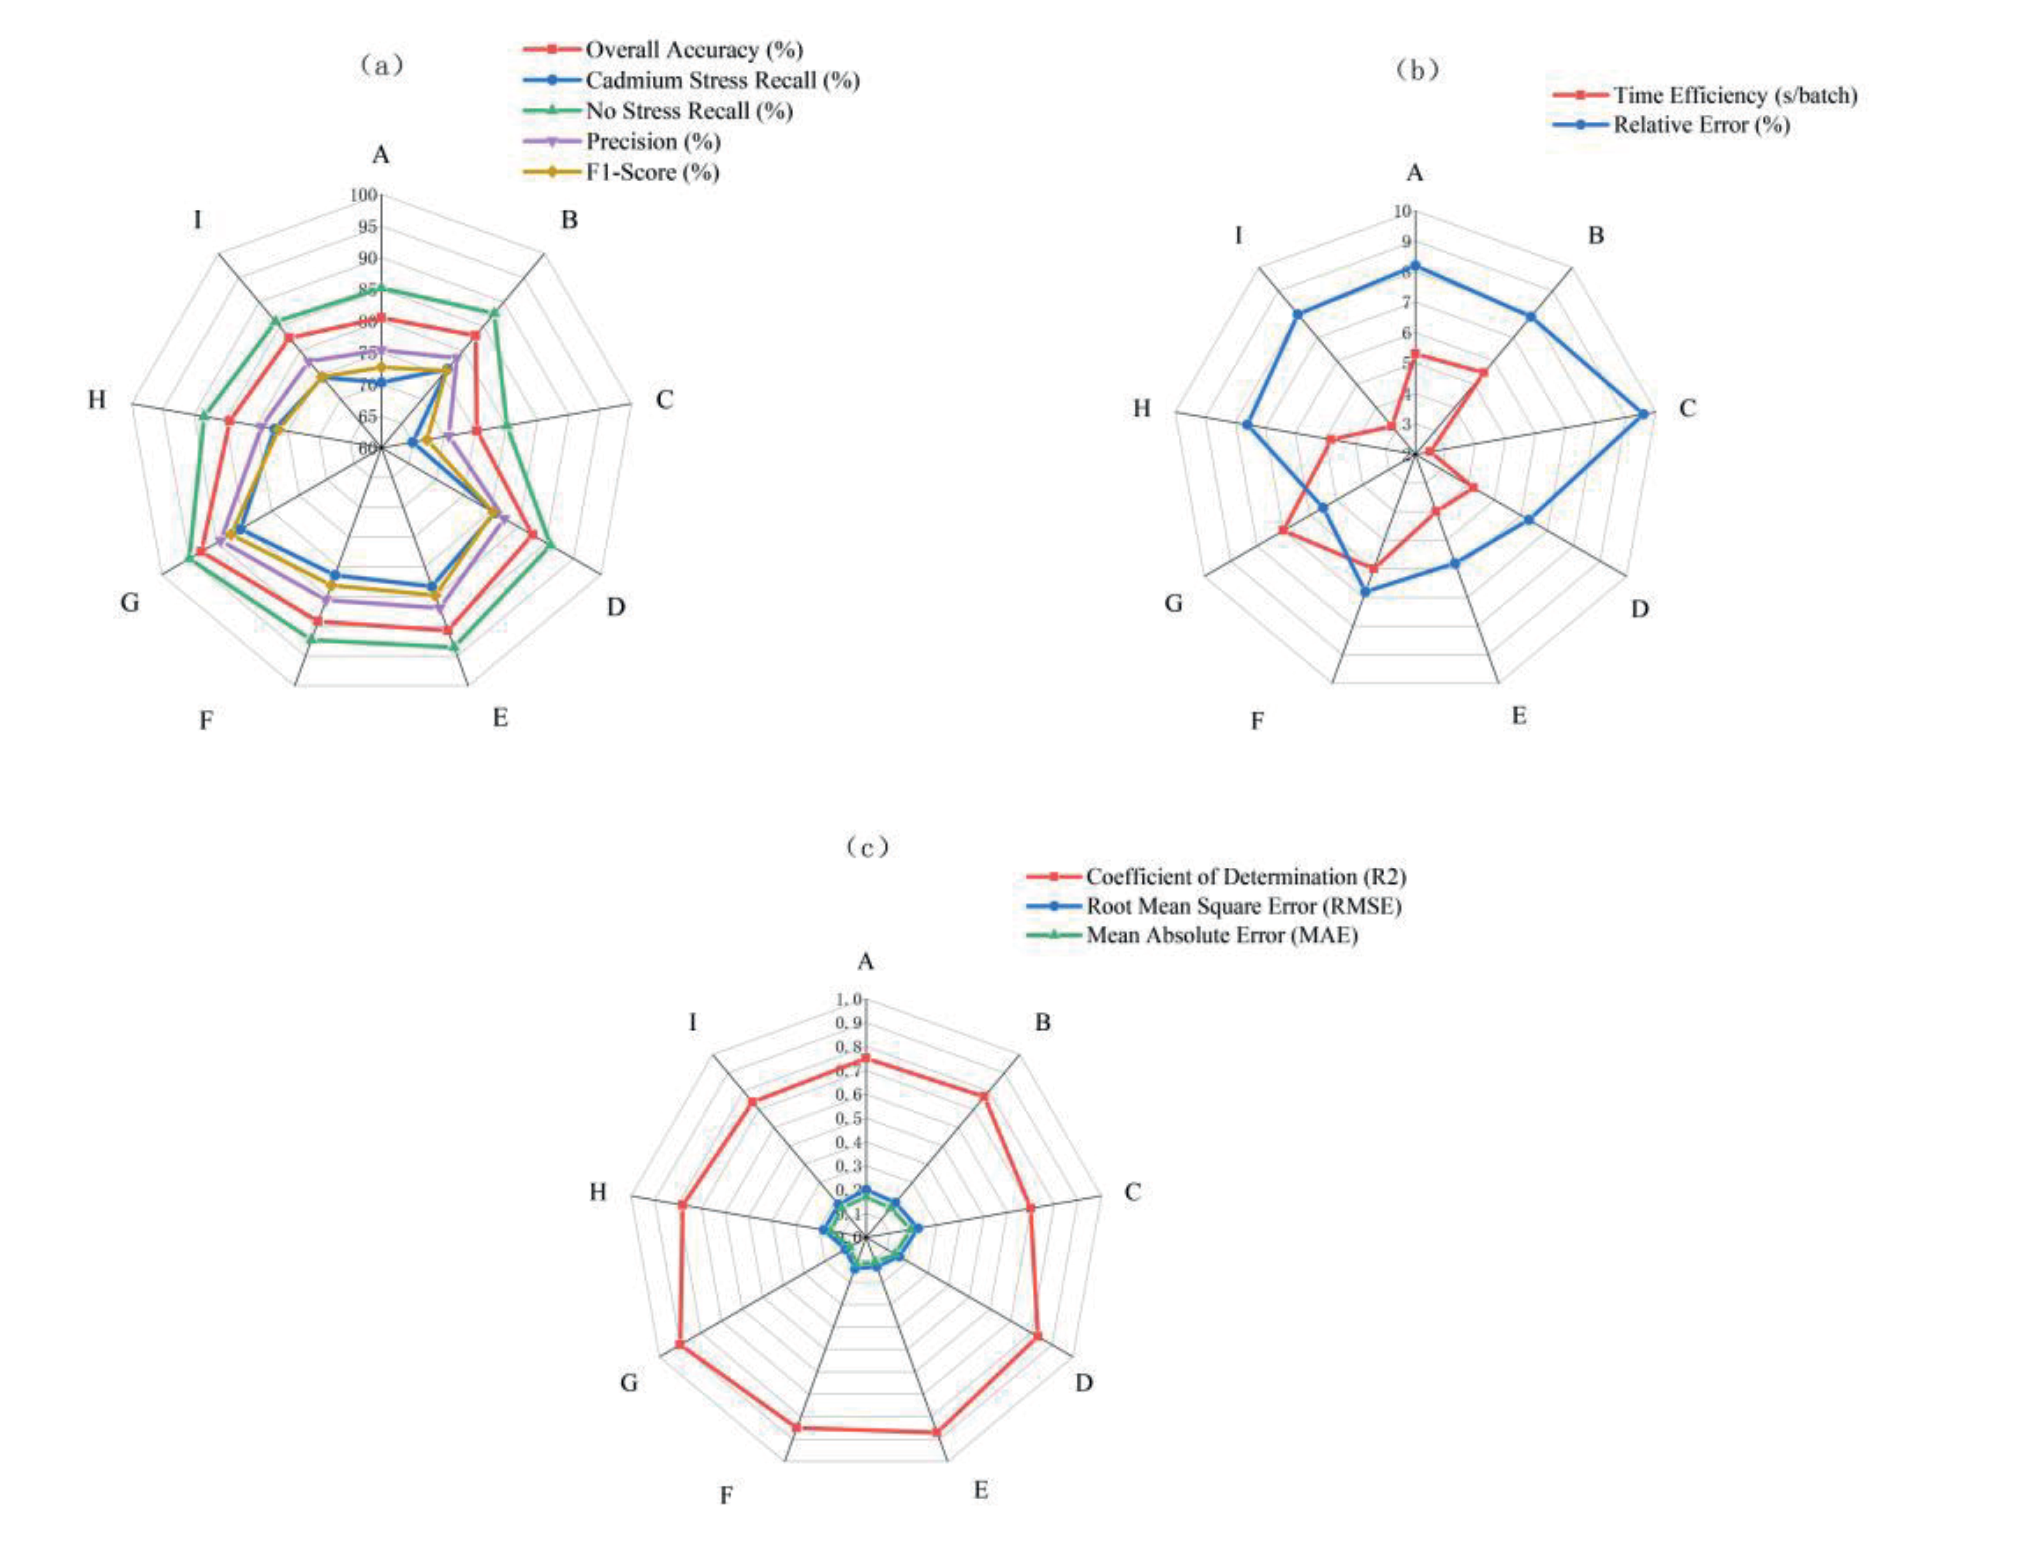
Machine learning model to classify soybean CD stress level. a) Classification accuracy, recall, precision, and F1 value. b) Classification time efficiency and relative error. c) Classification determination coefficient, root MSE, and MAE.
Further studies of the sensitivity of CD stress to the spectrum cover a wavelength range of 400-2500 nm. The stress response pattern of a specific area can be identified by analyzing the changes in reflectance under different cadmium concentrations. This provides important information for exploring how CD stress changes soybean plants’ physiological and structural characteristics. Fig. 4 shows the effect of different cadmium stresses on reflectance in different bands.
The data in Fig. 4 show that with the increase in cadmium concentration, the reflectance of plants in different spectral bands shows a certain regular change. The reflectance of blue and red light in the visible light region of 400-700 nm shows an upward trend with the increase of cadmium concentration, which is related to the destruction of chlorophyll and the decrease of photosynthesis efficiency. The decrease in green light reflectance can clearly reflect the reduction in chlorophyll content. The reflectance at the red edge of 740 nm and the near-infrared region of 700-1000 nm has decreased significantly, indicating that the plant cell structure has been damaged by CD stress. In the short-wave infrared region of 1000-2500 nm, the reflectance continues to decrease, which is caused by the impact of CD stress on the water content and biochemical components of plants. Among them, the red edge and short-wave infrared bands are most sensitive to CD stress and can be used as key spectral indicators for monitoring and evaluating soybean stress status.
In the experiment, a variety of machine learning models were used to classify and identify the CD stress level of soybeans. By analyzing the model’s classification accuracy, recall rate, precision, and F1 value, as well as the model’s time efficiency, determination coefficient, root MSE, MAE, relative error, and other multi-dimensional indicators, it is ensured that the model is highly practical and reliable in practical applications. Fig. 5 is a radar chart of various indicators.
The machine learning models used by A-I in Fig. 5 are support vector machine, multi-layer perceptron, K-nearest neighbor algorithm, GBDT (Gradient Boosting Decision Trees), XGBoost (eXtreme Gradient Boosting), convolutional neural network, Transformer model, random forest, and extreme learning machine. A variety of common machine learning methods were selected for comparison with deep learning methods. The data shows that the Transformer model has the best effect, with an accuracy of 92.8%, a CD stress recall of 85.7%, and an F1 score of 87.4%. Overall, XGBoost and convolutional audit networks also showed strong performance, especially in terms of the balance between precision and recall. In terms of time efficiency, the k-nearest neighbor algorithm and extreme learning machine are relatively more efficient.
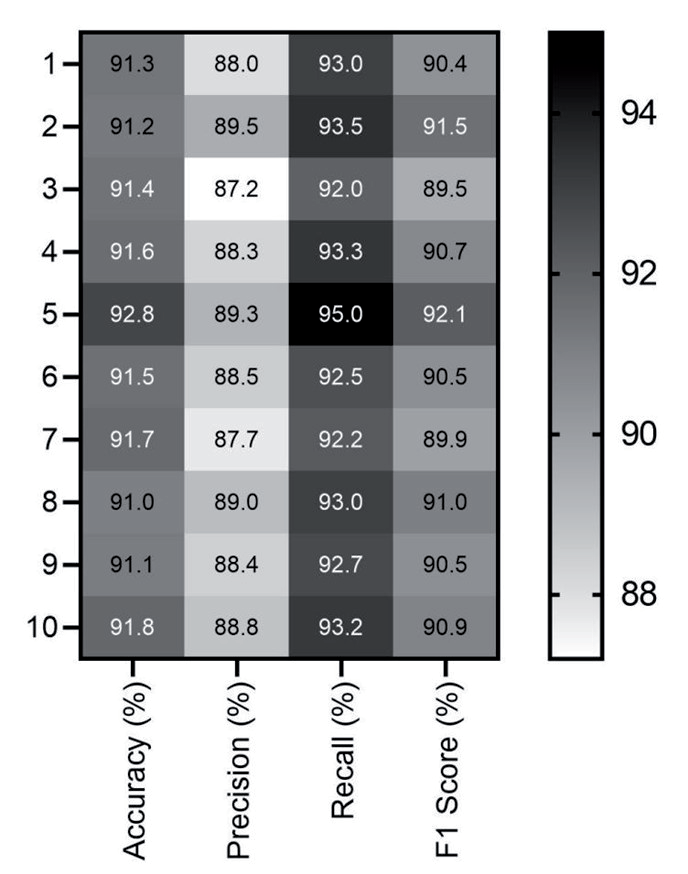
In the experiment, 10-fold cross-validation was used to evaluate the model’s performance based on the Transformer model. In order to more comprehensively evaluate the model’s performance, accuracy, recall, precision, and F1 score were selected. In each fold, the performance of the model may be different. In order to comprehensively display the performance indicators of each fold, the results are analyzed in detail below, and the performance differences of the model in different folds are displayed through heat maps. Fig. 6 is a heat map of the indicators for each fold.
As can be seen from Fig. 6, the accuracy of each fold is between 91% and 92.8%, indicating that the performance of the model in the 10-fold cross-validation is relatively stable. The highest accuracy of the fifth fold reaches 92.8%. The precision varies between 87.2% and 89.5%, which is slightly larger than the accuracy, which means that the false positive performance of the model varies in different folds. The recall rate remains at 92%- 95%, which is relatively stable, and the highest rate of 95% is also reached in the fifth fold. This indicates that the model can correctly identify positive samples and reduce the false negative rate. The F1 value for each fold changes slightly. The F1 value combines precision and recall, reflecting the model’s overall performance. Small fluctuations indicate that the model maintains good consistency in predicting the positive class. The 10-fold cross-validation results show a stable state overall.
Table 3.
Impact of CD stress on soybean yield.
| Cadmium Concentration (mg/kg) | Actual Soybean Yield (kg/acre) | Model Predicted Yield (kg/acre) |
|---|---|---|
| 0 | 250 | 249.5 |
| 0.5 | 240.3 | 239.7 |
| 1 | 225.6 | 226.3 |
| 2 | 200.8 | 201.6 |
| 5 | 150.3 | 152.7 |
The paper further understood the impact of CD stress on soybean yield in the experimental analysis. Comparing the actual yield of soybeans under different cadmium concentrations with the model-predicted yield can better help understand the potential harm of cadmium pollution to soybean production. Table 3 shows the data on the impact of CD stress on soybean yield.
From the data in Table 3, it can be seen that with the increase of cadmium concentration in the soil, the actual yield of soybeans decreased significantly, showing a negative correlation. When the cadmium concentration increased from 0 mg/kg to 5 mg/kg, the actual yield decreased from 250 kg/mu to 150.3 kg/mu, a decrease of about 40%. The model’s predicted yield and actual yield were roughly consistent, but at high cadmium concentrations, the prediction error increased, especially at 5 mg/kg, when the actual yield was lower than the predicted yield. This shows that although the model can predict soybean yield well at low concentrations, under high-concentration CD stress, the model may not fully reflect the decline in actual yield and needs further optimization.
Discussion
This study combined unmanned aerial vehicle hyperspectral remote sensing images with machine learning models to deeply analyze the effects of CD stress on soybean physiological and ecological characteristics and yield. It discussed the application potential of hyperspectral technology in agricultural pollution monitoring. Using soybean field data obtained from UAV remote sensing images, the paper analyzed the effects of CD stress on soybean chlorophyll, malondialdehyde content, soluble sugar, and antioxidant enzyme activity. The results showed that increased cadmium concentration would inhibit soybean photosynthesis and sugar metabolism and aggravate oxidative damage to the plant. The red edge and short-wave infrared bands showed obvious reflectance changes by comparing the reflectance of different bands to analyze the effects of CD stress on soybean cell structure, photosynthesis, and water content. Based on the spectral characteristics, a hyperspectral recognition model was constructed, and the Transformer model was used to effectively classify and identify soybeans under CD stress and predict their yield changes. In the model evaluation, the Transformer model showed excellent performance with an accuracy of 92.8%, a recall of 95%, and an F1 score of 92.1%. The 10-fold cross-validation showed that the model performed stably on different data sets, with accuracy and recall maintained at a high level. This study shows that the combination of UAV hyperspectral remote sensing images and machine learning models provides effective technical support for the detection and yield prediction of cadmium-stressed soybeans.
Conclusions
This paper uses UAV hyperspectral images to study the effects of CD stress on soybeans. It constructs a stress impact model by preprocessing remote sensing images through wavelet transform and principal component analysis, as well as cadmium concentration and plant physiological indicators. The Transformer model was used to optimize feature selection, identify different stress levels, and finally establish a yield prediction model through collinearity analysis and recursive feature elimination. However, the model is limited by the spatial and temporal resolution of the impact. In the future, the prediction accuracy can be optimized by increasing the image frequency and multi-temporal data to improve the reliability and application scope of the model.

