

Introduction
Crop straw, the largest agricultural biomass resource globally, has emerged as a pivotal element in agroecological transformation through sustainable management [1]. According to FAO statistics, approximately 2.03 billion tons of crop residues are generated worldwide annually, yet underutilization of 60% results in wasted energy potential equivalent to 470 million tons of standard coal [2, 3]. Despite maintaining grain production exceeding 650 million tons in China for 19 consecutive years, 2023 witnessed 867 million tons of straw production with persistent open-field burning rates of 12-15% [4, 5]. This resource mismanagement creates a dual environmental crisis: annual emissions of 210 million tons of CO2 equivalent and 290,000 tons of PM2.5 from burning practices, compounded by excessive fertilizer use contributing 7.3% of national carbon emissions and 51.2% originating from nitrogen fertilizer production [6, 7]. Addressing these challenges necessitates synergistic mechanisms integrating straw valorization with fertilizer substitution.
The carbon mitigation benefits of fertilizer-oriented straw utilization exhibit multi-dimensional synergies [8]. From material cycling perspectives, each ton of straw substitutes 0.15 tons of urea, 0.03 tons of diammonium phosphate, and 0.12 tons of potassium chloride, directly reducing industrial emissions [9, 10]. Soil carbon sequestration analysis reveals 18.7-24.3% increases in topsoil organic carbon stocks through long-term straw incorporation, with sequestration rates reaching 0.35-0.72 t/ha·yr [11]. System optimization further demonstrates a 12.7 kg CO2e/t reduction in indirect emissions from transportation and burning [12]. Despite progress, three scientific barriers persist:
(1) Inadequate understanding of spatial heterogeneity, with current studies disproportionately focusing on Northeast China’s black soil region and North China Plain [13, 14]; (2) Insufficient temporal resolution, as most analyses rely on cross-sectional data or sub-five-year sequences, failing to capture long-term dynamics under China’s dual-carbon strategy; (3) Absence of policy coordination frameworks integrating resource endowment, technological efficiency, and institutional environments.
The study’s original contributions are evident in three dimensions. Methodologically, it develops an innovative assessment framework that integrates spatial econometrics with system dynamics, overcoming the scale limitations of conventional life cycle assessment (LCA) methods. Theoretically, it quantifies the spatial spillover effects of straw utilization, advancing locational optimization theory in agroecological engineering. Practically, it proposes a “zoning-tiering-classification” optimization strategy, directly supporting China’s Agricultural and Rural Emission Reduction and Carbon Sequestration Implementation Plan.
Materials and Methods
Data Sources
This study integrates multi-dimensional authoritative datasets, adhering to open science principles. Crop production data (2015-2024) for staple crops (rice, wheat, maize) and cash crops (cotton, rapeseed) were extracted from the China Statistical Yearbook (National Bureau of Statistics) and cross-validated via the official portal (http://www.stats.gov.cn). Fertilizer application data (N, P₂O₅, K₂O) were sourced from the China Rural Statistical Yearbook (Ministry of Agriculture and Rural Affairs, 2015-2024 editions) with full temporal coverage. Provincial administrative boundaries (1:4,000,000 scale) were obtained from the National Geomatics Center of China. For East Asia, climate zoning coefficients followed the national standard GB/T 34808-2017. Straw-to-grain ratios were adjusted using FAO’s Crop Residue Management Guidelines (2021).
Straw Nutrient Resource Estimation
Straw yield was calculated based on crop economic output and straw-to-grain ratios. Nutrient availability was determined through stoichiometric relationships between straw yield and elemental composition (Table 1). Calculations focused on macronutrients (N, P, K) using the following Equations [15]:
where Mt–dry, MtN, MtP2O5, and MtK2O represent the total straw yield, nitrogen nutrient content, phosphorus nutrient content, and potassium nutrient content, respectively. Ni, Pi, and Ki denote the dry-matter nutrient content ratios of nitrogen, phosphorus, and potassium in the straw of crop iii. λi is the climate zoning adjustment coefficient, assigned as follows to enhance regional adaptability: 1.05 for the humid Northeast region, 0.97 for the semi-arid North China region, and 1.12 for the rainy Southern region. The coefficients 2.29 and 1.20 represent the conversion factors for elemental phosphorus to P2O5 and elemental potassium to K2O, respectively.
Table 1.
Ratios of straw to grain and dry matter nutrient content proportions for crops.
Carbon Mitigation Potential Estimation of Straw Fertilizer Substitution
This study established a dynamic assessment model integrating regional straw production and nutrient equivalency to quantify the carbon reduction potential of fertilizer-oriented straw utilization in replacing synthetic fertilizers. The methodology calculates emission reductions by comparing baseline fertilizer-induced emissions with post-substitution scenarios through the following Equations:
where CF–S represents the carbon emission reduction potential from straw fertilization, CF denotes the total carbon emissions from chemical fertilizer application, and CS represents the carbon emissions reduced by replacing chemical fertilizers with straw nutrients. Fij is the actual amount of fertilizer type iii applied in region j, while Cij is the amount of straw-derived nutrients that replace fertilizer type i in region j. qi refers to the carbon emission coefficient for fertilizer type i. In this study, the carbon emission coefficients for nitrogen (N), phosphorus (P), and potassium (K) fertilizers are set as 2.116 kg CO2e/kg, 0.636 kg CO2e/kg, and 0.180 kg CO2e/kg, respectively.
Spatiotemporal Evolution of Carbon Mitigation through Straw Fertilization
To quantify regional disparities in agricultural carbon mitigation across China’s 31 provinces, we employed the Theil index, an entropy-based statistical measure for assessing resource distribution inequality. This decomposition approach enables the identification of inter-regional and intra-regional disparity sources, providing theoretical foundations for spatial optimization.
Theil Index Formulation
The generalized Theil index is calculated as [16]:
where T represents the total Theil index, reflecting the overall inequality in the distribution of carbon emission reduction potential across provinces. N is the total number of provinces, yi denotes the carbon mitigation value of province i, and y̅ represents the national mean carbon mitigation value. A higher Theil index indicates greater regional disparity in carbon reduction potential.
Spatial Distribution Patterns and Regional Clustering Characteristics of Carbon Mitigation
This study employs spatial autocorrelation analysis encompassing global and local perspectives to investigate the spatial distribution patterns and regional clustering characteristics of carbon mitigation potential through straw fertilization [17, 18]. This geostatistical approach quantitatively evaluates spatial dependence among adjacent regions, revealing spatial aggregation patterns and regional disparities in agricultural carbon management.
Global Spatial Autocorrelation
The global Moran’s Index (Moran’s I) was calculated to assess the overall spatial distribution patterns across China:
where n represents the number of provincial units (31), Wij is the spatial weight matrix indicating the adjacency relationship between unit i and j. xi and xj denote the carbon mitigation values of provinces i and j, respectively, and x̅ is the national mean carbon mitigation value. The value of Moran’s I ranges between [−1,1]. I>0 indicates a positive spatial correlation, meaning that similar values tend to cluster (i.e., high-carbon reduction areas or low-carbon reduction areas group together). I<0 suggests a negative spatial correlation, implying that dissimilar values are spatially adjacent (i.e., high-carbon reduction areas are surrounded by low-carbon reduction areas and vice versa). I = 0 represents a random spatial distribution with no discernible clustering pattern.
Local Spatial Autocorrelation (LISA)
Local Indicators of Spatial Association (LISA) were computed to identify localized clustering patterns:
where Ii represents the local spatial autocorrelation index for province i. Ii>0 indicates a positive spatial correlation, which includes “high-high” clustering and “low-low” clustering. Ii<0 suggests a negative spatial correlation, which includes “high-low” clustering and “low-high” clustering, reflecting significant spatial disparities in carbon mitigation between neighboring regions.
Division of the Study Area
In accordance with the classification standards outlined in the China Regional Economic Statistical Yearbook and the policy adjustments specified in the State Council’s Guiding Opinions on Promoting Coordinated Regional Development ([2018] No. 24), this study divides mainland China’s 31 provincial-level administrative divisions (excluding Hong Kong, Macao, and Taiwan) into three major economic regions:
Eastern Region: Liaoning, Hebei, Beijing, Tianjin, Shandong, Jiangsu, Shanghai, Zhejiang, Fujian, Guangdong, and Hainan.
Central Region: Heilongjiang, Jilin, Shanxi, Henan, Anhui, Hubei, Hunan, and Jiangxi.
Western Region: Sichuan, Chongqing, Guizhou, Yunnan, Tibet Autonomous Region, Shaanxi, Gansu, Qinghai, Ningxia Hui Autonomous Region, Xinjiang Uygur Autonomous Region, Inner Mongolia Autonomous Region, and Guangxi Zhuang Autonomous Region.
Results
Straw Yield of 31 Provinces in China
From 2014 to 2023, China’s crop residue production exhibited distinct spatiotemporal distribution patterns across provincial-level administrative regions (Fig. 1). Geospatial analysis revealed pronounced regional disparities, with agricultural powerhouses in northern China, including Heilongjiang, Henan, and Shandong, maintaining consistently high output levels. Notably, Heilongjiang and Henan emerged as national leaders in residue generation, both sustaining annual production exceeding 8.0×10⁸ t throughout the study period. In contrast, eastern coastal regions such as Shanghai and Hainan demonstrated substantially lower outputs, with annual averages below 5.0×10⁶ t. This spatial heterogeneity strongly correlates with regional variations in cultivated land resources and agricultural activity intensity.
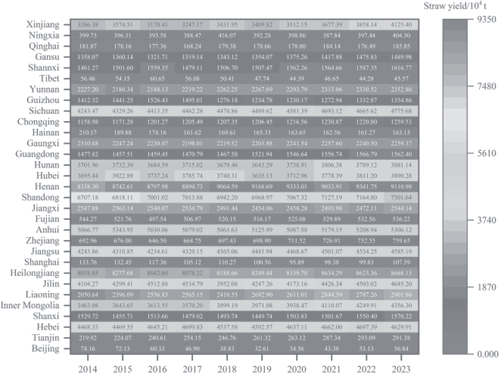
Temporal analysis revealed oscillatory patterns in national residue production over the decade. Several major agricultural provinces displayed moderate growth trends, exemplified by Heilongjiang’s residue output increasing from 8.04×10⁸ t in 2014 to 8.67×10⁸ t in 2023, representing an average annual growth rate of approximately 1%. Henan Province maintained production dominance despite temporary fluctuations, achieving 9.11×10⁸ t in 2023. Conversely, Beijing experienced a notable 23.4% reduction in residue generation, declining from 7.42×10⁶ t to 5.68×10⁶ t, attributable to urban expansion and arable land conversion. The most striking growth occurred in Xinjiang, where residue production surged by 21.8%, from 3.39×10⁸ t to 4.13×10⁸ t, reflecting substantial agricultural expansion in northwest China.
Regional production characteristics are further manifested in crop-specific patterns. Eastern provinces, including Jiangsu and Shandong, maintained stable high outputs of 4.59×10⁸ t and 7.30×10⁸ t, respectively, in 2023, primarily from wheat-rice rotation systems. Central agricultural zones encompassing Anhui, Henan, and Hubei demonstrated production stability with marginal increases, exemplified by Anhui’s 4.7% growth from 5.07×10⁸ t to 5.31×10⁸ t. Western regions displayed the most dynamic changes, particularly Xinjiang’s remarkable annual growth rate of 2.2%, which is closely associated with agricultural restructuring and cultivation area expansion in China’s western development initiatives.
Nutrients in China’s Straw
China’s total crop residue nutrient resources demonstrated a sustained growth trajectory from 2014 to 2023, comprising nitrogen (N), phosphorus (P), and potassium (K) as the primary components (Table 2). Over the decade, the aggregate nutrient content increased from 1.93×10⁷ t to 2.11×10⁷ t, representing a 9.05% cumulative growth. Component analysis revealed differentiated growth patterns: nitrogen content rose from 7.34×10⁶ t to 8.11×10⁶ t (10.51% increase), phosphorus from 1.04×10⁶ t to 1.14×10⁶ t (10.32%), and potassium from 1.09×10⁷ t to 1.18×10⁷ t (7.96%). The proportional distribution remained stable throughout the study period, with potassium dominating at 56-58% of total nutrients, followed by nitrogen (37-39%), while phosphorus constituted approximately 5%.
Post-2019 acceleration marked the nutrient growth patterns, particularly in nitrogen resources, which expanded from 7.66×10⁶ t to 8.11×10⁶ t at an annualized rate of 1.44%. Despite moderate relative growth, potassium maintained its quantitative dominance, with absolute quantities increasing by 8.70×10⁶ t over the decade. Stability analysis through coefficient of variation (CV) measurements revealed potassium’s superior interannual consistency (CV = 2.36%), compared to phosphorus (3.01%) and nitrogen (3.12%). This low variability profile confirms the overall stability of China’s crop residue nutrient resources, with potassium demonstrating particularly robust supply reliability across agricultural production systems.
Table 2.
Total Nitrogen, Phosphorus, and Potassium Nutrients in China’s straw.
Carbon Emission Reduction Potential of Fertilized Straw Utilization in China
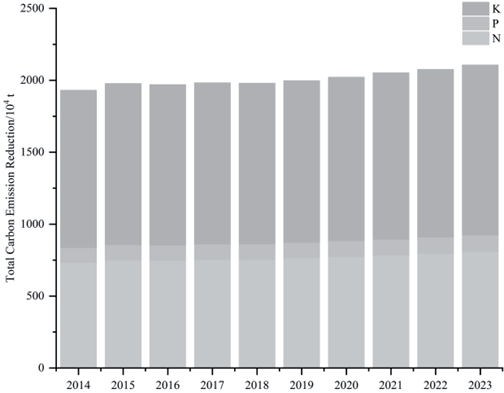
China’s decarbonization potential through straw fertilizer utilization demonstrated consistent growth from 2014 to 2023, with total carbon reduction capacity increasing from 1.81×10⁷ t to 2.00×10⁷ t, representing a 10.23% cumulative enhancement (Fig. 2). Element-specific analysis revealed differentiated contribution patterns: nitrogen-based reduction dominated the process, expanding from 1.55×10⁷ t to 1.72×10⁷ t (10.50% growth) while maintaining a >85% share of total reductions. Phosphorus contributions grew 10.33%, from 6.59×10⁵ t to 7.27×10⁵ t, providing stable baseline support despite its modest 3-4% proportion. Potassium exhibited complementary functionality with a 7.96% increase (1.97×10⁶ t to 2.12×10⁶ t), consistently accounting for approximately 10% of total mitigation capacity.
Post-2019 acceleration marked a pivotal transition, with the annual nitrogen reduction growth rate doubling to 1.44% during 2019-2023. This phase coincided with agricultural expansion, widespread adoption of resource recovery technologies, and enhanced policy incentives. Concurrent stabilization occurred in phosphorus (1.8% annual growth) and potassium (1.6%) contributions, reinforcing integrated straw utilization’s decarbonization efficacy. Structural analysis confirmed remarkable stability in elemental contribution ratios throughout the decade: nitrogen maintained an 85±0.5% share, potassium 10±0.3%, and phosphorus 3.5±0.2%. This persistent proportionality demonstrates effective synergy among nutrient-specific reduction mechanisms, ensuring comprehensive realization of carbon mitigation potential through optimized elemental coordination.
Regional Variations in the Carbon Reduction Potential of Straw Fertilization
Between 2014 and 2023, the Theil index measuring the carbon reduction potential of straw fertilizer utilization in China showed minor fluctuations, stabilizing within the range of 3.84 to 3.90 (Table 3). This pattern suggests that regional disparities in carbon mitigation benefits persisted but did not widen significantly. The national Theil index decreased slightly from 3.87 in 2014 to 3.84 in 2023, indicating a gradual spatial equalization of carbon reduction efficiency across the country.
Geographically, eastern China consistently exhibited the highest Theil index, reaching 1.86 in 2023, primarily due to its industrialized economy, complex agricultural systems, and uneven provincial adoption of straw utilization technologies. These factors amplified intra-regional differences in carbon mitigation outcomes. In contrast, central China demonstrated remarkable stability, with its Theil index hovering between 0.54 and 0.57 over the decade, reflecting balanced and coordinated practices in straw fertilization. Western China emerged as the most improved region, with its Theil index declining significantly from 1.48 in 2014 to 1.41 in 2023. This progress aligns with targeted green agricultural policies promoting straw return and composting, which have enhanced regional coordination in carbon reduction.
Notably, intra-regional Theil indices remained extremely low (around 0.01) across all zones, implying minimal internal disparities within the eastern, central, and western regions. The dominant contributor to national inequality stemmed from inter-regional differences, driven by variations in agricultural resources, policy implementation intensity, and economic development levels.
Temporal trends revealed divergent pathways. Eastern China experienced a marginal rise in its Theil index, signaling persistent utilization gaps among its provinces. Conversely, western China achieved substantial harmonization through large-scale straw recycling initiatives, particularly after 2018, when the national Theil index stabilized near 3.85. This stabilization marks the synergistic effects of policy interventions and technological dissemination, such as the widespread adoption of straw incorporation techniques to reduce chemical fertilizer use.
The evolving spatial patterns underscore the critical influence of region-specific agricultural modernization strategies. While the western regions benefit from centralized policy-driven transformations, the eastern areas face challenges reconciling industrial development with sustainable farming practices. These dynamics highlight the need for differentiated governance approaches to optimize nationwide straw-derived carbon mitigation benefits.
Global Spatial Autocorrelation Analysis
The global spatial autocorrelation analysis of carbon mitigation potential through straw fertilizer utilization revealed consistent positive associations from 2014 to 2023, as evidenced by Moran’s I indices ranging between 0.211 and 0.243 (Table 4). These statistically significant values (p<0.05 throughout the study period) confirm non-random spatial clustering patterns, with provinces exhibiting either high-value or low-value agglomerations in decarbonization capacity. The strongest spatial autocorrelation emerged in 2016 (Moran’s I = 0.243, z-score = 2.331), potentially associated with nationwide agricultural policy intensification and concentrated promotion of straw utilization technologies during this pivotal year.
Interannual analysis demonstrated remarkable stability in spatial clustering characteristics, with Moran’s I maintaining values above 0.210 despite minor fluctuations. Standard deviation parameters remained constrained between 0.113 and 0.124, confirming measurement reliability. While 2018 and 2020 showed marginally lower indices (0.211), these transient variations likely reflect short-term fluctuations in cultivation areas and utilization efficiencies rather than structural spatial pattern alterations.
Geospatial distribution patterns revealed distinct clustering mechanisms. High-capacity provinces are predominantly concentrated in northeastern and central China’s grain production belts, benefiting from abundant straw resources and policy advantages. Conversely, western and selected eastern regions formed persistent low-capacity clusters, constrained by resource limitations and suboptimal utilization rates. The sustained spatial autocorrelation underscores the enduring influence of regional agricultural infrastructure development and technology diffusion patterns on decarbonization potential realization.
Local Spatial Autocorrelation Analysis
Local spatial autocorrelation analysis delineated evolving provincial patterns in straw fertilizer-based carbon mitigation potential across distinct clustering types: high-high (HH), low-low (LL), high-low (HL), and low-high (LH). Longitudinal examination of 2014, 2019, and 2023 data revealed stabilized spatial configurations with intensified HH concentration and persistent LL dispersion (Fig. 3). Central and northeastern provinces (Henan, Heilongjiang, Jilin) demonstrated strong regional coordination, contrasting with fragmented spatial associations in eastern coastal areas (Beijing, Zhejiang) and western regions (Qinghai, Ningxia).
Table 3.
Theil index of carbon emission reduction potential from fertilized straw utilization in China (2014-2023).
Table 4.
Global Moran's I index of carbon emission reduction potential from fertilized straw utilization (2014-2023).
Persistent HH clusters emerged across agricultural heartlands, including Hebei, Jilin, Heilongjiang, Jiangsu, Anhui, Shandong, Henan, and Hubei, maintaining stable spatial autocorrelation throughout the study period. These regions exhibited 1.5-2.3×10⁷ t annual carbon mitigation capacity, supported by intensive crop cultivation (7.8-9.1×10⁷ t straw production) and advanced resource recovery rates (68-72%). Northeastern provinces exemplified this pattern, where Heilongjiang’s mitigation potential increased from 1.98×10⁷ t to 2.31×10⁷ t, correlating with a 12.5% improvement in straw utilization efficiency.
LL clusters are concentrated in economically developed but agriculturally limited regions (Beijing, Tianjin, Shanghai, Zhejiang, Fujian, Guangdong), demonstrating consistently low mitigation capacities below 5.0×10⁵ t. These areas showed 38-45% lower straw recovery rates than national averages, with Beijing’s mitigation potential declining from 6.84×10⁴ t to 5.12×10⁴ t despite 15% urban agricultural expansion.
Fig. 3.
Cluster types of carbon emission reduction potential from fertilized straw utilization in 2014, 2019, and 2023.
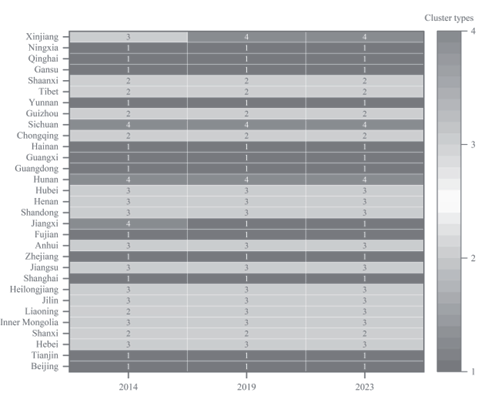
Spatiotemporal transitions revealed dynamic provincial trajectories. Liaoning transitioned from the LH (2014) to the HH cluster (2023), achieving 1.42×10⁷ t mitigation capacity through enhanced green agricultural policies and a 25% improvement in the straw recovery rate. Conversely, Jiangxi shifted from the HL to the LL cluster, reflecting an 18% reduction in mitigation potential (2.07×10⁶ t to 1.71×10⁶ t) associated with technology diffusion lags. Western regions displayed persistent spatial disparities, with Xinjiang maintaining HL status (3.85×10⁶ t mitigation capacity) despite 32% higher provincial utilization rates than neighboring areas.
This spatial evolution underscores the dual influence of endogenous agricultural capacity and exogenous policy interventions. HH cluster stability correlates with regional straw production exceeding 6.5×10⁷ t and policy investment intensity above 120 CNY/t, while LL regions demonstrate inverse relationships between economic development levels (per capita GDP>12,000 USD) and agricultural decarbonization priorities.
Discussion
As the most abundant biomass waste generated during agricultural production, the resource utilization of crop straw has long been a pivotal research topic in agricultural science [19, 20]. Current studies predominantly focus on fertilizer-oriented utilization strategies, including straw return to fields, mulching, biochar production, and organic fertilizer preparation – all representing organic recycling approaches that reintegrate straw into agricultural ecosystems and soil nutrient cycles [21, 22]. Notably, this circular process demonstrates significant carbon sequestration and emission reduction effects, a phenomenon consistently validated by multiple studies [23]. Given China’s status as a major agricultural producer generating massive quantities of straw annually, assessing the carbon mitigation potential of straw-based fertilization necessitates preliminary quantification of national straw resources.
Considerable discrepancies exist among existing straw resource estimates, primarily attributable to variations in crop selection and straw-to-grain ratios. Yang et al. estimated 772 million tons (Mt) of straw production in 2020 using region-specific ratios for 13 crops [24], while Liu et al. reported approximately 800 Mt based on uniform ratios for 15 crops [25]. Aligning with Xu et al., this study employs standardized straw-to-grain ratios for 9 major crops, considering collection feasibility, yielding annual straw outputs of 830 Mt (2020), 846 Mt (2021), 855 Mt (2022), and 867 Mt (2023) [26].
Regarding straw nutrient quantification, existing research predominantly concentrates on regional analyses (Northeast China, Yellow River Basin, Yangtze River Delta) or specific crops (wheat, maize, rice), with national-scale nutrient estimates largely outdated pre- 2020 [27]. Our findings reveal 21.1 Mt of total nutrient content in 2023 straw resources, with potassium constituting 56.07% (11.83 Mt). Comparative analysis with China’s 2023 fertilizer application data (26.2 Mt of pure nutrients excluding compound fertilizers: 16.0 Mt nitrogen, 5.4 Mt phosphorus, and 4.8 Mt potassium) indicates that straw nutrients could potentially substitute 50.63% of nitrogen, 20.37% of phosphorus, and 245.83% of potassium fertilizer demand.
The carbon mitigation potential of straw fertilization was evaluated through life-cycle emission factors adapted to China’s fertilizer production context. Results demonstrate increasing carbon reduction capacity, reaching 20.0 Mt CO2-eq in 2023, equivalent to 52.4% of total fertilizer manufacturing emissions (38.2 Mt CO2-eq). Regional analysis reveals complete offset potential for specific nutrient emissions in major agricultural provinces (e.g., Jilin and Heilongjiang). Spatial patterns show higher mitigation effects in nitrogen-intensive grain belts and enhanced ecological benefits in phosphorus/potassium-rich regions.
Theil index analysis indicates decreasing regional disparities in mitigation potential, particularly in western China, reflecting improved straw utilization under green agriculture policies. However, persistent imbalances in eastern regions suggest economic and agricultural structural influences. Spatial autocorrelation reveals significant clustering patterns: “high-high” agglomerations in Northeast/Central China versus “low-low” clusters in coastal and western areas. Dynamic shifts, such as Liaoning’s transition from “low-high” to “high-high” status, highlight policy effectiveness, while Jiangxi’s regression to “low-low” signals efficiency decline risks. Future strategies should emphasize inter-regional collaboration, technology transfer, and policy coordination to optimize spatial patterns and narrow regional mitigation gaps.
Conclusions
This study systematically evaluates the spatiotemporal evolution of China’s straw resources, nutrient content, and carbon mitigation potential through straw fertilization from 2014 to 2023. Key findings reveal sustained growth in both straw availability and associated carbon reduction capacity, accompanied by pronounced regional disparities and distinct spatial clustering patterns. The primary agricultural zones in Northeast and Central China maintain superior performance, exhibiting stable “high-high” clustering characteristics in carbon mitigation potential. Conversely, coastal eastern regions and partial western areas demonstrate constrained potential due to resource limitations, forming persistent “low-low” clusters. Theil index analysis indicates mitigated inter-regional disparities at the national scale, while intra-regional imbalances remain significant.
Enhancing straw fertilization efficiency proves crucial for advancing agricultural green transformation and supporting national carbon neutrality objectives. Future strategies should prioritize inter-regional collaboration, resource optimization, and targeted technological breakthroughs in low-performance zones. Implementing these measures will enable balanced improvement of straw valorization benefits nationwide, ultimately providing robust support for carbon reduction and ecological sustainability in the agricultural sector.

