

Introduction
Global climate change is a shared crisis and challenge facing society today. The increasing concentration of greenhouse gases, including carbon dioxide (CO2), methane (CH4), and nitrous oxide (N2O), has intensified the risks associated with global climate change [1- 3]. Addressing climate change has become a global consensus. The Paris Agreement explicitly sets a goal of limiting global temperature rise to below 2°C, with efforts to keep it within 1.5°C, to prevent severe impacts from extreme weather and ecosystem degradation [4, 5]. The Intergovernmental Panel on Climate Change (IPCC) warns that if the global temperature increase is to be kept within 1.5°C, the remaining global carbon budget is approximately 400 billion tons of CO2 equivalent, emphasizing the urgency of immediate and substantial emission reduction measures [6].
As a significant participant and active contributor to global climate governance, China has been proactive in promoting greenhouse gas emissions reductions [7, 8]. At the 75th session of the United Nations General Assembly, China announced its ambitious “dual carbon” goals of achieving peak carbon emissions by 2030 and carbon neutrality by 2060 [9, 10]. These commitments highlight China’s responsibility and leadership in global climate governance. However, as China’s second-largest source of greenhouse gas emissions, agriculture plays a pivotal role in achieving these goals [11-14]. Agricultural activities contribute approximately 13% of the nation’s total greenhouse gas emissions, making it a critical sector for mitigation. The livestock industry is a primary emitter within agriculture, accounting for about 43% of agricultural greenhouse gas emissions, with significant environmental impacts [15, 16].
Livestock carbon emissions mainly stem from biological processes, including animal respiration, gastrointestinal fermentation in ruminants, and livestock manure management [17]. Gastrointestinal fermentation in ruminants is the predominant source of methane emissions in livestock production [18, 19], accounting for approximately 43.7% of total methane emissions, followed by manure management [20]. Both sources significantly impact air quality, climate, and ecological systems. Although livestock-related greenhouse gas emissions in China have declined in recent years, they still account for a substantial proportion of agricultural emissions. Their distribution is highly influenced by geographic, climatic, and developmental factors, leading to pronounced regional imbalances. These disparities manifest not only in emission levels across regions but also in the decoupling status between livestock carbon emissions and economic output, carbon carrying capacity, and the spatial distribution characteristics of the carbon pressure index.
Despite progress in controlling livestock carbon emissions, several challenges remain. On the one hand, traditional production models and technologies limit further reductions in carbon intensity [21]. On the other hand, imbalances in emission reductions across and within regions hinder the nationwide transition to low-carbon development. Therefore, a comprehensive assessment of the spatiotemporal characteristics, decoupling status, and regional disparities in livestock carbon emissions is crucial for understanding the underlying mechanisms and informing the design of region-specific low-carbon policies.
Against this backdrop, this study examines livestock carbon emissions in China from 2003 to 2022 using decoupling analysis, carbon carrying capacity estimation, carbon pressure index evaluation, Theil index decomposition, and spatial autocorrelation analysis. The aim is to reveal the impact of livestock carbon emissions on ecological systems and regional development, providing insights and policy recommendations for achieving a low-carbon transition in the livestock sector under the “dual carbon” goals.
Materials and Methods
Data Sources
The data used in this study include livestock inventory, slaughter numbers, and livestock output value, sourced from the China Statistical Yearbook and China Rural Statistical Yearbook (2004-2023). The foundational data for calculating ecosystem carbon carrying capacity, such as forest and grassland coverage, crop yields, fertilizer application, total agricultural machinery power, sown area, and irrigated area, were primarily obtained from the China Statistical Yearbook (2004-2023), regional statistical yearbooks, China Rural Statistical Yearbook (2004-2023), the EPS database, and data from the Ministry of Natural Resources and the National Forestry and Grassland Administration. Various estimation coefficients were derived from the relevant research findings of domestic and international scholars. Missing data were addressed using linear interpolation with values from adjacent years, and the mean values of relevant indicators over the past five years were applied for canonical correspondence analysis.
Research Methods
Livestock Carbon Emission Accounting
The carbon emissions of livestock, including cattle, horses, mules, donkeys, pigs, sheep, and poultry, are calculated using the carbon emission factor method [22]. The CO2 equivalent is estimated using the following formulas:
Where Et is the total CO2 equivalent emissions; ECH4 represents the CH4 emissions converted to CO2 equivalents; EN2O represents the N2O emissions converted to CO2 equivalents; eCH4 and eN2O are the global warming potential values of CH4 and N2O, set at 21 and 310, respectively [23]; Ni is the average number of livestock of type i; αi and βi are the CH4 and N2O emission factors, respectively (see Table 1). Due to the varying production cycles of livestock, the annual average livestock numbers must be adjusted. Adjustments are required for pigs and poultry, whose production cycles are 200 and 55 days, respectively. The adjustment method is as follows:
Where N is the average number of livestock; Herdsend is the year-end inventory; Days, is the production cycle; and C is the annual number of livestock sold.
Decoupling Analysis
This study employs the decoupling elasticity coefficient method for quantitative analysis to explore the relationship and dynamic interactions between livestock carbon emissions and economic growth. Decoupling analysis is a widely used tool to assess the coupling relationship between economic activity and environmental pressure [25, 26]. It reveals whether economic growth is accompanied by changes in resource consumption and environmental pollution, providing critical insights for achieving low-carbon development goals. Based on elasticity analysis principles, the method calculates the ratio of the growth rate of carbon emissions to the growth rate of economic output, thereby determining the state and degree of decoupling. The formula is as follows:
Where ΔCt/Ct represents the growth rate of carbon emissions; ΔGDPt/GDPt represents the growth rate of livestock economic output. Calculating the decoupling elasticity coefficient over different periods allows the relationship between economic activities and carbon emissions to be identified and categorized into several states, as shown in Table 2.
Table 1.
Greenhouse gas emission factors for livestock in China (kg/head/year) [24].
| Emission Factor | Cattle | Mule | Donkey | Horse | Pig | Sheep | Poultry |
|---|---|---|---|---|---|---|---|
| CH₄ (Enteric Fermentation) | 68 | 10 | 10 | 18 | 1 | 5 | - |
| CH₄ (Manure Management) | 16 | 0.9 | 0.9 | 1.64 | 3.5 | 0.17 | 0.02 |
| N₂O (Manure Management) | 1 | 1.39 | 1.39 | 1.39 | 0.53 | 0.33 | 0.02 |
Table 2.
Decoupling state discrimination.
Carbon Carrying Capacity
Carbon carrying capacity (carbon sequestration) refers to the amount of CO2 that vegetation within a region can fix through photosynthesis [27]. Livestock carbon carrying capacity specifically denotes the maximum ability of an ecosystem within a region to net absorb CO2 emissions generated by livestock activities over a given period. In calculating the provincial carbon carrying capacity, this study primarily considers the carbon sequestration capacities of forests, grasslands, and farmland ecosystems. The formulas used to calculate the carbon carrying capacity are as follows:
Where CC is the regional carbon carrying capacity; CCF and CCG represent the carbon sequestration capacities of forests and grasslands, respectively; CCP represents the carbon sequestration capacity of farmland (as shown in Table 3); MI is the area of the I-th type of vegetation; SI is the annual average carbon sequestration capacity of the I-th type of vegetation. Based on domestic and international research findings, the carbon sequestration coefficients are selected as follows: The forest carbon sequestration coefficient is 3.81 t/hm², and the grassland carbon sequestration coefficient is 0.21 t/hm².
Based on the above formulas, the carbon sequestration capacities of forest, grassland, and farmland ecosystems can be calculated. Summing these values provides the total carbon-carrying capacity of the regional ecosystem. Building on this, a livestock carbon carrying capacity (LCC) model was developed to assess how much the regional ecosystem’s total carbon-carrying capacity offsets the CO2 emissions generated by livestock activities. This study utilizes recent data on regional livestock-added value and gross regional product (GRP) to estimate the actual contribution of livestock to regional economic development. Using these economic contribution values, the livestock carbon-carrying capacity is calculated as the proportion of the regional ecosystem’s total carbon-carrying capacity allocated to livestock activities. The specific formula is as follows:
Table 3.
Accounting formula for farmland carbon sequestration.
Where LCC is the region’s livestock carbon carrying capacity; CC is the total carbon carrying capacity of the regional ecosystem; r is the livestock carbon carrying capacity coefficient, calculated as the ratio of livestock added value to gross regional product (GRP).
Livestock Carbon Pressure Index Calculation
The Carbon Pressure Index (LCPI) is a novel environmental metric developed to quantify the environmental pressure exerted by livestock carbon emissions, taking into account both carbon emissions and the carbon sequestration capacity of regional ecosystems. Unlike other commonly used environmental impact indices, such as carbon emission intensity or ecological footprint, the LCPI uniquely integrates the carbon carrying capacity of the region’s ecosystems, providing a holistic view of carbon sustainability.
Carbon emission intensity typically measures the emissions produced per unit of economic output or activity, such as carbon emissions per unit of GDP. While useful for assessing carbon efficiency, it does not incorporate the broader ecological context of carbon absorption and sequestration. In contrast, the ecological footprint measures the land area required to support human activities and absorb the carbon emissions generated. Although valuable in understanding ecological imbalances, it does not directly focus on the specific carbon emission activities of sectors like livestock farming.
The LCPI, however, is particularly suited for this study as it directly addresses the specific environmental pressures caused by livestock emissions in relation to the region’s carbon sequestration capacity. This dual consideration of emissions and carbon absorption makes the LCPI a more context-specific tool for assessing livestock-related environmental pressures, offering valuable insights into the sustainability of the livestock sector’s contribution to the regional carbon balance. The LCPI model is as follows:
LCPI = 0.5 indicates a balance between the ecosystem’s carbon sequestration capacity (CC) and livestock carbon emissions (TCC), serving as the critical threshold for ecological safety in livestock activities. If LCPI approaches or equals 1, livestock carbon emissions significantly exceed the ecosystem’s carbon carrying capacity, implying severe environmental risks. Conversely, when LCPI approaches or falls below 0.5, the ecological environment is considered safe for livestock activities. Based on the LCPI value, the environmental risks of regional livestock carbon emissions can be classified into five levels, ranging from “safe” to “extremely severe” (Table 4).
Theil Index
This study adopts the Theil index as the measurement tool to investigate the regional and intra-regional disparities in China’s livestock carbon pressure index. The Theil index is a commonly used decomposable inequality measure that effectively reflects overall differences and their sources, including inter-regional and intra-regional contributions [30, 31]. It serves as an essential tool for studying regional imbalance. The calculation formula is as follows:
In the formula, T represents the total Theil index, N is the number of provinces, yi is the carbon pressure index of the i-th province, and y̅ is all provinces’ average carbon pressure index. TQ denotes inter-regional disparity, reflecting the differences in average carbon pressure indices between regions, while TD represents intra-regional disparity, indicating the inequality in the distribution of carbon pressure indices within each region. Furthermore, R is the number of regions, Nr is the number of provinces in the r-th region, y̅ r is the average carbon pressure index of the r-th region, and Tr is the Theil index within the r-th region, calculated using the same formula as the total Theil index.
Spatial Autocorrelation Analysis
Spatial autocorrelation analysis includes both global and local spatial autocorrelation [30]. The global Moran’s I index measures the overall spatial autocorrelation of carbon emissions across regions, with values ranging from [-1, 1]. A value greater than 0 indicates a clustering pattern, with values closer to 1 showing a more pronounced clustering tendency. Conversely, a value less than 0 indicates a dispersed pattern, while 0 suggests no spatial correlation. The formula for calculating Moran’s I is as follows:
where n is the number of administrative units; Wij represents the spatial weight matrix between administrative units i and j; xi and xj are LCPI for units i and j; and x̅ is the mean LCPI across all units.
Table 4.
Classification of LCPIs and environmental risks.
| ACPI | ≤0.5 | 0.51-0.61 | 0.62-0.65 | 0.66-0.7 | >0.7 |
|---|---|---|---|---|---|
| Risk Level | I | II | III | IV | V |
| Risk Category | Safe | Low Risk | Moderate Risk | High Risk | Extreme Risk |
Local spatial autocorrelation examines spatial heterogeneity, meaning that the degree of spatial autocorrelation varies across regions. The Local Indicators of Spatial Association (LISA) is used to test local spatial autocorrelation:
In this formula, when Ii is greater than 0, it indicates a positive spatial correlation in the neighboring regions, which includes “high-high” and “low-low” types, where adjacent areas exhibit high (or low) carbon emission clustering. When Ii is less than 0, it indicates a negative spatial correlation, including “high-low” and “low-high” types, where adjacent regions show significant differences in LCPI.
Regional Divisions of the Study Area
In accordance with China’s official classification standards, we divided China into three regions for this study: the eastern, central, and western regions. The eastern region includes Beijing, Tianjin, Hebei, Liaoning, Shanghai, Zhejiang, Jiangsu, Fujian, Shandong, Guangdong, and Hainan. The central region comprises Shanxi, Jilin, Heilongjiang, Anhui, Jiangxi, Henan, Hubei, and Hunan. The western region includes Inner Mongolia, Guangxi, Chongqing, Sichuan, Guizhou, Yunnan, Tibet, Shaanxi, Gansu, Qinghai, Ningxia, and Xinjiang.
Results
Livestock Carbon Emissions in China
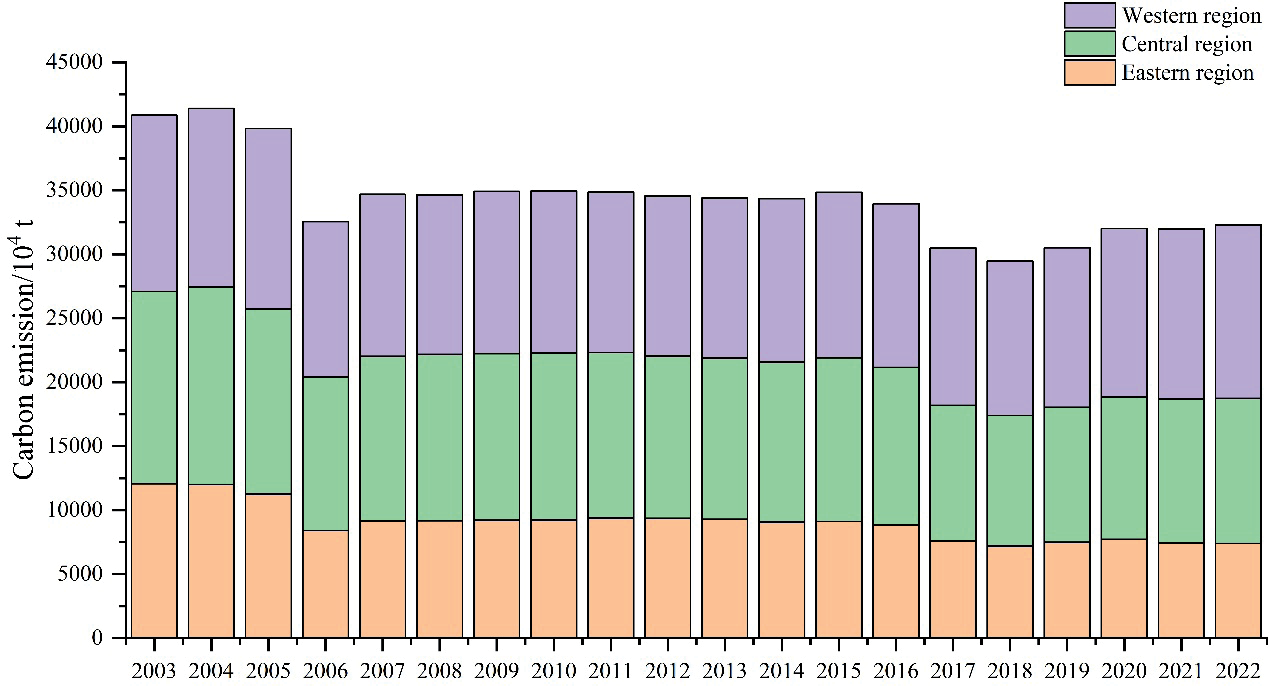
From 2003 to 2022, China’s total livestock carbon emissions exhibited a fluctuating downward trend (Fig. 1). Nationally, carbon emissions peaked in 2004 at 4.14×10⁴ million tons and reached their lowest point in 2018 at 2.95×10⁴ million tons. By 2022, emissions rebounded to 3.23×10⁴ million tons, reflecting a 21.0% decrease compared to the 2004 peak.
At the regional level, the eastern region saw the most significant reduction, with emissions decreasing from 1.21×10⁴ million tons in 2003 to 7.40×10³ million tons in 2022, a decline of 38.7%. The central region also notably reduced emissions, falling from 1.50×10⁴ million tons in 2003 to 1.13×10⁴ million tons in 2022, marking a 24.4% decline. In contrast, emissions in the western region remained relatively stable, decreasing slightly from 1.38×10⁴ million tons in 2003 to 1.36×10⁴ million tons in 2022, a marginal reduction of 1.6%. These findings indicate that while national emission reduction efforts have been substantial, the western region’s emissions have remained relatively steady.
During the study period, the central region maintained the highest carbon emissions until 2007, after which emissions stabilized, and the gap with the western region gradually narrowed. By 2022, the central and western regions’ emissions were 1.13×10⁴ million tons and 1.36×10⁴ million tons, respectively, showing convergence. Throughout the study period, the eastern region consistently recorded the lowest emissions among the three regions. Regional differences in carbon emissions were most pronounced in 2004, with the central region emitting 1.54×10⁴ million tons, significantly higher than the eastern region’s 1.20×10⁴ million tons and the western region’s 1.40×10⁴ million tons. After 2006, regional disparity narrowed considerably, with a significant reduction in the eastern region’s emissions.
The spatial distribution of carbon emissions also underwent significant changes during the study period. In the early years, the central region dominated emissions, followed by the western region. However, as emissions in the eastern and central regions declined, the western region’s share of national emissions increased. By 2022, the western region accounted for 42.0% of total national emissions, up from 33.7% in 2003. Conversely, the eastern region’s share dropped from 29.5% in 2003 to 22.9% in 2022. These results highlight the significant differences in emission reduction progress across regions. While the eastern and central regions have achieved notable success, the western region continues to face considerable challenges in reducing emissions.
Decoupling Relationship between Livestock Carbon Emissions and Economic Development
From 2003 to 2022, the decoupling relationship between livestock carbon emissions and economic output in China exhibited significant spatial and temporal differences (Table 5). At the national level, the overall trend during the study period was characterized by a “strong decoupling” state, particularly during the periods of 2003-2007 and 2011-2015. This indicates that the growth rate of livestock carbon emissions was significantly lower than that of economic output. However, during 2007-2011 and 2019-2022, the national decoupling relationship shifted to “weak decoupling”, suggesting that the growth rates of emissions and economic output were largely synchronized, increasing the pressure on emissions reduction.
Most provinces demonstrated a “strong decoupling” trend at the regional level throughout the study period. For instance, provinces such as Henan, Shandong, and Fujian effectively controlled the growth of carbon emissions, which remained significantly lower than economic output growth during most periods. However, some regions showed instability in their decoupling status. For example, Beijing frequently exhibited “strong negative decoupling” or “weak negative decoupling”, indicating that in certain phases, the growth rate of carbon emissions outpaced economic output, reflecting limited success in emissions reduction. Similar situations occurred in Shanghai and Qinghai, where “expansive negative decoupling” was observed during specific periods, suggesting rapid growth in carbon emissions.
In the western region, provinces such as Gansu, Ningxia, and Xinjiang predominantly displayed “weak decoupling” during the study period, indicating that the growth rates of emissions and economic output were roughly aligned, with limited effectiveness in emissions reduction. Additionally, regions such as Inner Mongolia and Qinghai exhibited a predominance of “weak decoupling”, reflecting slow progress in their low-carbon transition.
From a temporal perspective, the decoupling status of provinces changed significantly over time. During 2003-2007, the majority of regions exhibited “strong decoupling”, reflecting the effectiveness of early emissions reduction policies. However, during 2019- 2022, provinces such as Beijing and Shanghai again experienced “strong negative decoupling” or “weak negative decoupling”, indicating a decline in the coordination between emissions and economic output. This highlights the need for targeted policy measures to optimize the decoupling status in the future.
Carbon Carrying Capacity of Livestock Carbon Emissions
From 2003 to 2022, China’s carbon carrying capacity for livestock emissions showed a fluctuating downward trend. Nationally, the carbon carrying capacity increased from 8.91×10³ million tons in 2003 to its peak of 1.17×10⁴ million tons in 2004. It then gradually declined, reaching a low of 7.96×10³ million tons in 2018. By 2022, the national carbon carrying capacity was 8.82×10³ million tons, marking a 24.6% reduction from the 2004 peak.
At the regional level, the eastern region exhibited a significant decline in carbon carrying capacity over the study period, dropping from 1.70×10³ million tons in 2003 to 1.22×10³ million tons in 2022, a total decrease of 28.2%. The central region’s carbon carrying capacity peaked at 5.35×10³ million tons in 2004 before declining to 4.55×10³ million tons in 2022, representing a 14.8% reduction. In contrast, the western region displayed a relatively stable carbon carrying capacity, decreasing slightly from 3.09×10³ million tons in 2003 to 3.04×10³ million tons in 2022, a marginal reduction of 1.6%.
From a temporal perspective, the rapid increase in carbon carrying capacity from 2003 to 2004 may be attributed to the rapid expansion of livestock production driven by economic growth. However, since 2005, the carbon carrying capacity in the eastern, central, and western regions has entered varying degrees of decline, indicating a reduction in economic output per unit of carbon emissions as livestock-related emissions grew. This downward trend began to stabilize after 2017, with some regions, such as the central region, experiencing a short-term rebound to 5.26×10³ million tons in 2020.
Table 5.
Decoupling relationship between livestock carbon emissions and economic development across provinces in China.
In terms of regional disparities, the central region’s carbon carrying capacity consistently remained higher than in the eastern and western regions, reflecting higher livestock production efficiency and greater economic conversion capacity of carbon emissions. The eastern region exhibited the lowest overall carbon carrying capacity, indicating significant emission reduction pressure, while the western region maintained a relatively stable carbon carrying capacity, demonstrating a steadier low-carbon development trajectory for its livestock industry (Table 6).
Table 6.
Carbon carrying capacity of livestock carbon emissions in China’s three regions.
Livestock Carbon Pressure Index
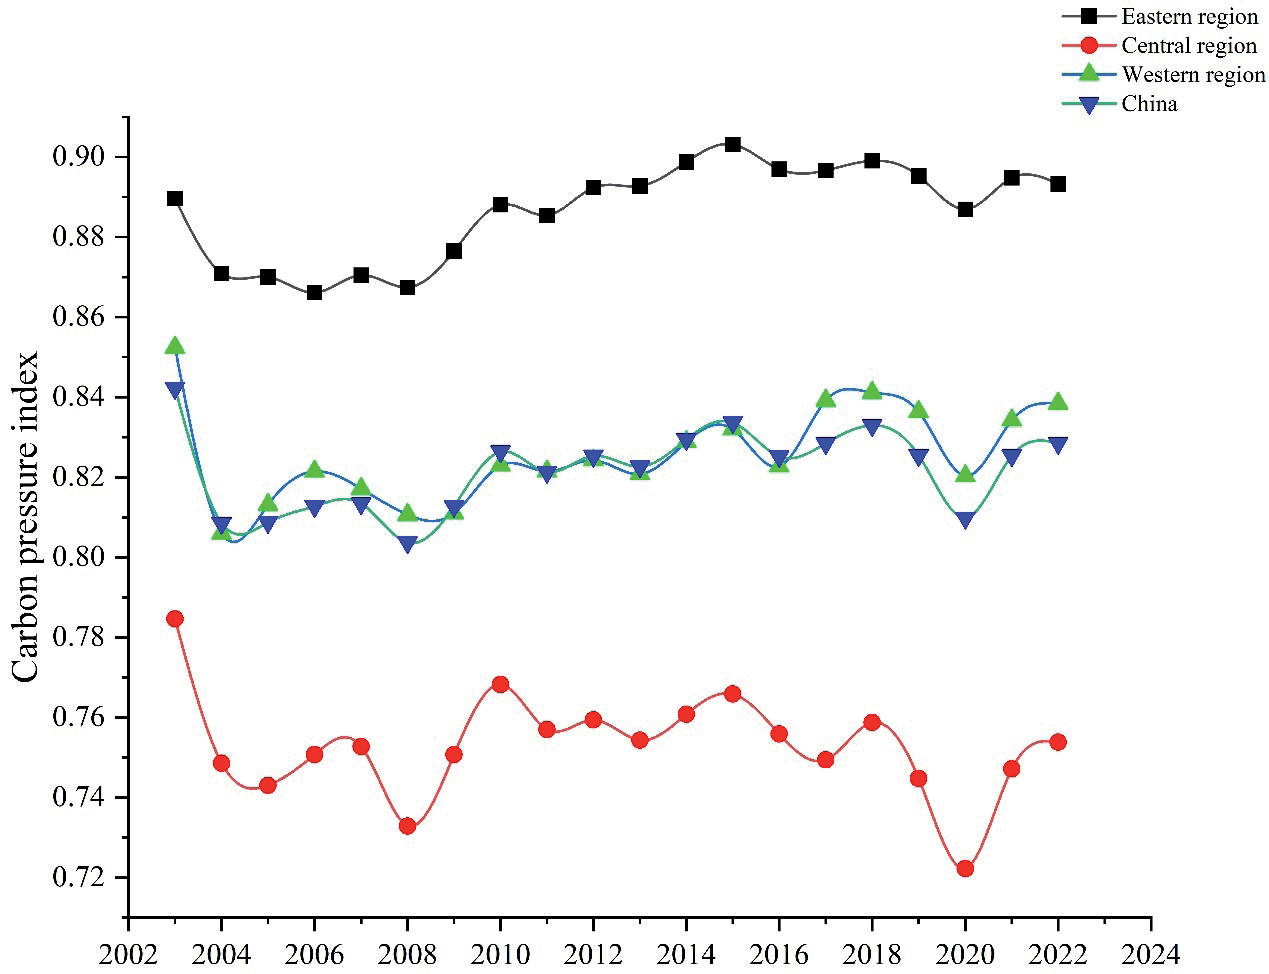
From 2003 to 2022, China’s Livestock Carbon Pressure Index (LCPI) remained at a consistently high level, with most national values exceeding 0.8 during the study period. This corresponds to “High Risk” (IV) or “Extreme Risk” (V) levels, indicating significant environmental pressure from livestock activities (Fig. 2).
From a temporal perspective, the national LCPI decreased gradually from 0.8422 in 2003 to a low of 0.8037 in 2008. It then rose steadily, peaking at 0.8337 in 2015. Following 2015, the LCPI exhibited minor fluctuations but stabilized within the high range of 0.82 to 0.83. The observed decline in LCPI correlates with implementing national emission reduction policies and structural optimization within the livestock industry. However, further efforts are required to reduce environmental risks effectively.
Regionally, the eastern region consistently exhibited the highest LCPI, exceeding 0.86 throughout the study period, categorizing it as “Extreme Risk” (V). This indicates that livestock activities in the economically developed eastern region impose significantly greater environmental pressure than other regions, necessitating focused attention and mitigation measures. In the central region, the LCPI remained relatively low, ranging between 0.74 and 0.76, corresponding to “High Risk” (IV) or “Moderate Risk” (III). The Western region displayed considerable variability, with an LCPI of 0.8524 (“Extreme Risk”) in 2003, decreasing to 0.8384 (“High Risk”) in 2022, but overall maintaining significant pressure levels.
From a temporal evolution perspective, the LCPI in the eastern region peaked at 0.8988 in 2014 and subsequently declined slightly, maintaining a consistently high level. In the central region, the LCPI reached a local high of 0.7658 in 2015 before declining. In the western region, the LCPI peaked at 0.8392 in 2017 and then decreased slightly in subsequent years.
Overall, both the national LCPI and regional LCPI values demonstrate that livestock carbon emissions pose significant and persistent threats to the ecological environment. The eastern region, in particular, as the area with the highest environmental risk, not only faces severe ecological challenges locally but also poses obstacles to achieving nationwide low-carbon development goals.
Regional Disparities in the Carbon Pressure Index
From 2003 to 2022, the overall Theil index for China’s carbon pressure index exhibited a fluctuating trend. The total Theil index increased from 0.0118 in 2003 to a peak of 0.0238 in 2020, followed by a slight decline to 0.0191 in 2022. This indicates that the regional disparity in the distribution of the carbon pressure index across the nation was relatively low in the early study period, reached its highest point in 2020, and then began to moderate. The Theil index is particularly useful in decomposing total disparities into intra-regional and inter-regional disparities, allowing us to identify which regions contribute the most to national carbon pressure imbalances.
In terms of intra-regional disparities, the changes in the regional Theil index were significant throughout the study period. The central region consistently exhibited the highest intra-regional Theil index, starting at 0.0083 in 2003 and peaking at 0.0255 in 2020. This suggests that carbon pressure within the central region is highly unevenly distributed, making it one of the primary contributors to national inequality. Several factors contribute to this persistent disparity. First, the central region’s economic and industrial structures vary significantly across provinces, with some areas heavily reliant on energy-intensive industries while others have adopted more sustainable economic models. Second, differences in local policy enforcement and technological adoption have led to stark contrasts in the effectiveness of carbon reduction. Third, agricultural activities in the central region, particularly large-scale livestock farming, contribute to high carbon emissions in some provinces while others have shifted towards more sustainable agricultural practices.
A deeper analysis reveals that provinces such as Henan, Hubei, and Anhui have seen rapid industrialization and urban expansion, often without simultaneous advancements in low-carbon technologies, leading to a sharp increase in emissions and disparities. In contrast, certain areas within the region have benefited from renewable energy initiatives, leading to lower carbon pressure. The uneven distribution of industrial transformation efforts is a key factor behind the region’s consistently high Theil index.
In contrast, the eastern region showed relatively low intra-regional disparities, with its Theil index remaining between 0.0027 and 0.0054, indicating a more balanced distribution of the carbon pressure index within the region. Similarly, the western region’s intra-regional Theil index was low, ranging from 0.0028 to 0.0069, reflecting relatively minor internal disparities. This suggests that better coordination of emission reduction policies and stronger regional integration have contributed to a more even distribution of carbon pressure in the eastern region. Meanwhile, the western region, despite its overall lower level of carbon emissions, has seen a more homogeneous industrial and energy consumption structure, reducing internal variations.
Regarding inter-regional disparities, the Theil index showed smaller fluctuations compared to intra-regional disparities. It increased from 0.0072 in 2003 to 0.0131 in 2020 before declining to 0.0103 in 2022. The trend suggests that the imbalance in the carbon pressure index between regions increased during the study period but began to ease in the later years. This can be attributed to the increased adoption of national carbon reduction policies, which have reduced the gap between more developed and less developed regions in recent years. However, differences in policy implementation speed, technological access, and economic restructuring efforts continue to cause regional discrepancies.
From a temporal perspective, 2008 and 2020 were notable turning points. In 2008, both intra-regional and inter-regional disparities in the Theil index increased, reflecting an exacerbation of regional imbalances during the implementation of emission reduction policies. In 2020, the national Theil index reached its peak, indicating heightened regional imbalances both within and between regions, possibly due to uneven efforts in restructuring regional carbon emission patterns. The peak in 2020 can be linked to the sharp economic rebound following the COVID-19 pandemic, when certain provinces, particularly in the central and western regions, ramped up high-emission industrial activities to compensate for earlier economic slowdowns. Meanwhile, some eastern provinces maintained steady progress in emissions reduction, further widening the gap.
Overall, the distribution imbalance of the national carbon pressure index is influenced by both significant intra-regional disparities and fluctuations in inter-regional disparities (Table 7). The central region, in particular, stands out as a major contributor to intra-regional disparities due to its economic and industrial heterogeneity, uneven adoption of low-carbon technologies, and differences in policy enforcement across provinces. Effectively implementing emission reduction policies within the central region is crucial for achieving a more balanced national carbon pressure index development. Future policies should focus on enhancing regional coordination, promoting uniform enforcement of carbon reduction regulations, and investing in green industrial transformation to reduce intra-regional inequalities in carbon emissions.
Global Spatial Autocorrelation Analysis
From 2003 to 2022, the Moran’s Index for the livestock carbon pressure index remained relatively low, indicating weak spatial autocorrelation across the nation. This suggests no significant spatial clustering in the regional distribution of carbon pressure. During the study period, the Moran’s Index ranged from 0.0234 (2003) to 0.0903 (2007), with values close to zero, reflecting a tendency toward random spatial distribution (Table 8).
Table 7.
Regional disparities in China’s livestock carbon pressure index.
In 2003, the Moran’s Index was 0.0234, with a Z-value of 0.7269 and a P-value of 0.4672, indicating no significant spatial autocorrelation. By 2007, the Moran’s Index rose to 0.0903, the highest value during the study period, with a Z-value of 1.5829 and a P-value of 0.1134, approaching significance. This may suggest a slight spatial clustering of carbon pressure in some regions, though the overall level remained weak. Subsequently, the Moran’s Index declined, reaching 0.0740 in 2011 and 0.0587 in 2015, with corresponding Z-values of 1.4059 and 1.2573 and P-values above 0.1, indicating that spatial autocorrelation was still not significant. In 2019 and 2022, the Moran’s Index values were 0.0549 and 0.0646, respectively, with Z-values of 1.1996 and 1.3215 and P-values of 0.2303 and 0.1863, further confirming the lack of significant spatial clustering in the distribution of the carbon pressure index.
From a spatial statistics perspective, the expected value of the Moran’s Index under random distribution is -0.03333, supporting the conclusion that China’s livestock carbon pressure index does not exhibit strong spatial dependence or heterogeneity. While relatively higher Moran’s Index values were observed in 2007 and 2022, they did not reach significant levels.
In summary, the spatial distribution of China’s livestock carbon pressure index during the study period was predominantly random, without significant spatial autocorrelation. This may be related to variations in livestock development levels, resource endowments, and the differentiated implementation of carbon reduction policies across regions. Future studies should further explore the potential driving mechanisms underlying these spatial patterns by integrating regional characteristics and policy impacts.
Local Spatial Autocorrelation Analysis
From 2003 to 2022, the local spatial autocorrelation analysis of China’s livestock carbon pressure index revealed distinct spatial clustering and dispersion patterns across different regions. These patterns primarily manifested as “High-High Clusters” (high-value clustering regions), “High-Low Outliers” (high-value regions adjacent to low-value regions), “Low-High Outliers” (low-value regions adjacent to high-value regions), and “Low-Low Clusters” (low-value clustering regions) (table 9).
The High-High clusters were predominantly concentrated in Hebei Province and its surrounding areas. In 2003, Hebei was the sole high-value cluster. By 2007, Inner Mongolia joined Hebei to form a high-value clustering area. After 2011, Liaoning Province became part of the high-value cluster, further expanding the clustered region. By 2019 and 2022, Jilin Province had also joined, indicating that the North China and Northeast China regions exhibited high livestock carbon pressure indices with significant positive spatial correlations.
High-Low outliers mainly occurred in regions such as Guizhou and Fujian. In 2003 and 2007, Guizhou represented a high-value region adjacent to low-value regions. In 2011, Fujian also exhibited similar dispersion characteristics. These distributions reflect localized imbalances in livestock carbon pressure within certain areas.
Low-High outliers were relatively rare and only observed in Heilongjiang Province in 2022. This indicates that the carbon pressure index in Heilongjiang was relatively low despite being surrounded by regions with higher carbon pressure. This could be attributed to the specific characteristics of livestock development in Heilongjiang and its regional resource advantages.
Low-Low clusters were consistently concentrated in Hubei Province, forming a stable low-value clustering area after 2011. This indicates that Hubei’s carbon pressure index was relatively low, with surrounding regions also exhibiting lower carbon pressure levels. This may be related to the livestock development model in Hubei and the region’s ecological environment management measures.
In conclusion, the local spatial autocorrelation analysis highlights significant spatial clustering and dispersion characteristics of the livestock carbon pressure index in localized regions of China. Notable examples include the high-value clusters in Hebei, Inner Mongolia, Liaoning, and Jilin, as well as the low-value cluster in Hubei. These findings suggest the need to closely monitor the carbon emissions dynamics in these regions and to formulate targeted and differentiated emission reduction policies to mitigate regional imbalances.
Table 8.
Global spatial autocorrelation analysis of China’s livestock carbon pressure index.
Table 9.
Local spatial autocorrelation analysis of China’s livestock carbon pressure index.
Discussion
From 2003 to 2022, China’s livestock carbon emissions demonstrated an overall declining trend, but this surface-level observation conceals significant regional and intra-regional disparities. The eastern region achieved the most notable reductions, reflecting its stronger policy enforcement capabilities and effective application of technologies in the context of advanced economic development [32]. However, the central and western regions, particularly the west, experienced much slower reductions. This disparity not only highlights regional differences in economic development levels but also reveals the shortcomings in technology diffusion and policy support in the West. Several key factors contribute to this slower reduction in emissions, including the more traditional, resource-intensive agricultural practices in these regions, limited access to low-carbon technologies, and weaker policy enforcement compared to the eastern region. In contrast, the eastern region has successfully implemented a range of low-carbon policies that have significantly contributed to emission reductions. These policies offer valuable lessons for the central and western regions, where similar strategies could be tailored to local economic and environmental conditions. These imbalances serve as a warning that current policy designs and technology dissemination efforts are not sufficiently tailored to the actual needs of the central and western regions. Moreover, this disparity in reduction rates highlights the limitations of the decoupling analysis approach, as it primarily captures the macro-level relationship between carbon emissions and economic growth but fails to fully account for the underlying regional factors that drive these differences. Future efforts must shift more policy support and resource allocation toward these regions to accelerate their low-carbon transition.
The dynamic changes in decoupling relationships further reveal the complex interactions between livestock carbon emissions and economic development. While the overall “strong decoupling” at the national level reflects the phased effectiveness of policies, certain regions, such as Beijing and Shanghai, exhibited “strong negative decoupling” or “weak negative decoupling”, underscoring the persistence of high-carbon pathways. These emissions are largely driven by a reliance on traditional energy-intensive production models [33], which in turn reflect delays in industrial restructuring [34] and insufficient intensity of low-carbon transition policies [35]. Despite their advanced economic structures, the strong negative decoupling observed in regions like Beijing and Shanghai can be attributed to several interrelated factors. While both cities have shifted towards more service-oriented economies, they still retain significant carbon-intensive industries, particularly in the construction, transportation, and heavy manufacturing sectors. For example, construction and real estate development in these cities contribute heavily to emissions through energy consumption and material production, such as steel and cement, which are carbon-intensive. As these industries grow alongside urban expansion, emissions remain high despite economic restructuring. Additionally, the energy mix in these regions still relies on fossil fuels, particularly coal and natural gas, to meet the demands of both industry and urbanization. While the service sector increasingly contributes to GDP, it is supported by an energy system that has not yet fully transitioned to renewables. Rapid urbanization and growing demand for energy in buildings, transportation, and infrastructure will lead to continued reliance on energy-intensive processes, further contributing to high carbon emissions. Furthermore, despite the economic strength of these regions, the implementation of low-carbon policies has been slower than in other regions due to the complexity and costs associated with transitioning urban infrastructure and industries to low-carbon technologies. Although Beijing and Shanghai have made strides in promoting green technologies and renewable energy, the pace of policy implementation has not been sufficient to outpace the emissions generated by their high-carbon industrial sectors. The expansion of high-carbon infrastructure continues to occur at a pace that outstrips the impact of policies aimed at reducing emissions, resulting in a “strong negative decoupling”, where carbon emissions grow faster than economic output. Another contributing factor is the economic growth model employed in these regions, which may prioritize short-term economic gains over long-term environmental sustainability. For instance, the rapid expansion of the real estate sector in Beijing and Shanghai contributes significantly to emissions, as the construction of new infrastructure often lacks the necessary environmental safeguards or energy efficiency standards that could mitigate these emissions. As a result, despite the region’s overall economic strength, their emissions are not decoupling from economic growth as effectively as in other areas of the country. Thus, the strong negative decoupling in Beijing and Shanghai suggests a persistent reliance on high-carbon industrial activities and energy-intensive growth models despite their advanced economic structures and policy initiatives. To address this issue, these regions must intensify their transition to cleaner energy sources and promote more sustainable industries, particularly in sectors like construction and transportation. Achieving this will require more aggressive and comprehensive low-carbon policies, alongside significant investments in green technologies, to create a balance between economic growth and carbon reduction while aligning infrastructure development with long-term sustainability goals [36-38].
The declining trend in carbon carrying capacity illustrates the resource efficiency challenges inherent in China’s livestock development model. The rapid decline in the eastern region’s carbon carrying capacity is closely linked to its highly intensive livestock practices [39, 40]. While these practices improve economic efficiency, they also significantly burden ecosystems. In contrast, the relatively stable carbon carrying capacity in the central and western regions suggests that opportunities to enhance emissions reductions and resource efficiency remain largely untapped. This indicates the potential for improving the carbon carrying capacity in these regions through better resource management and adopting more efficient livestock practices. One of the key policy successes in the eastern region has been the establishment of robust green finance mechanisms. For example, Shanghai and Jiangsu have introduced green bonds and investment funds that channel capital into low-carbon agricultural and industrial projects. Expanding such financial incentives to the central and western regions could encourage more sustainable livestock practices, particularly by supporting technological upgrades and infrastructure improvements. Improving carbon carrying capacity requires not only policy-driven technological innovation but also region-specific optimization strategies tailored to local resource endowments and economic characteristics [41, 42]. One limitation of this estimation method is that it assumes a static carbon sequestration capacity for different types of ecosystems, whereas, in reality, the carbon carrying capacity can fluctuate due to changes in land use, climate conditions, and other external factors. For instance, the central region could focus on utilizing livestock waste as a resource, while the western region should prioritize water-efficient technologies to address regional resource bottlenecks [43].
The persistently high-risk or extremely high-risk carbon pressure index, particularly in the eastern region, reflects a profound contradiction between regional economic development and ecological carrying capacity. This issue stems from the short-term orientation of policy objectives and an overemphasis on economic benefits. Despite the eastern region’s advantages in emissions reduction technologies and economic strength, its high carbon emissions remain a continuous threat to ecosystems. While the carbon pressure index is relatively low in the central and western regions, growing internal disparities highlight uneven economic development and policy implementation capacities. A notable policy success in the eastern region has been adopting a carbon trading system, which has incentivized industries to reduce emissions by putting a price on carbon. For example, Shanghai’s pilot carbon trading market has proven effective in encouraging enterprises to adopt cleaner technologies. While the central and western regions have yet to fully implement such mechanisms, gradual integration into a national or regional carbon market could be an effective strategy to manage livestock-related emissions more efficiently. In particular, the central and western regions still rely on traditional, less efficient livestock systems that contribute to relatively higher carbon emissions per output unit. However, the carbon pressure index method does not account for temporal variations in ecosystem dynamics or shifts in policy effectiveness over time, which may lead to inaccurate assessments of carbon pressure levels. A future focus on creating a dynamic balance mechanism between carbon emissions and ecological protection is essential to ensure sustainability in both economic development and environmental carrying capacity [44].
The carbon pressure index (LCPI) method differs from other environmental impact indices, such as carbon emission intensity or the ecological footprint, by offering a more integrated measure of environmental pressure. While carbon emission intensity assesses emissions relative to economic output and the ecological footprint measures the land area needed to absorb emissions, neither directly combines ecosystems’ carbon emissions and carbon sequestration capacity. The LCPI, however, uniquely incorporates both dimensions, providing a clearer picture of how carbon emissions from livestock compare to the region’s ability to absorb these emissions. Another lesson from the eastern region is the implementation of stringent industrial emissions regulations. Provinces like Zhejiang and Guangdong have imposed stricter environmental compliance requirements, which have forced companies to adopt low-carbon technologies and improve overall energy efficiency. In contrast, weaker enforcement mechanisms in the central and western regions have resulted in slower progress in emissions reduction. Strengthening regulatory oversight and offering financial assistance to businesses transitioning to low-carbon operations could help address these challenges in less developed areas. This makes the LCPI a particularly suitable measure for evaluating livestock emissions in relation to the broader ecological balance. Unlike traditional metrics, it allows for the identification of areas where carbon emissions from livestock are unsustainable in light of regional ecological capacities. While the Theil index highlights disparities in carbon emissions across regions, it does not address the ecological aspect of carbon sequestration, which is central to understanding true environmental sustainability.
The Theil index analysis further underscores the unequal distribution of carbon emissions between and within regions. The central region, in particular, significantly contributes to national disparities due to its pronounced intra-regional differences. These inequalities are rooted in insufficient policy enforcement and limited financial investments in certain areas, which lead to uneven dissemination of low-carbon technologies. Incorporating renewable energy subsidies into agricultural sectors has been another effective policy in the eastern region. Jiangsu and Fujian, for instance, have provided tax incentives and subsidies for biogas production, reducing methane emissions from livestock waste. Adapting similar policies to the central and western regions – where livestock production remains a dominant economic activity – could provide economic and environmental benefits. Given the high solar radiation levels in many western provinces, solar-powered irrigation and energy systems for livestock farms could be another area of focus for policy adaptation. The Theil index is useful in highlighting disparities but has limitations in capturing the specific policy interventions or technological gaps that contribute to these differences. While inter-regional disparities remained relatively stable overall, certain years, such as 2020, saw significant increases, reflecting weaker emissions reduction efforts in some regions. Strengthening inter-regional collaboration is crucial, such as encouraging the eastern region to transfer low-carbon technologies and expertise to the central and western regions, coupled with financial transfer payment mechanisms to support their green transitions [45].
Spatial autocorrelation analysis revealed the spatial distribution characteristics of the carbon pressure index. High-value clusters were concentrated in Hebei, Inner Mongolia, Liaoning, and Jilin, where high carbon pressure reflects the persistence of resource-intensive economic models and inadequate policy enforcement and technology promotion [46]. These high-value clusters identify areas with high carbon emissions and provide valuable insights for targeted policy interventions. Recognizing these clusters allows policymakers to focus efforts on regions with the most severe emissions, where intervention is needed the most. For example, in regions like Hebei and Inner Mongolia, which rely heavily on coal and energy-intensive industries, the focus should be on accelerating the transition to clean energy and promoting energy-efficient technologies. Identifying these high-carbon hotspots also helps prioritize investments in infrastructure and technology dissemination, ensuring that resources are allocated where they will have the greatest impact. Conversely, low-value clusters in regions like Hubei demonstrated effective low-carbon development but may overly rely on current low-carbon practices, such as insufficient promotion of advanced livestock technologies, potentially limiting their long-term growth. While these regions may not require the same level of urgent intervention as the high-value clusters, it is essential to continue supporting their ongoing low-carbon efforts. Policies here should focus on further improving technology adoption, enhancing the efficiency of existing systems, and avoiding the risk of stagnation in emission reduction efforts. For instance, fostering innovation in agriculture by promoting the adoption of precision farming and advanced feed technologies can help these regions enhance their sustainable development practices. For high-value regions, stronger policy regulation and stricter constraints on high-carbon activities are necessary, while low-value regions need to consolidate achievements and prevent emission rebounds due to changes in policies or economic models. In regions with high carbon pressure, such as Hebei and Inner Mongolia, policies should focus on curbing emissions through stringent regulatory measures, including carbon pricing, stricter emission standards for industries, and subsidies for clean energy adoption. In addition, technological innovation and infrastructure improvements are critical to reducing emissions from energy-intensive sectors. These high-value clusters also stand to benefit from targeted investment in low-carbon technologies, such as renewable energy, carbon capture, and advanced waste management systems.
Overall, China’s progress in low-carbon livestock development reflects both achievements and challenges. While the downward trend in emissions indicates the initial success of reduction policies, the significant regional and intra-regional disparities remain pressing issues. A major limitation in existing livestock carbon emission assessments is the reliance on generalized emission factors, which do not account for region-specific variations in climate, land use, and livestock management practices. Future research should focus on developing more refined, region-specific emission coefficients based on real-time data collection and advanced modeling techniques. For example, integrating high-resolution remote sensing data with on-site methane emissions monitoring can improve emission estimates’ accuracy. Additionally, machine learning models can help analyze historical trends and predict future emissions, allowing for more targeted mitigation strategies. These challenges stem not only from the shortcomings of “one-size-fits-all” policy designs but also from gaps in technology dissemination and financial support. By identifying high-value clusters through spatial autocorrelation, policymakers can tailor interventions to the specific needs of these regions, ensuring that emission reduction efforts are not only more efficient but also equitable. For instance, areas with high carbon pressure should be prioritized for technology transfer programs that introduce precision feeding systems, anaerobic digestion for manure management, and methane-reducing feed additives. Meanwhile, regions that have successfully reduced emissions should serve as models for best practices, facilitating knowledge exchange and capacity building across different provinces. As noted, the existing methods for analyzing regional disparities, such as the Theil index and carbon pressure index, have certain limitations in capturing dynamic changes over time, which need to be addressed in future research. To further enhance livestock carbon emission assessments, interdisciplinary research combining agricultural science, environmental engineering, and policy studies is needed. Expanding scenario-based modeling can provide insights into the long-term impacts of different emission reduction policies, helping decision-makers implement more adaptive and regionally tailored strategies. Moving forward, optimizing policy tools, enhancing inter-regional collaboration mechanisms, promoting regionally appropriate low-carbon technologies, and establishing dynamic monitoring and evaluation systems will be essential to achieving the coordinated advancement of environmental protection and economic development nationwide.
Conclusions
This study analyzed the temporal changes, regional disparities, decoupling relationships, carbon carrying capacity, carbon pressure index, Theil Index, and spatial autocorrelation characteristics of livestock carbon emissions in China from 2003 to 2022. The findings provide a comprehensive understanding of the current status and challenges in China’s low-carbon transition in the livestock sector.
The results indicate that national livestock carbon emissions have shown a declining trend, with the eastern region achieving the most significant reductions, reflecting the initial success of policies and technology promotion. However, the central and western regions lag in emission reductions, with the western region maintaining persistently high carbon emission levels, highlighting regional imbalances in economic development and carbon mitigation efforts. These regional disparities are further compounded by differences in technology dissemination, financial support, and policy enforcement, which have led to uneven progress in adopting low-carbon technologies.
The decoupling analysis revealed a predominant “strong decoupling” trend nationally, indicating that emissions grew more slowly than economic output. However, some regions, such as Beijing and Shanghai, experienced “strong negative decoupling” or “weak negative decoupling”, underscoring challenges in emission control and industrial restructuring. These negative decoupling trends reflect a continued reliance on energy-intensive industries and insufficient progress in transitioning to cleaner energy sources. The declining carbon carrying capacity further illustrates that improvements in livestock production efficiency have not been sufficient to offset the environmental impact of emissions, particularly in the eastern region, where carrying capacity has decreased significantly, necessitating more effective resource optimization measures. To address this, future strategies should focus on advancing resource-efficient technologies and sustainable land management practices.
The carbon pressure index showed that the environmental pressure from livestock emissions remains at high or extreme risk levels nationwide, with the eastern region bearing the most severe pressure. Meanwhile, the central and western regions face challenges related to uneven internal distribution. This suggests that while national policies have been effective in reducing emissions, targeted policies are required to address region-specific issues, particularly in the central and western regions, where industrialization and agricultural practices contribute to higher emissions.
The Theil index and spatial autocorrelation analyses revealed regional and intra-regional imbalances in the distribution of the carbon pressure index. The central region’s internal disparities were a major contributor to the national imbalance, while high-value clusters in Hebei, Inner Mongolia, and Liaoning reflected the amplifying effect of resource-intensive economic models on regional environmental pressure. Conversely, low-value clusters in regions like Hubei demonstrated the potential for replicating low-carbon development models, though their sustainability requires reinforcing existing advantages to prevent emissions rebound. Identifying high-value clusters through spatial autocorrelation offers valuable insights for targeted policy interventions, allowing policymakers to prioritize high-emission regions for stricter regulations, technology adoption, and financial support.
In summary, while China has made significant progress in the low-carbon development of its livestock sector, regional and intra-regional disparities remain major obstacles to achieving carbon neutrality goals. To overcome these challenges, future efforts should focus on enhancing regional collaboration, formulating region-specific policies, and promoting the dissemination of low-carbon technologies across the country. Industrial optimization should be prioritized, including promoting precision feeding, waste management innovations, and cleaner production processes. Additionally, ecological compensation mechanisms can help balance the economic development needs of high-emission regions with environmental sustainability. Establishing a dynamic monitoring and evaluation system will provide scientific support for policy formulation and adjustments, ensuring the coordinated advancement of ecological protection and economic development nationwide. Future research should also focus on improving the accuracy of carbon emission assessments through advanced data collection, regional modeling, and machine learning applications to better inform policy decisions.

