

Introduction
Over recent decades, with the rapid advancement of mining, smelting, and manufacturing industries and the overuse of insecticides and chemical fertilizers, agricultural soil’s heavy metals (HMs) contamination has increasingly garnered attention in academic research [1-4]. Soil HM pollution was characterized by strong migration, long-term persistence, toxicity, and bioaccumulation [5-7]. However, HMs in the soil can infiltrate the human body through three distinct contaminant exposure routes: hand-oral ingestion, skin contact, and respiratory inhalation [8-9]. Long-term exposure to HMs could contribute to various and serious harmful effects, including lung cancer, bone fractures, bladder cancer, kidney dysfunction, kidney cancer, skin cancer, prostatic proliferative lesions, and central nervous system symptoms [10-12].
However, the sources of HMs in farmland are very complex, and the potential sources of HMs in farmland include industrial waste, irrigation with polluted water, chemical fertilizer, pesticides, traffic exhaust, and atmospheric deposition [9,13-15]. In addition, the soil HMs could migrate from the upper soil layers to the deeper layers and then be absorbed by the crops [16]. All of this makes the HMs in soil show strong variability in both horizontal and vertical directions and poses a great challenge to accurately appointing potential sources of HMs in farmland soil.
Previous studies have reported great effort to analyze and assess soil HMs pollution in farmland [17-20]. For instance, Hu et al. [21] analyzed the pollution levels, ecological risks, and human health risks caused by soil HM exposure in different provinces across China based on data from 1203 research papers. She et al. [22] conducted a meta-analysis to investigate the current conditions and temporal pollution trends of potentially hazardous elements in agricultural soils within the Yangtze River Delta Region of China. Zhao et al. [23] analyzed the spatio-temporal characteristics associated with the risk of soil Cd contamination and its influencing factors in Eastern China, utilizing a regression analysis with geospatial and temporal weightings. Jia et al. [24] analyzed the ecological risk, geochemical accumulation, non-carcinogenic risk, and carcinogenic risk due to HM accumulation in China, utilizing the spatial multi-criteria decision-making theory framework. Shi et al. [25] assessed the spatiotemporal distribution of different soil HM concentrations across China from 1977 to 2020 while also assessing the associated ecological and human health risks on a national scale. Xia et al. [26] evaluate pollution risks of HMs in agricultural soils of Wenzhou, Southeast China, and apportioned related sources using positive matrix factorization (PMF). However, currently, most studies focus on the surface layer or cultivated layer of farmland, while studies exploring the HMs accumulation and pollution risk in deep soil layers of farmland are still lacking [26-30]. However, HMs in deep soil layers can also pose adverse effects on crop growth and threaten human health via different pathways, including the food chain and atmospheric deposition [31, 32]. Thus, it is essential to investigate the vertical distribution and migration characteristics of HMs in soil profiles, analyze the sources of soil HMs, and assess the ecological risk along with the human health risk caused by prolonged exposure to HMs.
Hunan Province is well known as the hometown of rice and fish in China. It serves as one of the primary production centers for rice and produced 30.68 million tons of rice in 2023. However, Hunan Province is rich in non-ferrous metal minerals and is also famous as the hometown of non-ferrous metal minerals in China. Long-term and extensive non-ferrous metal mining and smelting operations have led to considerable contamination of HMs in the farmland soil of Hunan Province and induced serious rice pollution caused by exceeded HMs accumulation [1, 10, 33, 34]. However, to the best of our knowledge, information on spatial and vertical distribution, sources of HMs, and related pollution and health risks in the soil profiles of farmland in Hunan Province is still scarce. Therefore, in this study, we survey the farmland soil profiles across Hunan Province. The specific aims include:
(1) analyzing the vertical distribution of HMs in soil profiles of farmland in Hunan Province; (2) appointing the sources of HMs in the surface soil layer via integration of PMF and correlation analysis; and (3) assessing the geo-accumulation status, potential ecological risks, and human health risks associated with prolonged exposure to HMs across various soil layers.
Materials and Methods
Study Area Description
Hunan Province is situated in the central region of the Yangtze River, Southern China (108°47'-114°15' E, 24°39'- 30°08' N), with a total land area of 211,800 km2 (Fig. 1). It has a typical continental mid-subtropical monsoonal humid climate, experiences annual precipitation of 1200-1700 mm, and has an average annual temperature of 16-18℃. Hunan Province has horseshoe-shaped terrain surrounded by mountains on the west, east, and south, and it opens towards the north. As of 2023, the total farmland area in Hunan Province was recorded at 3.62 million hm2. Hunan Province also serves as a primary region for rice production in China, with a rice yield of 30.68 million tons in 2023. However, the HMs pollution of rice in Hunan Province worldwide has caused widespread social concern in recent years [35].
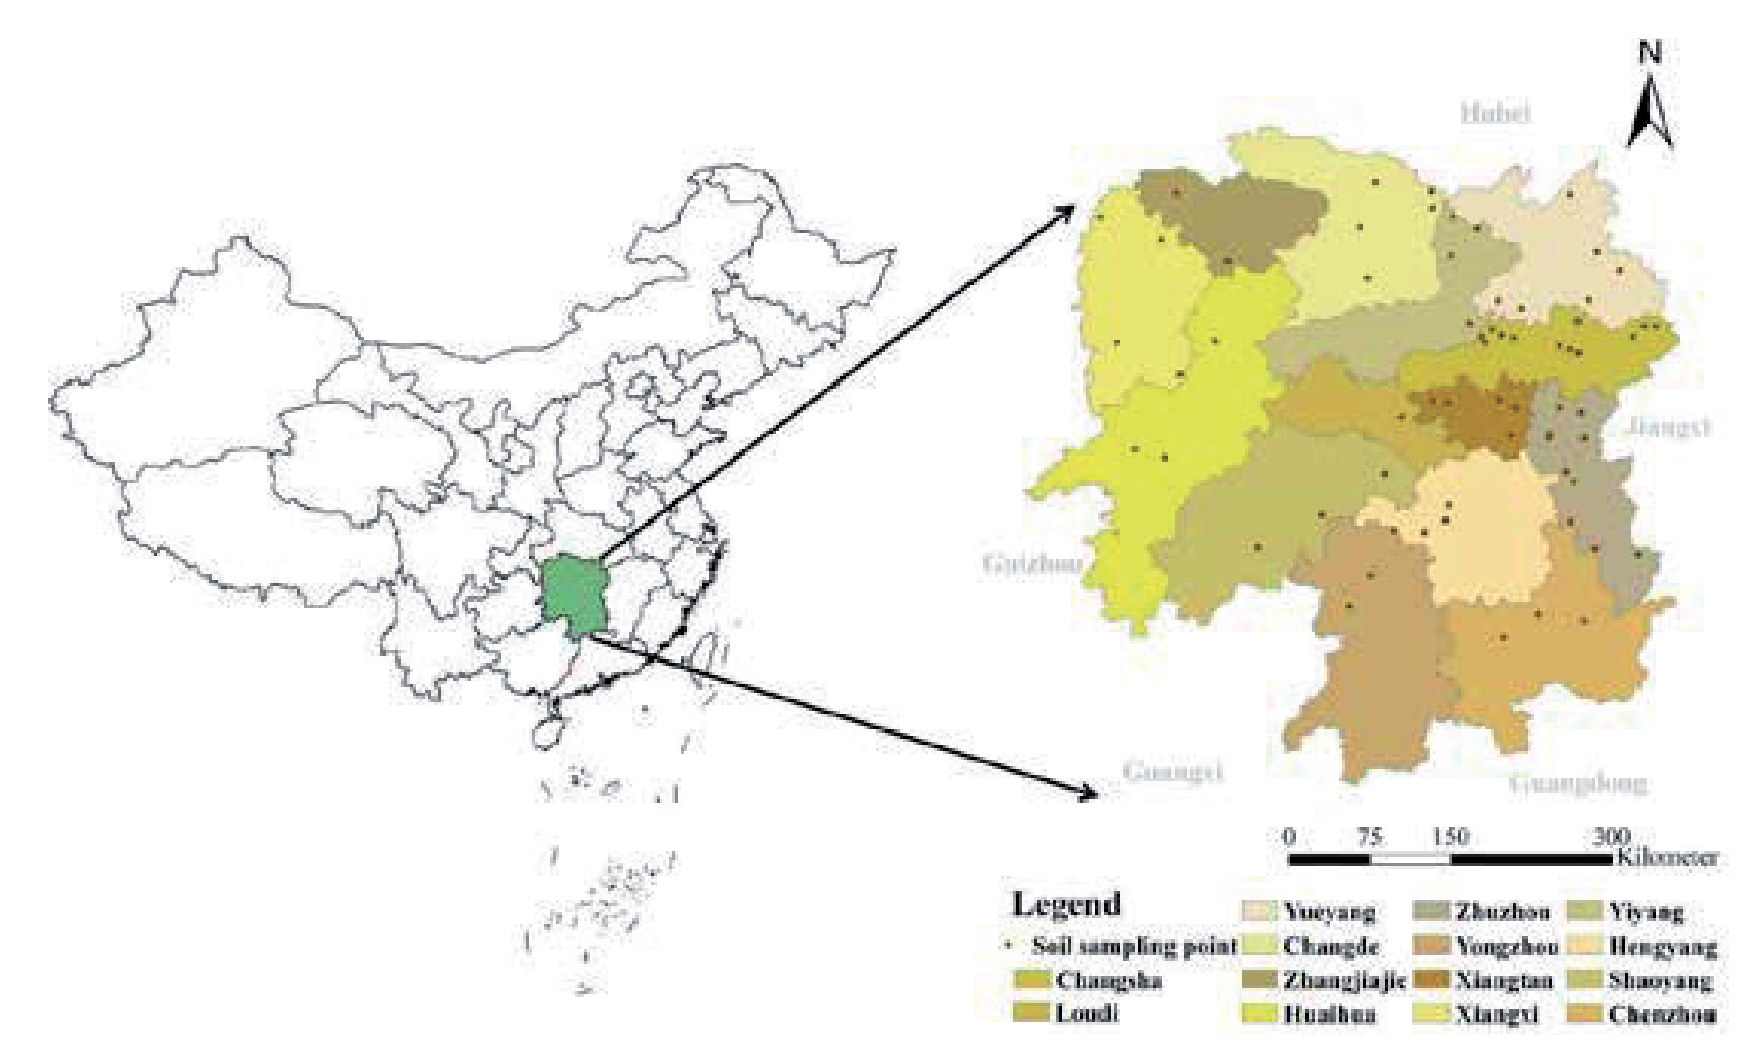
Sample Collection and Analysis
In this study, the typical areas with different parent materials were first determined based on the description and classification of soils in historical data [36]. Field visits were undertaken to identify the sampling locations for the various categories of typical parent material rice soils. Soil profiles (generally with a depth of 140 cm) were excavated during the winter idle period of double-season rice fields (Figs. 1-6). A total of 62 soil profiles were gathered for rice soils stemming from six common parent materials in Hunan: granite, plate shale, quaternary red clays, limestone, purple sandy shale, and fluvial-lacustrine deposit [37]. The study region was classified into five typical study areas according to the geographic space of Hunan Province: west Hunan, north Hunan, east Hunan, south Hunan, and central Hunan [37]. In each soil profile, soil samples were collected from three layers, including the tillage layer (marked as layer A) and the two layers below the surface (marked as layers B1 and B2, respectively).
The soil samples were then air-dried in a room with natural ventilation, removed from gravel and animal and plant residues, and processed using 10 mesh (2 mm) and 100 mesh (0.149 mm) sieves, respectively. Subsequently, the samples are preserved in plastic-sealed bags for measurement purposes. The contents of Cr, Cd, Hg, Pb, and As in the soil samples were extracted using HNO3-HF-HCl (the volume ratio was 1:2:3). Subsequently, these elements were quantified using an inductively coupled plasma mass spectrometer (ICP-MS, NexION 350X). Other soil physical and chemical properties (cation exchange capacity (CEC); soil organic carbon (SOC); altitude; available P (AP); bulk density (BD); exchangeable acidity (EA); sum of base cations (SBS); aluminum saturation (Alsat); and silica-alumina ratio (Sa)) were analyzed concerning the Laboratory Methods of Analysis for Soil Investigation [38]. In addition, the raster data of GDP with a spatial resolution of 1 kilometer was acquired from the WorldPop website (https://dx.doi.org/10.5258/SOTON/ WP00674). The annual temperature (MAT) and precipitation (MAP) were downloaded from the National Tibetan Plateau/ Third Pole Environment Data Center (https://data.tpdc.ac.cn/ home). The distance to water (DFW), the main road (DFR), and mining sites (DFM) were calculated using ArcGIS 10.3 software.
Methods
Source Appointment by PMF
The PMF model is a widely used method based on the factor analysis technique, which can both qualitatively identify the types of sources and quantitatively analyze the contribution of the sources of different soil HMs [39-41]. Within this research, the PMF model was performed using the PMF EPA 5.0 software for stratified sources of HMs in soil. It decomposes the original matrix xij into two-factor matrices gik and fkj and a residual matrix eij. The equations are shown below:
where xij is the concentration of the j-th HM in sample i; gik is the contribution of the k-th source in sample i; kkj is the eigenvalue of source k to the j-th HM concentration; eij is the random error, calculated from the minimum value of the objective function Q:
where uij refers to the uncertainty of the j-th HM in sample i. When the number of set factors is three and the peak running intensity (Fpeak) of the chosen rotation is -0.1, the objective function value is the smallest, indicating an improved model fit, and the overall results successfully pass the Bootstrap test.
SHAP: An Interpretable Machine Learning Algorithm
SHAP is an algorithm developed by Lundberg and Lee [42] that seeks to elucidate the predictions made by machine learning models by applying the Shapley values derived from game theory. This can be utilized to assess the incremental contributions of all features to the model's output, facilitating the interpretation of models at universal and particular scales. It can also quantify the contribution of predictor variables to the outputs of individual models, thereby allowing for the ranking of each predictor variable's contribution. Specifically, in our study, the effect of different anthropogenic and natural variables on soil HMs can be interpreted by combining the SHAP values in our study area. More detailed descriptions of the SHAP algorithm are provided by Zhu et al. [43].
Geoaccumulation Index and Potential Ecological Risk Index
The Geoaccumulation Index (Igeo), developed by Muller [44], is one of the most widely used methods to analyze the contamination of HMs in soil sediments [27, 45, 46]. This approach considers both the impact of Indigenous geological characteristics and anthropogenic activities, utilizing baseline values of soil HMs to quantitatively assess the degree of HMs enrichment in the farm soil.
The potential ecological risk index (RI) was widely employed to assess the potential ecological risk of HM pollution in farmland soil [10, 47, 48]. It incorporates the elements of potential ecological risk associated with each metal and correlates their ecological and environmental impacts with their toxicological properties [49]. The equation and classification of these indexes are shown in the study by Hu et al. [10].
Health Risk Assessment
The human health risk assessment model published by the United States Environmental Protection Agency (USEPA) was utilized to assess the human health risk due to long-term HM exposure [50-53]. As described above, HMs can primarily infiltrate the human body through three exposure routes: hand-oral ingestion, respiratory inhalation, and dermal contact, thus posing health risks to humans [50, 54, 55]. As regulated by the USEPA, health risks include carcinogenic and chronic non-carcinogenic risks. This paper focuses on five elements (Cr, Cd, Hg, Pb, and As) in soil with chronic non-carcinogenic health risks. The formula for the daily exposure dose of chronic non-carcinogenic HMs in soil for adults and children is as follows:
Where ADDing, ADDinh, and ADDderm represent the average daily dose of HM exposure (mg·kg-1·d-1) through hand-oral ingestion, inhalation, and dermal contact. The specific values of the parameters are presented in the supplementary materials.
The average daily exposure dose of carcinogenic HMs (LADDinh) is calculated as follows:
Here, the ATc means the carcinogenic exposure time (d) for HMs. The health risk index for non-carcinogenic HQ (hazard quotient) is calculated as:
The total non-carcinogenic risk index (HI) is calculated as follows:
Where RfD is the reference dose of the pollutant; when HQ≤1, it is posited that the non-carcinogenic health risk is small or negligible; when HQ>1, it means the existence of non-carcinogenic health risk.
The health risk index of carcinogenic HMs CR is calculated by the formula:
Where SF is the carcinogenic slope factor for HM. When the CR is within 1×10⁻⁶ to 1×10⁻⁴, it means exposure to HMs poses an insignificant carcinogenic risk to residents. Similar to previous studies, since the SF value for Hg is unavailable, Hg’s carcinogenic risk was not calculated [27, 56].
Results and Discussion
Soil HMs Content in Different Layers
Soil HMs Content Description
Descriptive statistics of heavy metal content in different soil layers are illustrated in Table 1. The average values of Cd, Hg, Pb, and Cr showed a decreasing trend with an increase in soil depth, while the mean value of As showed a contrary trend. The mean Cd, Hg, Pb, Cr, and As concentrations in layer A were 0.42, 0.20, 47.07, 61.11, and 12.58 mg kg-1, respectively. Additionally, the average content of Cd, Hg, Pb, Cr, and As in layers B1 and B2 is 0.30 and 0.24, 0.14 and 0.13, 37.99 and 36.50, 58.23 and 57.85, and 16.30 and 14.45 mg kg-1, correspondingly. This verifies the clear accumulation of HMs in surface soil for most of the HMs and also indicates the HMs in the farmland soil were majorly derived from anthropogenic activities for Cd, Hg, Pb, and Cr in the farmland soil of Hunan Province. The research results align with those reported by Rastmanesh et al. [57]. HMs in the soil are adsorbed and fixed by organic matter, clay minerals, and soil colloids, thus largely accumulating in the plow layer [58]. The downward migration of HMs is obstructed due to the compactness of the plow-pan. Therefore, the total and available HM content in the plow layer (A) will be higher than in the subsurface layer (B1 and B2).
Table 1.
Summary of statistical characteristics of soil HMs content (mg kg-1).
The coefficient of variation (CV) could reflect the variation in HM concentration [27]. In general, the content of Hg shows the largest CV value, followed by Cd, As, Pb, and Cr. This indicates that the soil Hg in the survey region shows high variability and may be sourced from anthropogenic activities. The CV of both Hg and As content tends to increase with soil depth. The maximum As content in soil was significantly higher than the critical value of the national environmental guideline in China (30 mg kg-1, GB 15618- 2018), which highlights the importance of preventing soil from As pollution. The CVs for Cr were less than 30%, revealing that the impact of natural factors was more pronounced and mainly originated from the soil parent material or geological background [59]. Previously, Chao et al. [60] and Zinn et al. [61] also reported that the composition of soil parent material substantially impacts Cr.
Vertical Distribution of HMs in Soil Derived from Different Parent Materials
Soil formation occurs through the weathering of parent material, followed by the pedogenesis process. Consequently, parent materials profoundly define soil properties, including HMs concentrations, and hence are important for HMs in soil [62, 63]. For instance, Sun et al. [64] found that bedrock parent material serves as the primary source of Pb via Pb isotope tracing technology. He et al. [65] proved that the soil parent material constitutes a significant source of HMs pollution in eastern China’s south Jiangxi Province.
Consistent with existing studies, in our study, great differences were detected for averaged HMs concentration in soil sourced from different parental materials in different soil layers (Fig. 2). For the Cd, the mean value of Cd in soil derived from limestone (LS) was higher than other parent materials in layers A and B1, and there existed a statistically significant distinction between the Cd content in LS and granite (GR) (P<0.05) (Fig. 2a)). The mean value of Cd in soil derived from fluvial-lacustrine deposit (FLD) and LS in the B2 layer was higher than other parent materials. In particular, the Cd content of paddy soil derived from FLD was high. This may be attributed to the elemental geological background and hydrological process. Southern Hunan has abundant non-ferrous metal mineral resources, while the Xiangjiang River flows from south to north through Hunan’s southern and eastern regions. A large number of HMs are released through mineral weathering or artificial mining and smelting, which then enter the paddy soil plow surface layer through continuous irrigation, thereby accumulating Cd [66]. Previous studies have proven this. For instance, Wang et al. [67] found that the content of Cd in the paddy soil near the Xiangjiang River Basin clearly exceeded the limit and that 68.5% of the points in the paddy soil had excess Cd. In addition, the clay content of paddy soil derived from limestone was the highest. Clay is a significant sorption component for Cd in soil, and paddy soil with high clay content can increase Cd adsorption, which leads to Cd accumulation in soil [68]. Liu et al. [69] reported that irrigation was the main input source of Cd to the farmland soil in their study area in Yunnan Province. Therefore, the total Cd concentration of paddy soil originating from LS was higher than that of other soils.
Fig. 2.
Cd (a), Hg (b), As (c), Pb (d), and Cr (e) contents in soil originated from various parent materials at different layers in the farmland of Hunan Province (box plot edges represent the 25th and 75th percentiles); The symbol □ represents the mean value; the symbol ♦ represents an outlier value; the center line represents the median value; and whiskers represent the range of data values. Different letters show significant differences (P<0.05).
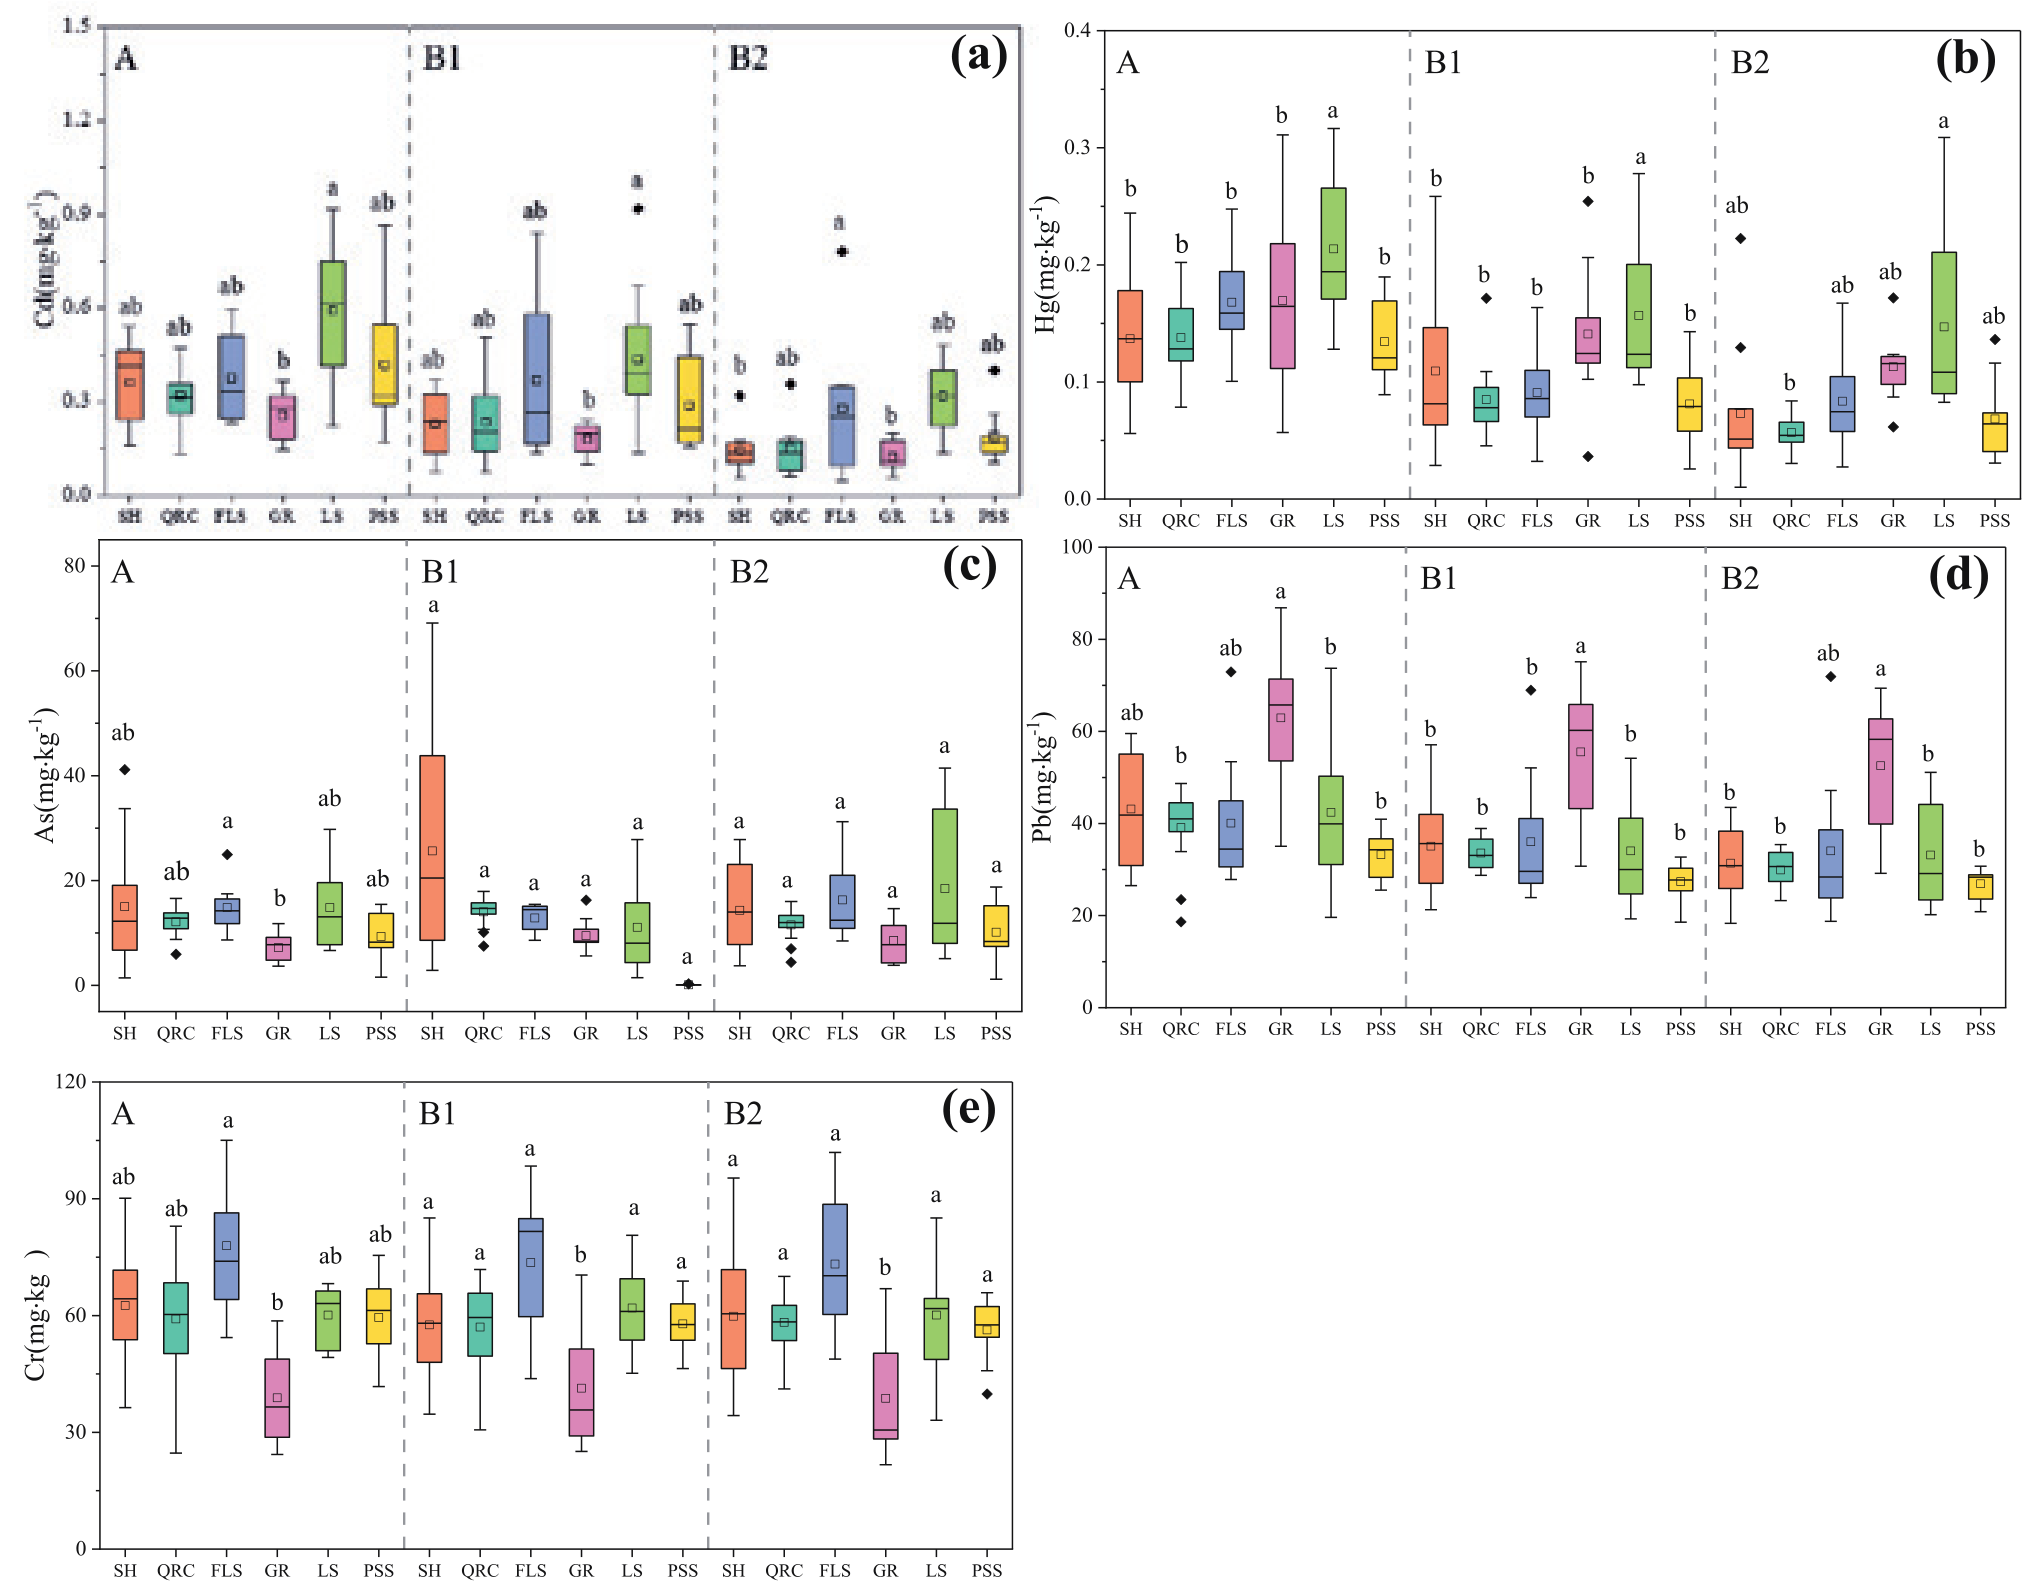
For Hg, the mean value of Hg in soil sourced from LS was significantly higher than other parent materials in layers A and B1 (Fig. 2b)). The mean value of Hg in soil derived from LS was higher than other parent materials in layer B2 and was significantly different from parent material quaternary red clays (QRC). The study organized by Hu et al. [70] showed that parent material significantly affects the content of Hg in soil. Chen et al. [71] reported an extremely significant positive correlation between Hg and soil cation exchange capacity (CEC). Ouyang et al. [72] illustrated that LS-developed soils’ CEC content was greater than those originating from other parent materials. All of these explain the high Hg content in LS-developed farmland soils.
In terms of As, the concentration in soils derived from the parent material FLD is higher than other parent materials in layer A and shows a significant difference with parent material GR (Fig. 2c)). The difference of As among different parent materials in layers B1 and B2 was not obvious. The As content in soil sourced from different parent materials was similar in different soil layers (Fig. 2c)). Our findings are congruent with the results reported by Karimi et al. [73], which found that the parent materials have slight effects on As content. In addition, Karimi et al. [73] reported that compost, irrigation, pesticide, and fertilizer applications could significantly affect As concentration. In addition, Chen et al. [74] concluded that As accumulates in soils primarily through the parent material’s weathering and soil formation processes.
For the Pb, the average Pb content in soil stemming from parent material GR is highest in layer A and shows significant differences with Pb content originating from QRC, LS, and purple sandy shale (PSS) (Fig. 2d)). The mean Pb content in soil sourced from GR was highest in layer B1 and significantly differed from other parent materials. Acosta et al. [75] reported that soil clay minerals had a strong adsorption capacity for Pb. The clay minerals kaolinite and illite content in GR-developed paddy soil is very high [76], which may contribute to the high Pb content in soil derived from GR.
With regard to Cr, the average content of Cr in layer A of farmland soil derived from FLD was the highest, which shows a significant difference with GR (Fig. 2e)). The averaged content of Cr in soil sourced from parent material GR was lowest in layers B1 and B2, which was significantly different from other parent materials. The FLD is formed by the alluvial precipitation of rivers and lakes [77], and a large amount of Cr is accumulated in the alluvial precipitation process, leading to a higher Cr content. Acosta et al. [75] also reported that the clay mineral montmorillonite could adsorb and fix more Cr elements. Moreover, FLD-developed paddy soil has more Illite/Smectite mixed layer minerals [78], which can adsorb and fix a large amount of Cr.
Source Appointment of Soil HMs
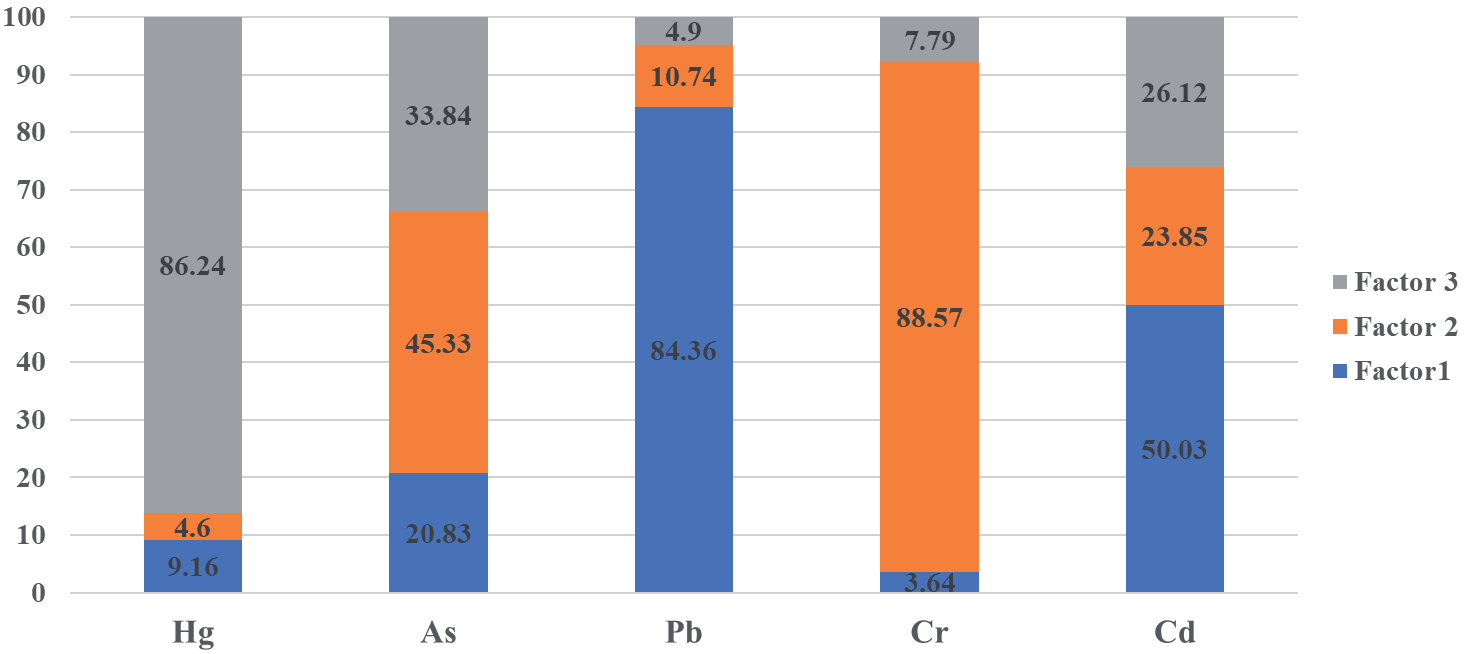
In this paper, the data validity values exceeding 95% (Conc.≥MDL) and signal-to-noise ratio (S/N) are all higher than 5 in our PMF model. Therefore, all species elements can be defined as “Strong”. A lower Q value can be obtained by setting the peak running intensity (Fpeak) to -0.1 and performing 20 factor iterations, and the residual values are mostly between -3 and 3. Therefore, the results we obtained are valid. As the number of factors was adjusted, the calculation results tended to stabilize, and three factors were ultimately determined. The sources of different HMs appointed by the PMF model are shown in Table 2 and Fig. 3. Factor 1 was primarily characterized by Pb and Cd with contributions of 84.36% and 50.03%, respectively. The Pb is generally derived from traffic activities due to the wear and tear of brake pads and the past use of leaded gasoline [79, 80]. The total mileage of roads in Hunan Province exceeds 210,000 km, and it has a huge traffic volume. In addition, as revealed by the National Economic and Social Development Statistical Bulletin of Hunan Province in 2022, the number of civilian vehicles in Hunan Province was 11.064 million in 2022. Among them, the number of private cars was 10.308 million, while the number of car owners was 6.10 million (http://hnzd.stats.gov.cn/dcsj/ sjfb/hns/zxfb/202303/t20230328_220938.html).
Extensive traffic activities emit large amounts of exhaust, leading to the accumulation of Pb in surface soil [56, 81]. Hunan Province is famous for its abundant non-ferrous metal deposits and machinery manufacturing industry. Its industry accounts for nearly 40% of GDP in 2022. As reported by numerous researchers, Cd usually comes from industrial activities [1, 82-84]. Thus, Factor 1 was considered industrial and traffic activities, which is in accordance with the outcomes reported by previous studies from Hu et al. [10] and Shi et al. [25].
Factor 2 exhibited elevated loading values for As and Cr (45.33% and 88.57%, respectively). Table 1 lists CV’s Cr as the smallest among the five HMs. This shows a weak spatial variability of Cr in Hunan Province, which is mainly controlled by natural factors. Additionally, the Cr concentration was lower than the background value [85], which means no clear accumulation caused by external sources. In terms of As, the average concentration (12.58 mg kg-1) in Layer A is lower than the corresponding background value (15.70 mg kg-1) [85]. In addition, the average concentration of As in Layer A is lower than those of B1 and B2. This indicates As in the soil of Hunan Province may primarily have weathered from parent materials. The parent material is paramount in deciding the initial status of various elements in soil [86, 87]. Thus, Factor 2 was considered a natural source.
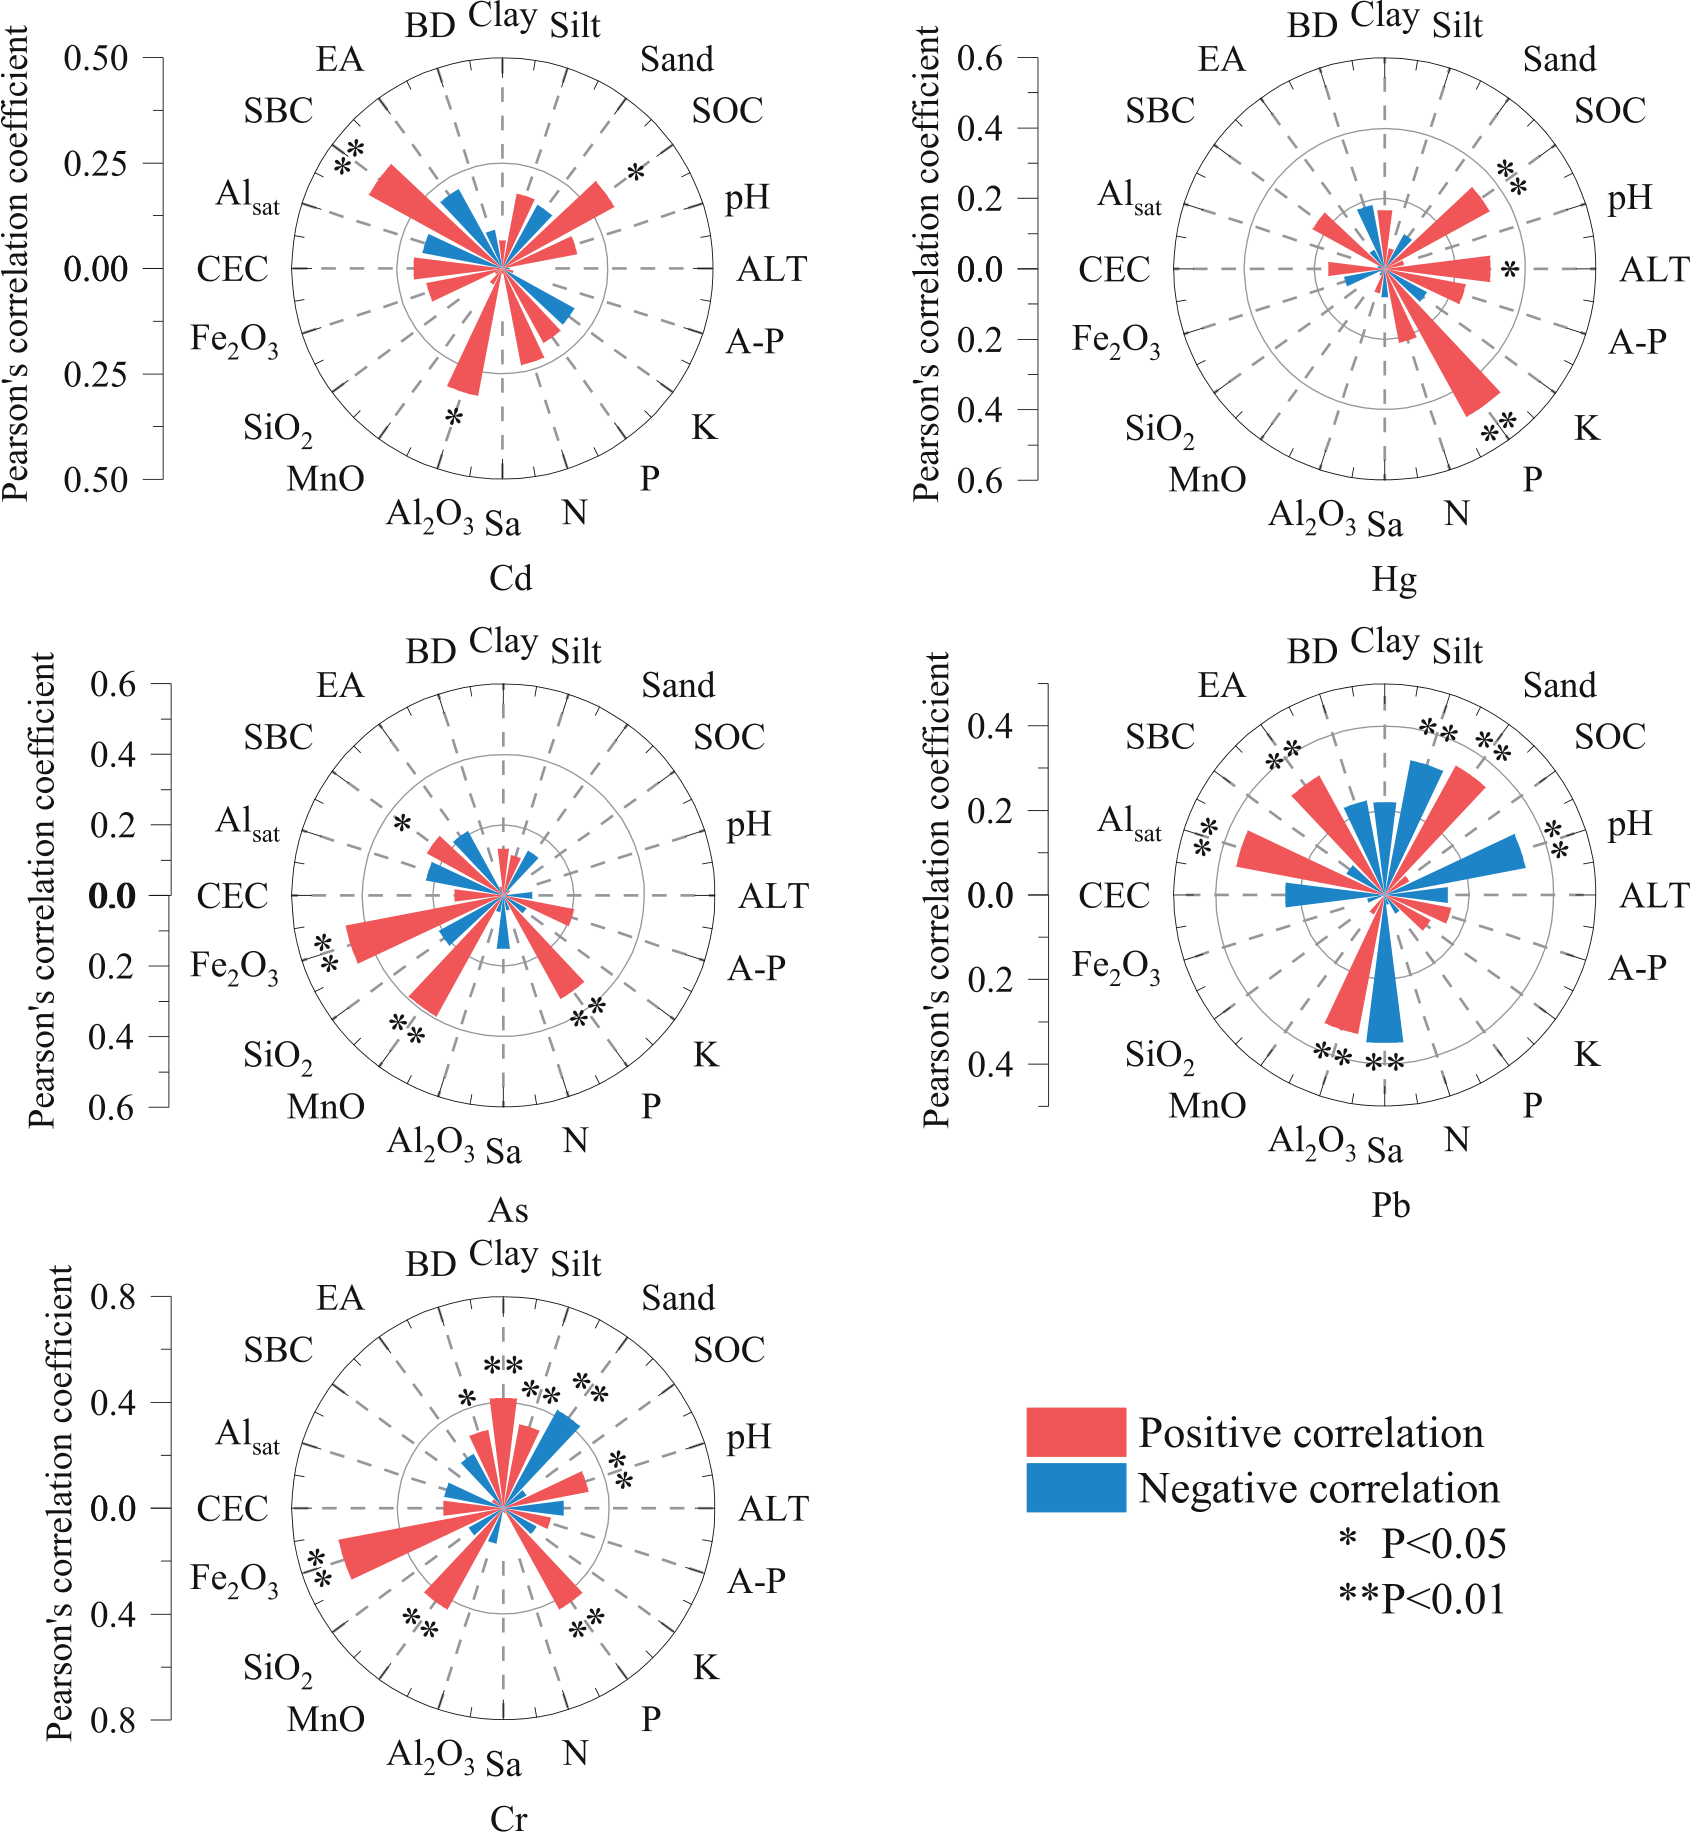
Fig. 4.
Correlativity of the Cd, Hg, As, Pb, and Cr with some physicochemical properties in the soil’s A layer (SOC: soil organic carbon; CEC: cation exchange capacity; ALT: altitude; A-P: available P; BD: bulk density; EA: exchangeable acidity; SBC: sum of base cations; Alsat: aluminum saturation; Sa: silica-alumina ratio; other elements are total content). The same is below.
Factor 3 was characterized by a high loading of Hg (86.24%). The high CV values of Hg concentrations in soil samples (Table 2, Fig. 3) indicate the complex source of Hg, which was a mixture of the natural environment and human-induced origins [88]. Previously, Hg is usually appointed as an isolated group when identifying the sources, using various methods, including cluster analysis, principal component analysis, and PMF [1, 89-91]. Prior research has found atmospheric deposition as a significant contributor to the concentration of Hg in soil [92-95]. Specifically, the sources of atmospheric deposition include traffic emissions associated with agricultural activities, activities related to building materials, the combustion of coal and oil, and construction dust [96, 97]. For example, Peng et al. [98] found that 40% of Hg accumulated in agricultural soils of China sources from coal burning. In 2020, the total energy consumption of Hunan was approximately 160 million tons of coal, among which coal carbon emissions accounted for 78% (http://www.hunan. gov.cn/hnszf/hnyw/zwdt/202110/t20211011_20742544.html). In addition, thermal power generation in Hunan accounted for around half of the total power generation in 2021, which releases a significant quantity of Hg due to fossil fuel combustion, particularly from coal. It would then accumulate in farmland soil through atmospheric deposition. Therefore, Factor 3 may represent anthropogenic sources, including atmospheric deposition.
Correlation Between Different Soil Physical and Chemical Properties and HMs Content
The correlation between HMs and various elements in soil samples across different soil layers was analyzed by using the Spearman correlation coefficient and presented in Figs. 4-6. Cd exhibited a significant positive correlation with the sum of base cations (SBC) in the whole soil profile (Figs. 4-6). In addition, Cd showed a significant positive correlation with SOC in layers A and B1. Furthermore, the abundant oxygen-containing functional groups in SOC, such as carboxyl, hydroxyl, and phenolic hydroxyl groups, provide a large number of sorption sites that can absorb Cd [99]. Moreover, Cd exhibited a significant positive correlation with P and A-P. Previous studies have shown that phosphate-free radicals on colloidal surfaces could adsorb Cd onto colloids (soil-phosphate-Cd compounds), thereby increasing Cd accumulation [100].
Fig. 5.
Correlativity of the Cd, Hg, As, Pb, and Cr with some physicochemical properties in the soil’s B1 layer.
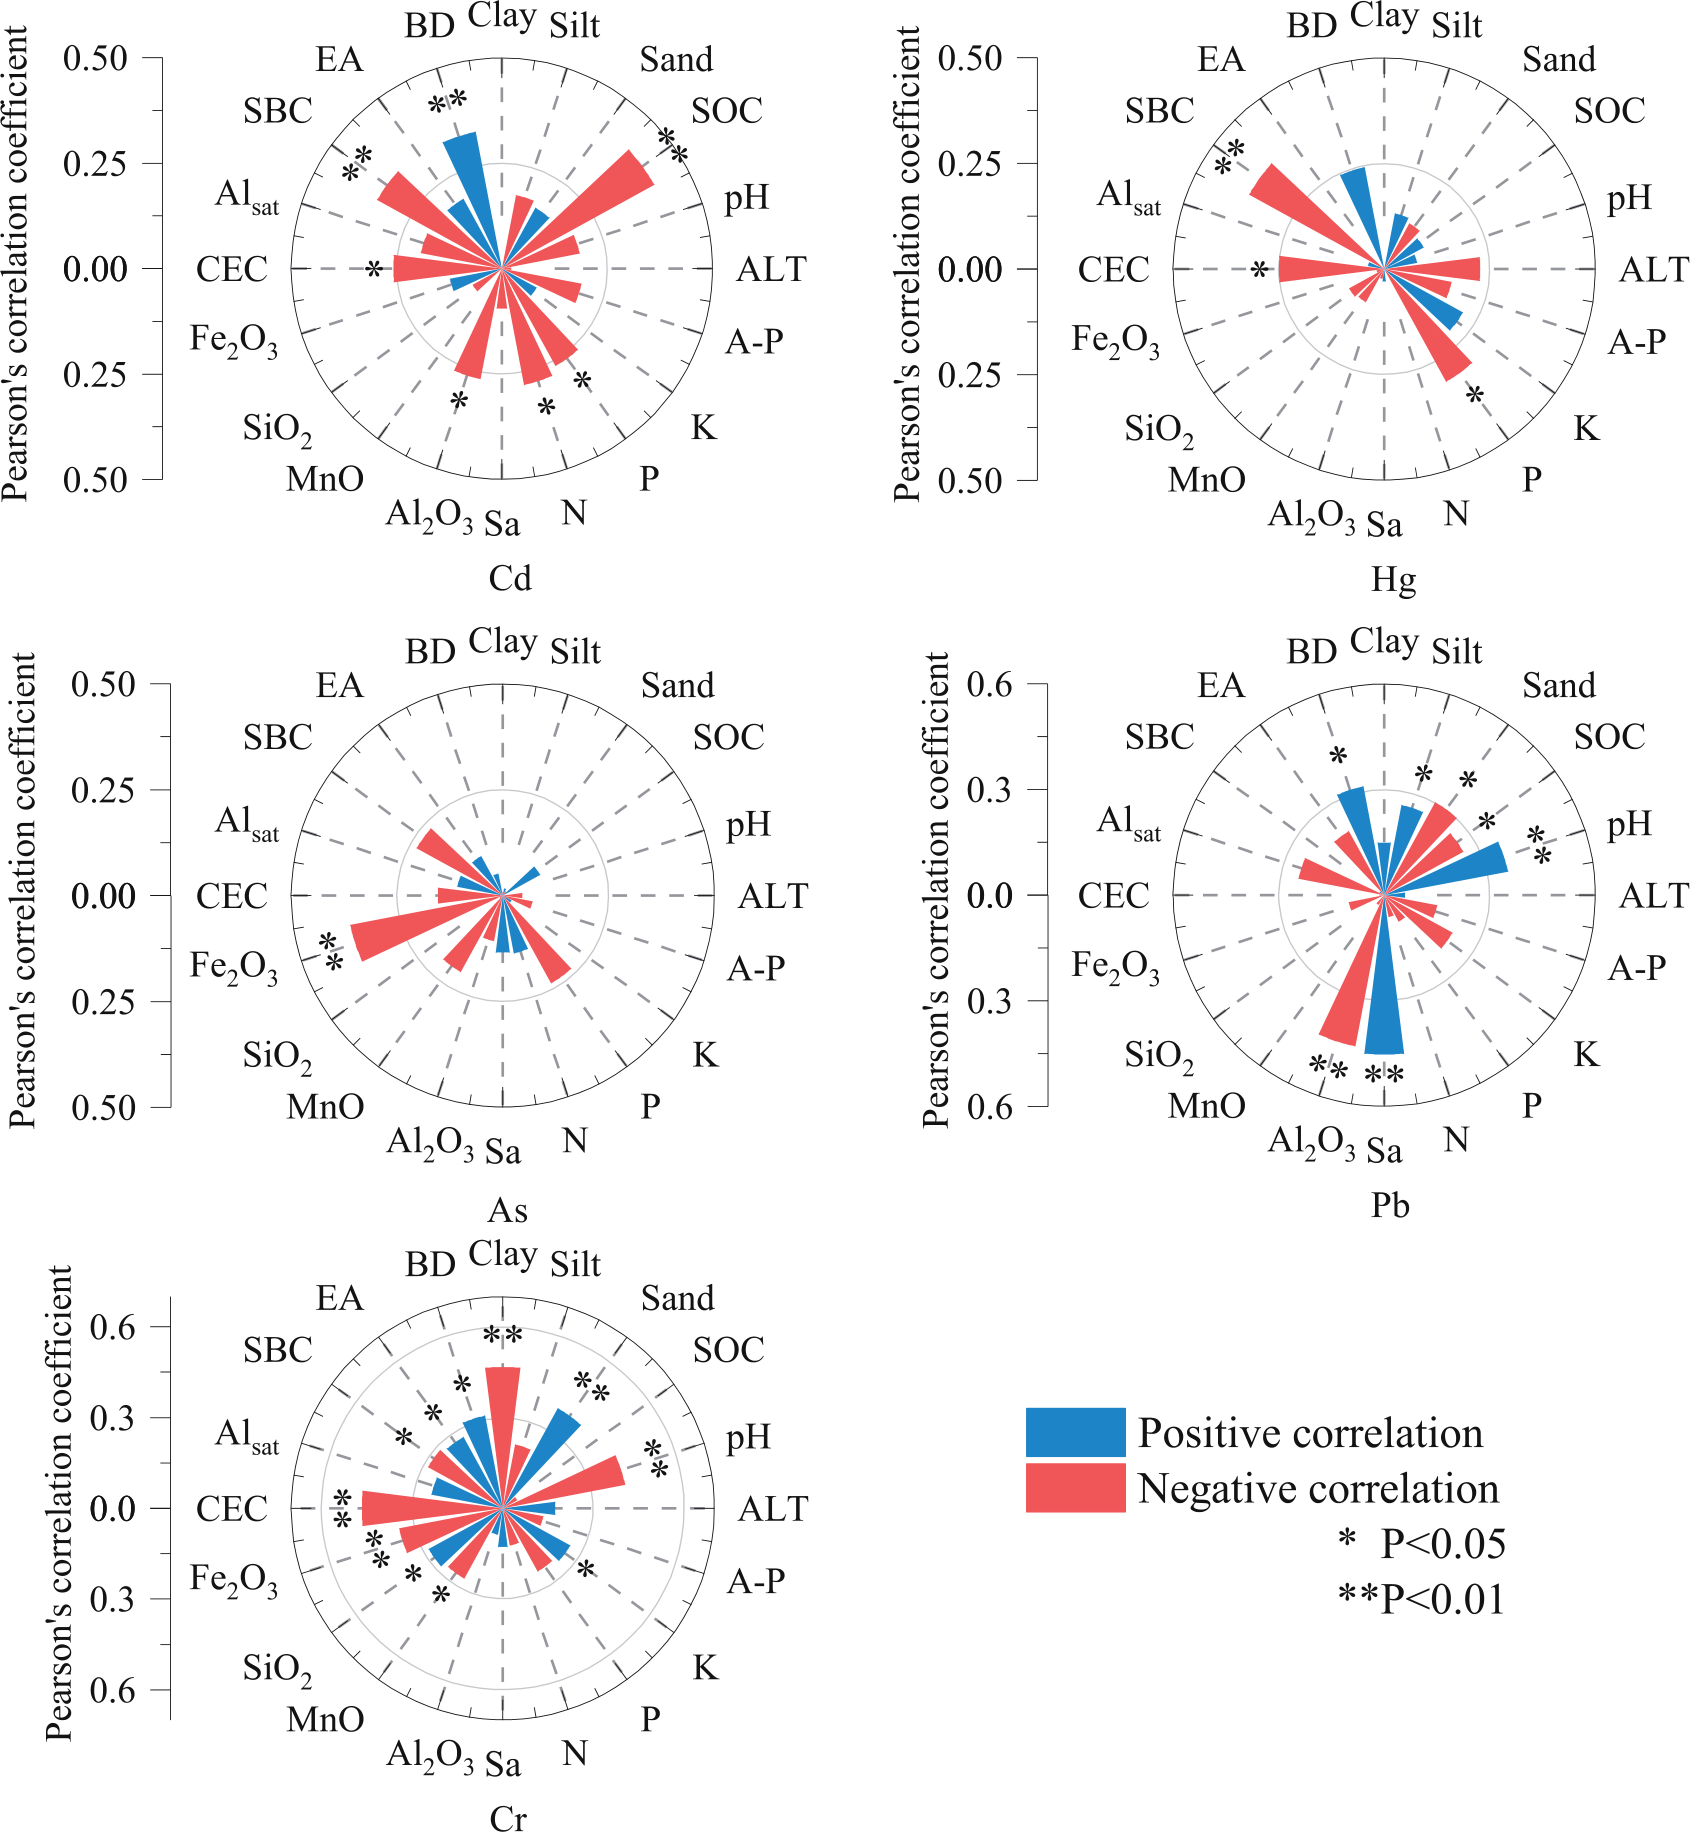
The Hg had notable positive correlations with SOC and ALT in layers A and B1, while it showed notable positive correlations with SBC and CEC in layer B2. This may be related to soil environmental factors and physicochemical properties. The augmentation of SOC in the surface layer enhances the binding of organic matter, such as humic and fulvic acids, to Hg, thus increasing the enrichment of Hg [101], which is the same as the results reported by Qu et al. [102]. In the lower layers of the soil samples, there was an increase in mucilage colloids and, consequently, an increase in the negative soil charge; thus, the effect of CEC on Hg was relatively enhanced. Hg had a strong positive correlation with P throughout the profile, which is congruent with the findings of Chen et al. [103] and Gan et al. [104].
Our results indicated that As had an extremely significant and positive correlation with Fe2O3 in the whole soil profile (Figs. 4-6). This is supported by the conclusion reported by Memon et al. [105], who showed that As in soil solution can be adsorbed on the clay mineral hematite (Fe2O3). It also significantly correlated with P and A-P in the A and B1 layers. This aligns with the findings of earlier research that soil P (e.g., phytate, lecithin, and phosphonate) has the potential to facilitate the release of As from the soil, which leads to As accumulation [106, 107].
There was an extremely notable and negative correlation between Pb and soil pH and an extremely significant and positive correlation between Pb and EA, which was the same as the research reported by Ye et al. [108]. Bravo et al. [109] reported that soil pH had the greatest effect on HM availability and concentration coefficient. There was an extremely notable and positive correlation between Pb concentrations and sand and an extremely notable negative correlation between silt and Pb, which were consistent with the results revealed by Wang and Hu et al. [110].
Fig. 6.
Correlativity of the Cd, Hg, As, Pb, and Cr with some physicochemical properties in the soil’s B2 layer.
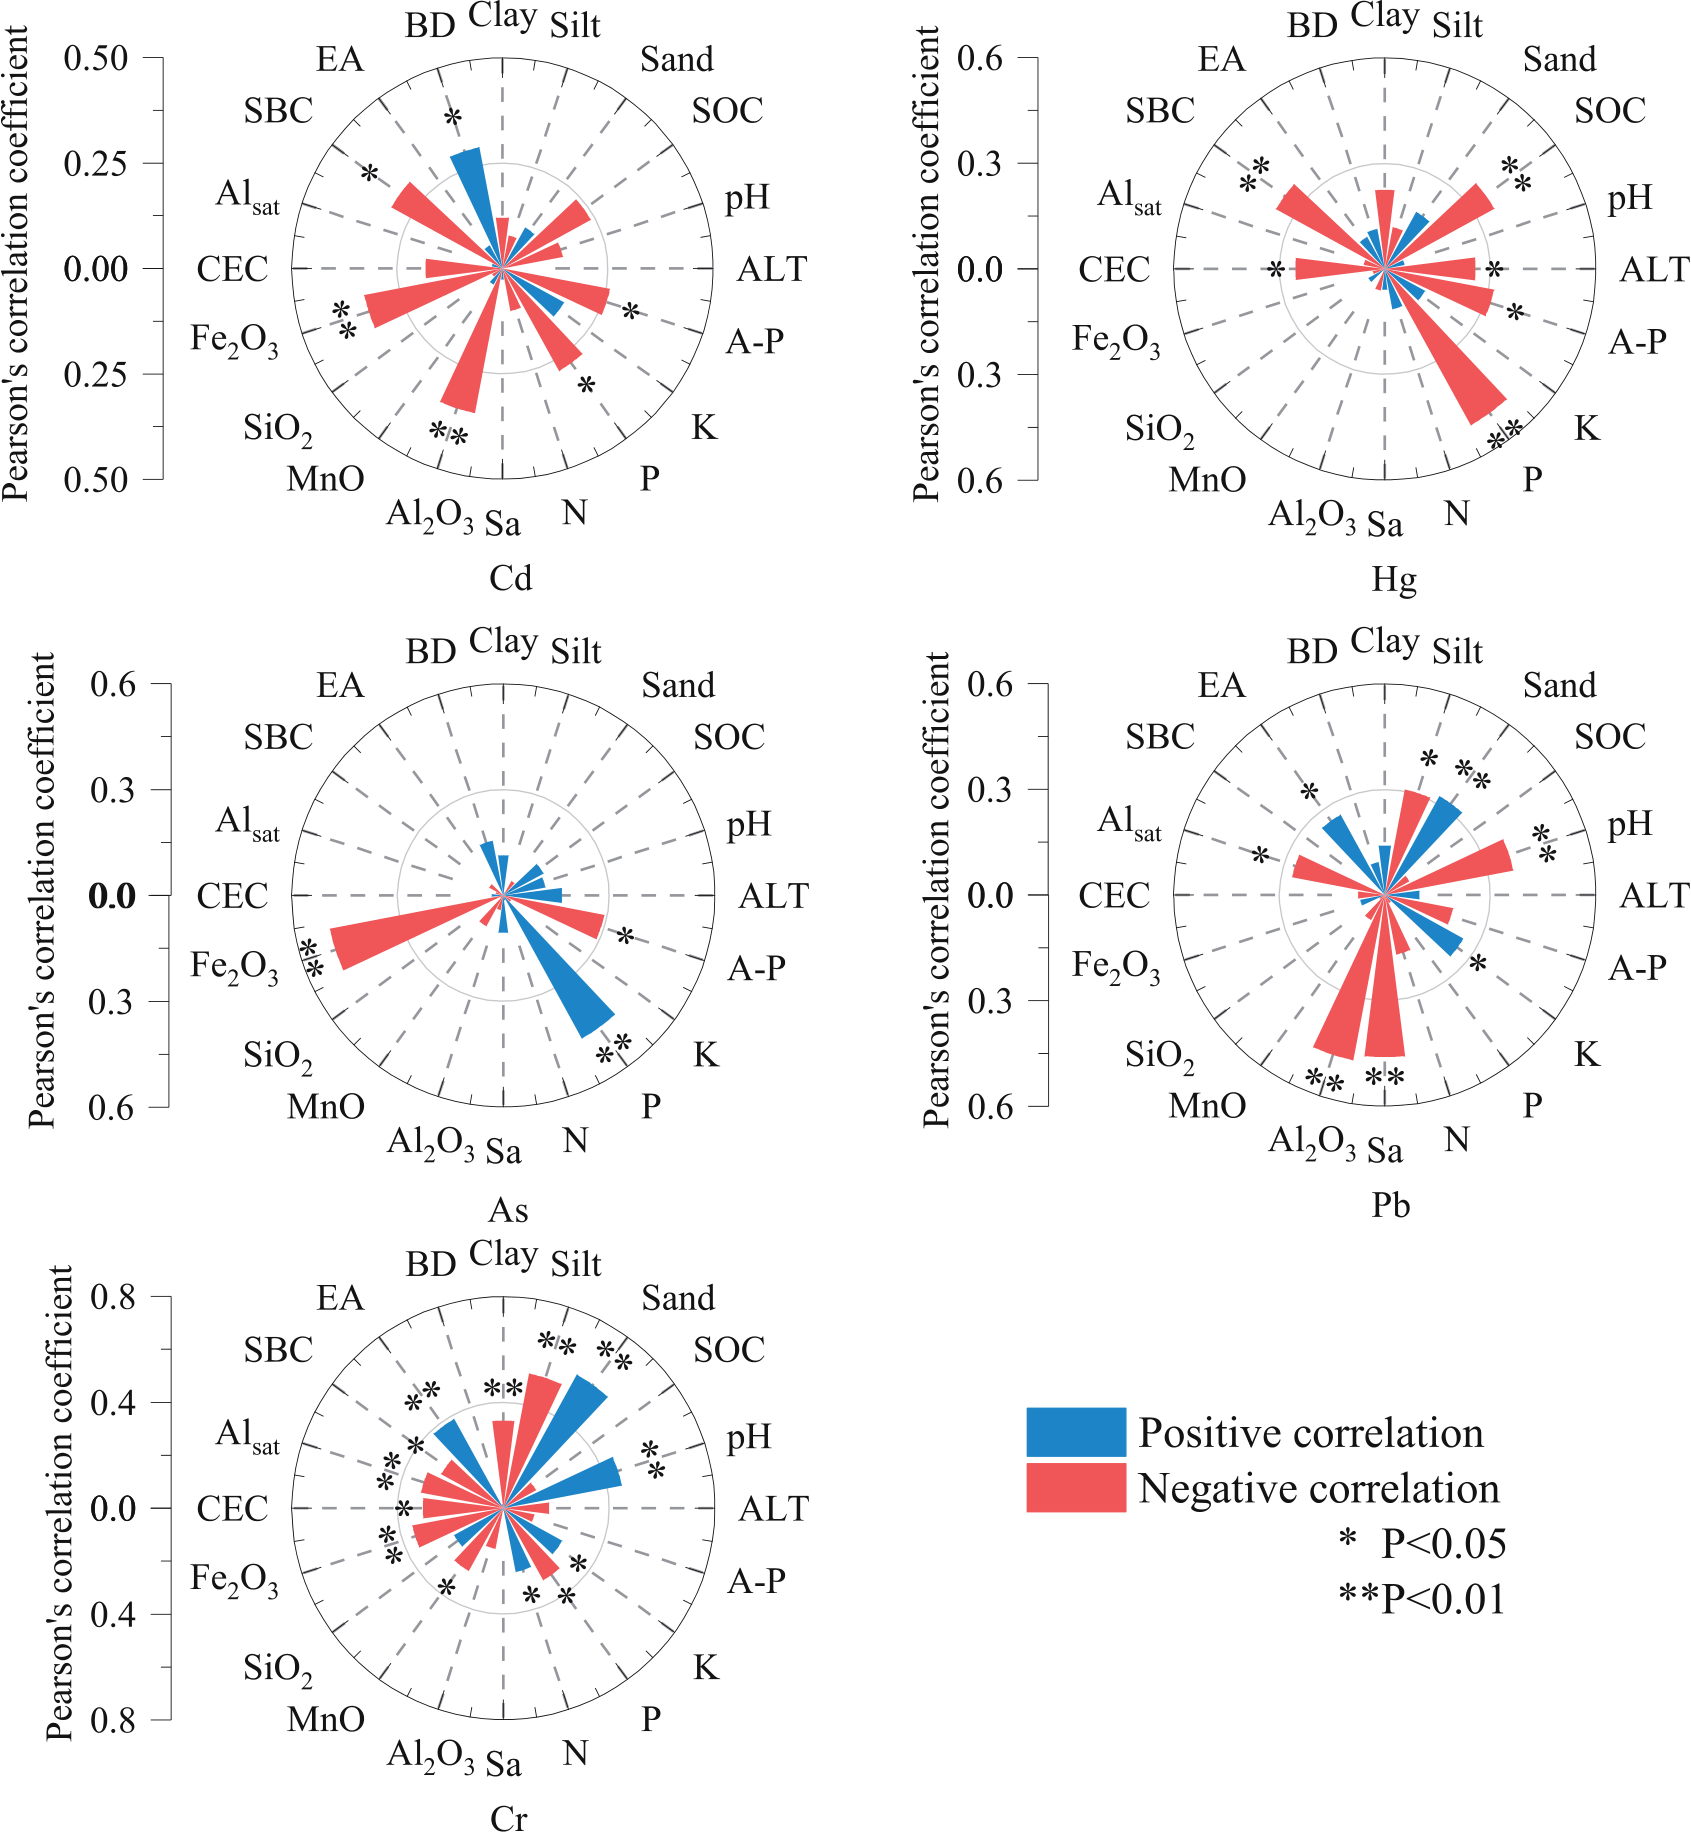
Cr was notably and positively correlated with pH throughout the profile. Merdy et al. [111] showed that with an increase in pH, the amount of Cr adsorbed in the soil and produced complexed precipitation gradually increased, increasing the accumulation of Cr. Additionally, Stewart et al. [112] also showed that the higher the clay content, the stronger the ion exchange capacity and the stronger the adsorption capacity to Cr, and the Cr content in the soil increased correspondingly. This could explain the significant and positive correlation between Cr and clay and CEC. Moreover, the content of Cr exhibited a significant negative correlation with the sand in the whole profile, which is congruent with the results of Zhang et al. [113]. This may be because, with the increase of soil sand content, the leaching of Cr is more intense [114], leading to the decrease of Cr content.
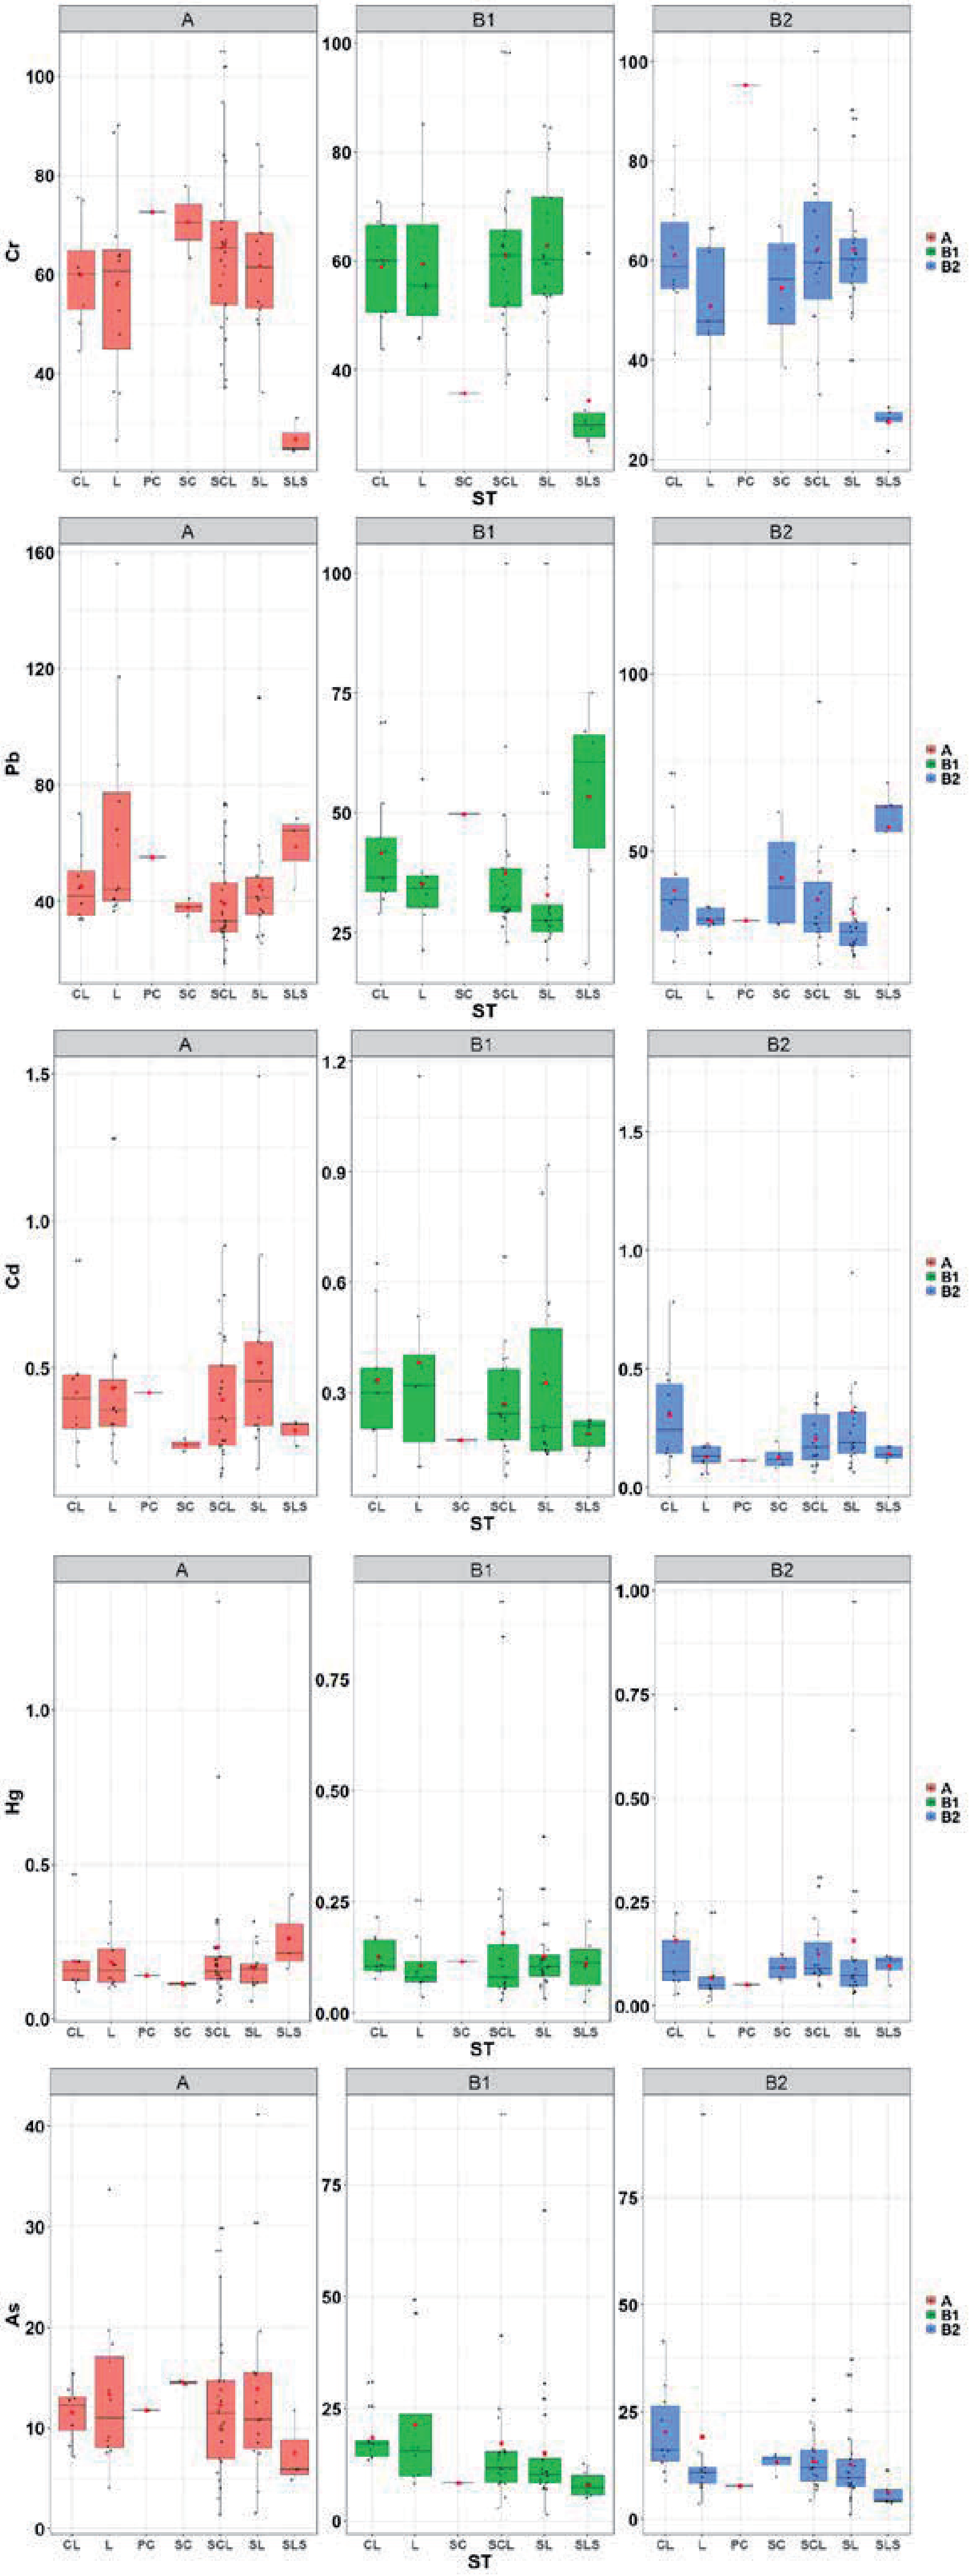
Moreover, our results revealed that HM concentrations in soil were largely affected by soil texture (Fig. 7, Table 3). For instance, the average concentration of Cr in sandy loam soil is obviously lower than in other soil textures, while the average content of Pb in sandy loam soil is clearly higher than in other soil textures (Fig. 7, Table 3). The release and retention of HMs are primarily influenced by soil texture [115], which could also affect HMs’ mobility in the soil [116]. Finer-grained soils typically possess a greater surface area and exhibit a net negative surface charge compared to their coarser-grained counterparts. This enhances the sorption of HMs [117]. Previously, Xu et al. [32] also identified soil texture as the key factor that affects HM accumulation. Sherene [118] found a higher Pb2+ concentration (3889 mg kg−1) in finer-textured soil than in coarse-textured soil (530 mg kg−1).
Quantifying the Effect of Different Factors on HMs using Shapley Additive Explanations
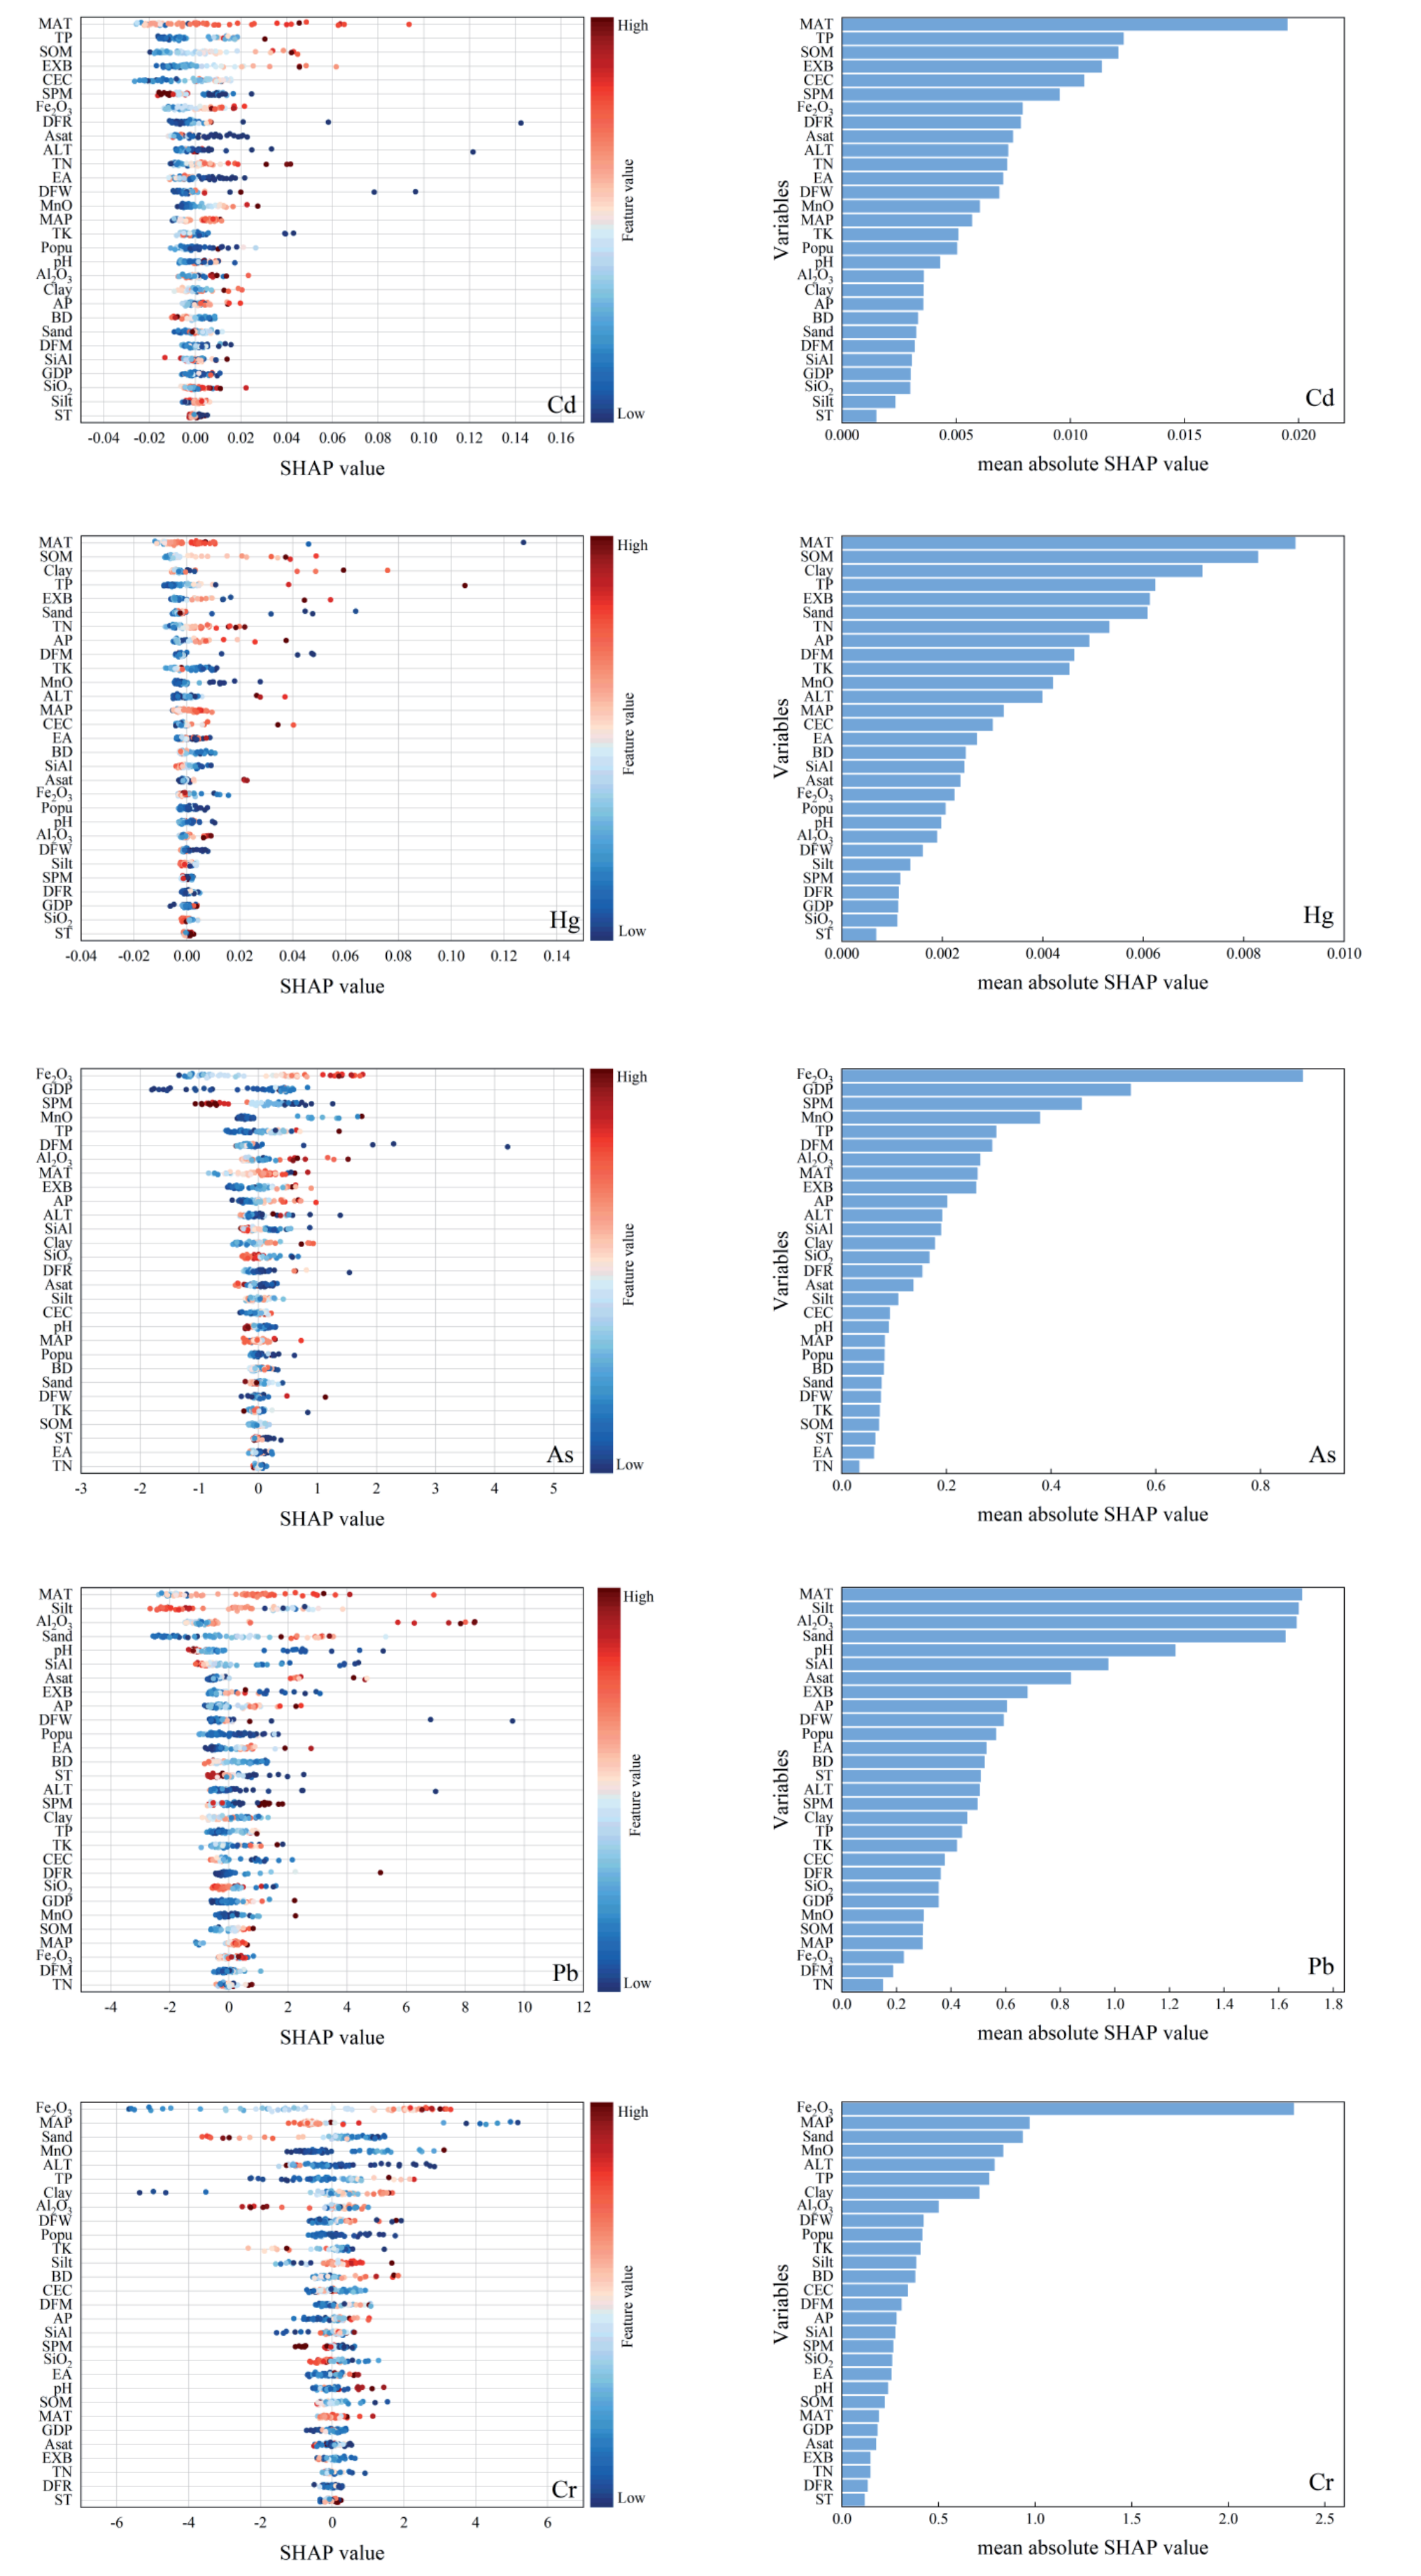
We used the SHAP value and the mean absolute SHAP values to quantify the effect of 29 variables representing different natural and anthropogenic factors on HMs. As shown in Fig. 8, MAT has the largest effects on the accumulation of Cd, Hg, and Pb, while Fe2O3 has the largest impact on the accumulation of As and Cr. Specifically, MAT, TP, and SOM are the top three variables posing the largest effect on Cd. MAT, SOM, and Clay are the top three variables that affect Hg. Fe2O3, GDP, and SPM have the largest effect on As, while MAT, Silt, and Al2O3 have the strongest impact on Pb. Fe2O3, MAP, and Sand show the largest effect on Cr. However, we should also note that there are broad ranges from negative to positive variables on HMs (Fig. 8a)), indicating that their variability would pose different effects on HMs in specific locations. How the soil's physical and chemical characteristics affect HMs has been described above, therefore, we did not repeat it here. Previous studies have confirmed that temperature plays a crucial role in regulating HM accumulation in the soil through regulating release, oxygen diffusion, and biological reactions of HMs [119]. The soil parental material (SPM) was also confirmed as one of the main controls for HMs accumulation in soil. However, the presence of HMs in original minerals in metamorphic and igneous rocks and undergoing processes of separation and accumulation in soils and sediments can result in soil concentrations that show little to no correlation with those of the parent substances, as is the case for Mn [61]. In addition, the types and quantities of soil microorganisms derived from different SPMs are also significantly different, which also further affects the content of soil HMs [120]. GDP represents the intensity of economic activity, including industrial, traffic, mining, and so on. Therefore, it is directly associated with HM accumulation in soil, which has been proven by numerous studies, including Liao et al. [121] and Li et al. [122].
Table 3.
The mean concentrations of heavy metals with different soil textures in different soil layers.
Fig. 8.
SHAP values (left panel) of all the variables for different HMs at 0-20 cm depth with all samples included and the mean absolute values (right panel) of all the variables for different HMs at 0-20 cm depth (GDP means gross domestic product; SPM means soil parent material; TP means total phosphorus; DFM means distance from mining site; MAT means mean annual temperature; EXB means exchangeable bases; AP means available phosphorus; ALT means altitude; Si/Al means silicon to aluminum ratio; DFR means distance from road; Asat means aluminum saturation; CEC means cation exchange capacity; pH means potential of hydrogen; Popu means population density; MAP means mean annual precipitation; BD means bulk density; DFW means distance from water; TK means total potassium; SOM means soil organic matter; ST means soil texture; EA means exchangeable acidity; TN means total nitrogen).
Pollution Assessment of Soil HMs
Geoaccumulation Index
As displayed in Fig. 9, the Igeo values of Cr in all soil samples were below 0 in all three layers, indicating that non-pollution caused by Cr accumulation was detected in the farmland soil of Hunan Province. For the Cd, in layer A, most of the soil samples have Igeo values that belong to mild and inclining moderate pollution degrees; for Hg and As, most of the Igeo values belong to the non-pollution degree. For Pb, almost all the soil samples have Igeo values belonging to mild and inclining moderate pollution degrees.
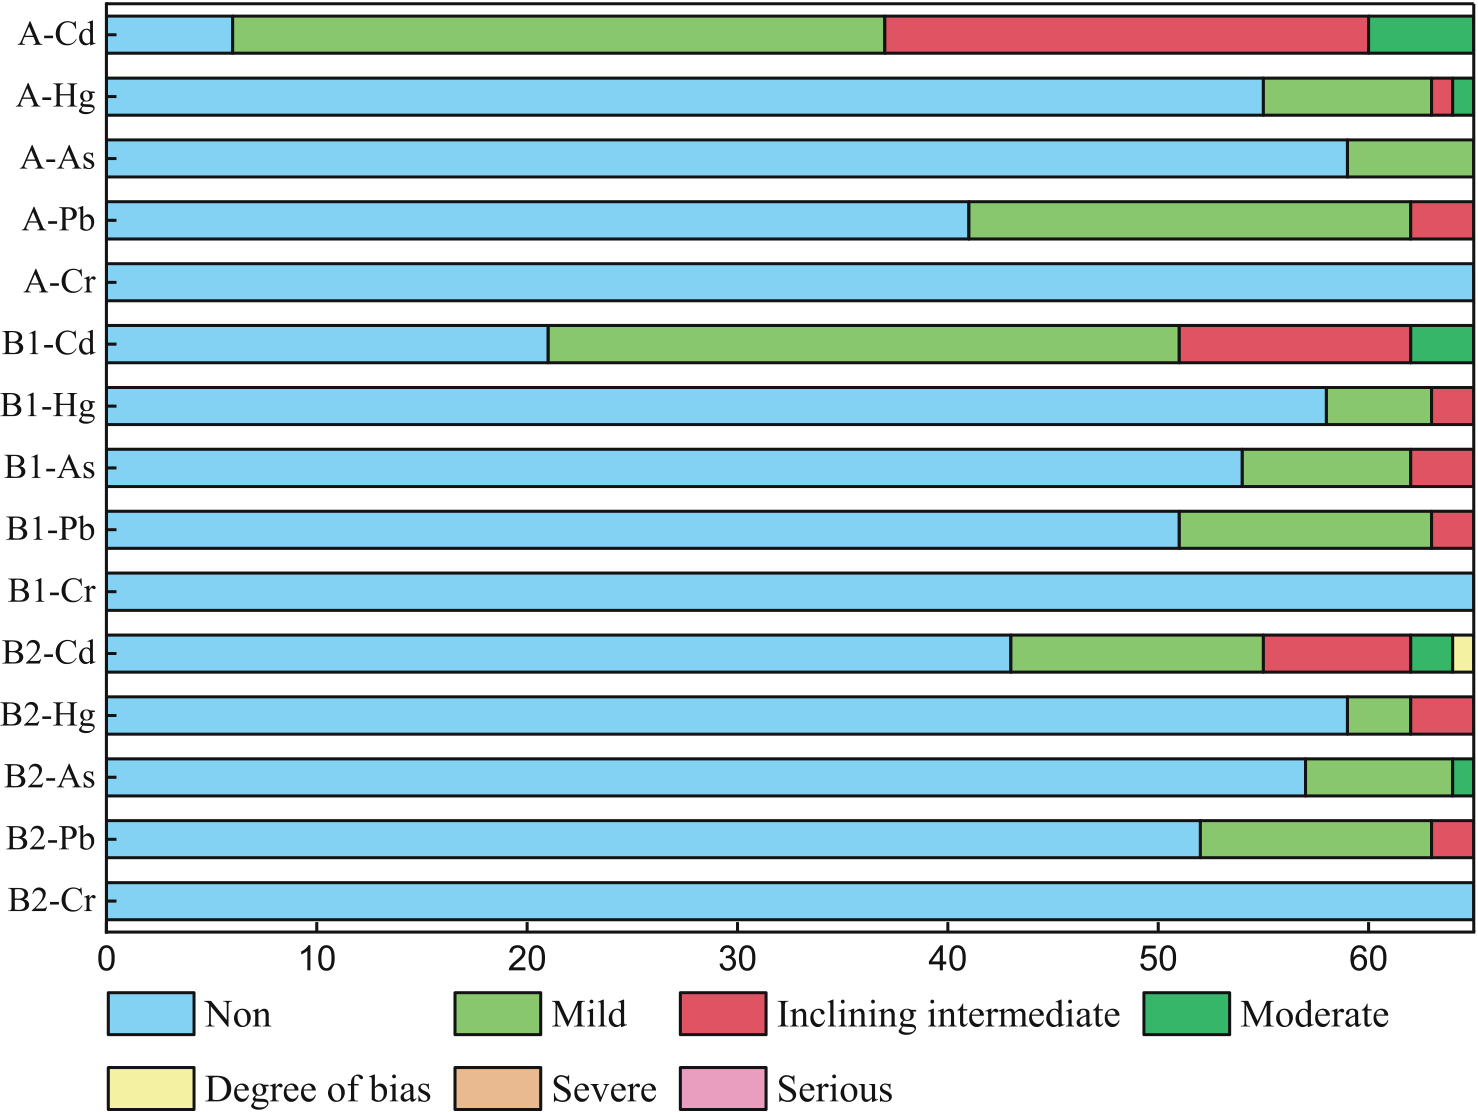
In layer B1, most soil samples have Cd content that is mild and inclined to moderate pollution degree. For Hg, most of the soil samples have Hg content belonging to non-polluted. In terms of As, most soil samples were at the non-polluted level. For Pb, most soil samples belonged to the non-polluted level, and a few samples belonged to the mildly polluted and inclining moderate pollution levels.
In layer B2, most of the soil samples have Cd content that is mild and inclined to moderate pollution degree. For the Hg, most of the soil samples had a content of Hg that was not polluted, except for a small part of the soil samples that belonged to a mildly polluted level. In addition, most of the soil samples had As content that belonged to the not polluted level, indicating that As had downward permeability to soil pollution in the survey region. Similar to the As, most soil samples have Pb content that is at the non-polluted level.
Table 4.
The Potential Ecological Risk Index.
The Potential Ecological Risk Index
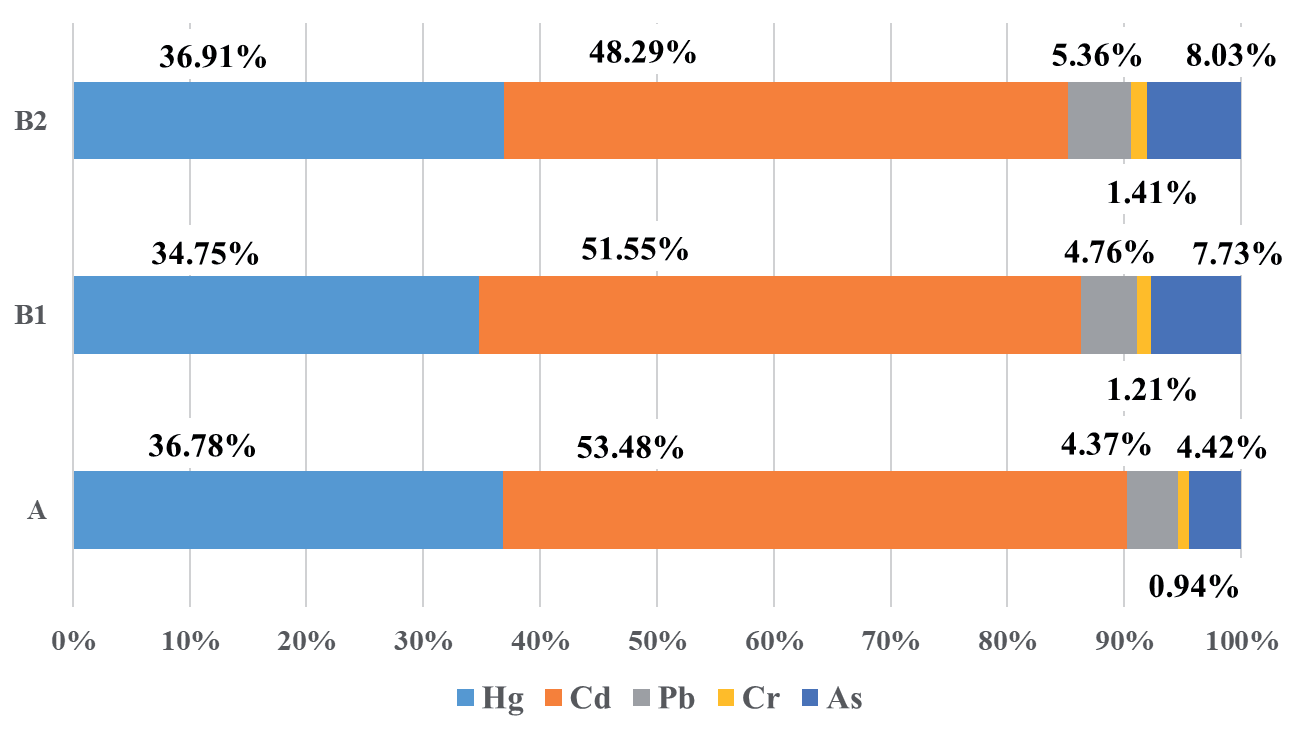
As listed in Table 4, the study area’s comprehensive potential ecological risk index (RI) was 47.17, which is at a medium risk level. This revealed that HM pollution in the research field is relatively high and deserves greater attention to HM pollution control. Among the different HMs, the average potential ecological risk index of Hg in different soil layers varied between 36.93 and 46.47, which makes the largest contribution to the comprehensive RI index (Fig. 10). It indicates that Hg is the most important HMs element for inducing potential ecological risk in the research field. The impact on soil layers declines steadily from A to B2. As presented in Fig. 7, As is the most seriously polluted HM in the B1 layer. Generally, among the HMs under survey, the ranking of potential ecological risk followed the order: Cd > Hg > As > Pb > Cr.
Health risk assessment
Table 5 lists the average values of HQ, HI, and CR through ingestion, inhalation, and dermal contact for five HMs in the surface layer of soil samples. Further, the HI value of individual HM for surface soil samples follows the order: As > Pb > Cd > Hg > Cr. The HI values of Cr, Cd, and Hg for adults were larger than for children, contrasting with Pb and As. Dermal contact (HQdermal) made the largest contribution to HIs of Cr, Cd, and Hg, while ingestion (HQing) made the dominant contribution to HIs of Pb and As for both children and adults. The ingestion (HQing) made the largest contribution to the total HI of all HMs, followed by dermal contact (HQdermal) and inhalation (HQinh) for both children and adults. It seems to be the predominant contaminant that leads to the largest non-carcinogenic risks to both children (1.96E-01) and adults (9.92E-02) in Hunan Province (Fig. 11). The total values of HI for both children (2.70E-01) and adults (1.55E-01) were lower than 1.0, revealing no non-carcinogenic effects of HMs accumulation in the farmland of Hunan Province.
Table 5.
The average carcinogenic and non-carcinogenic risks of HMs in surface soil to adults and children.
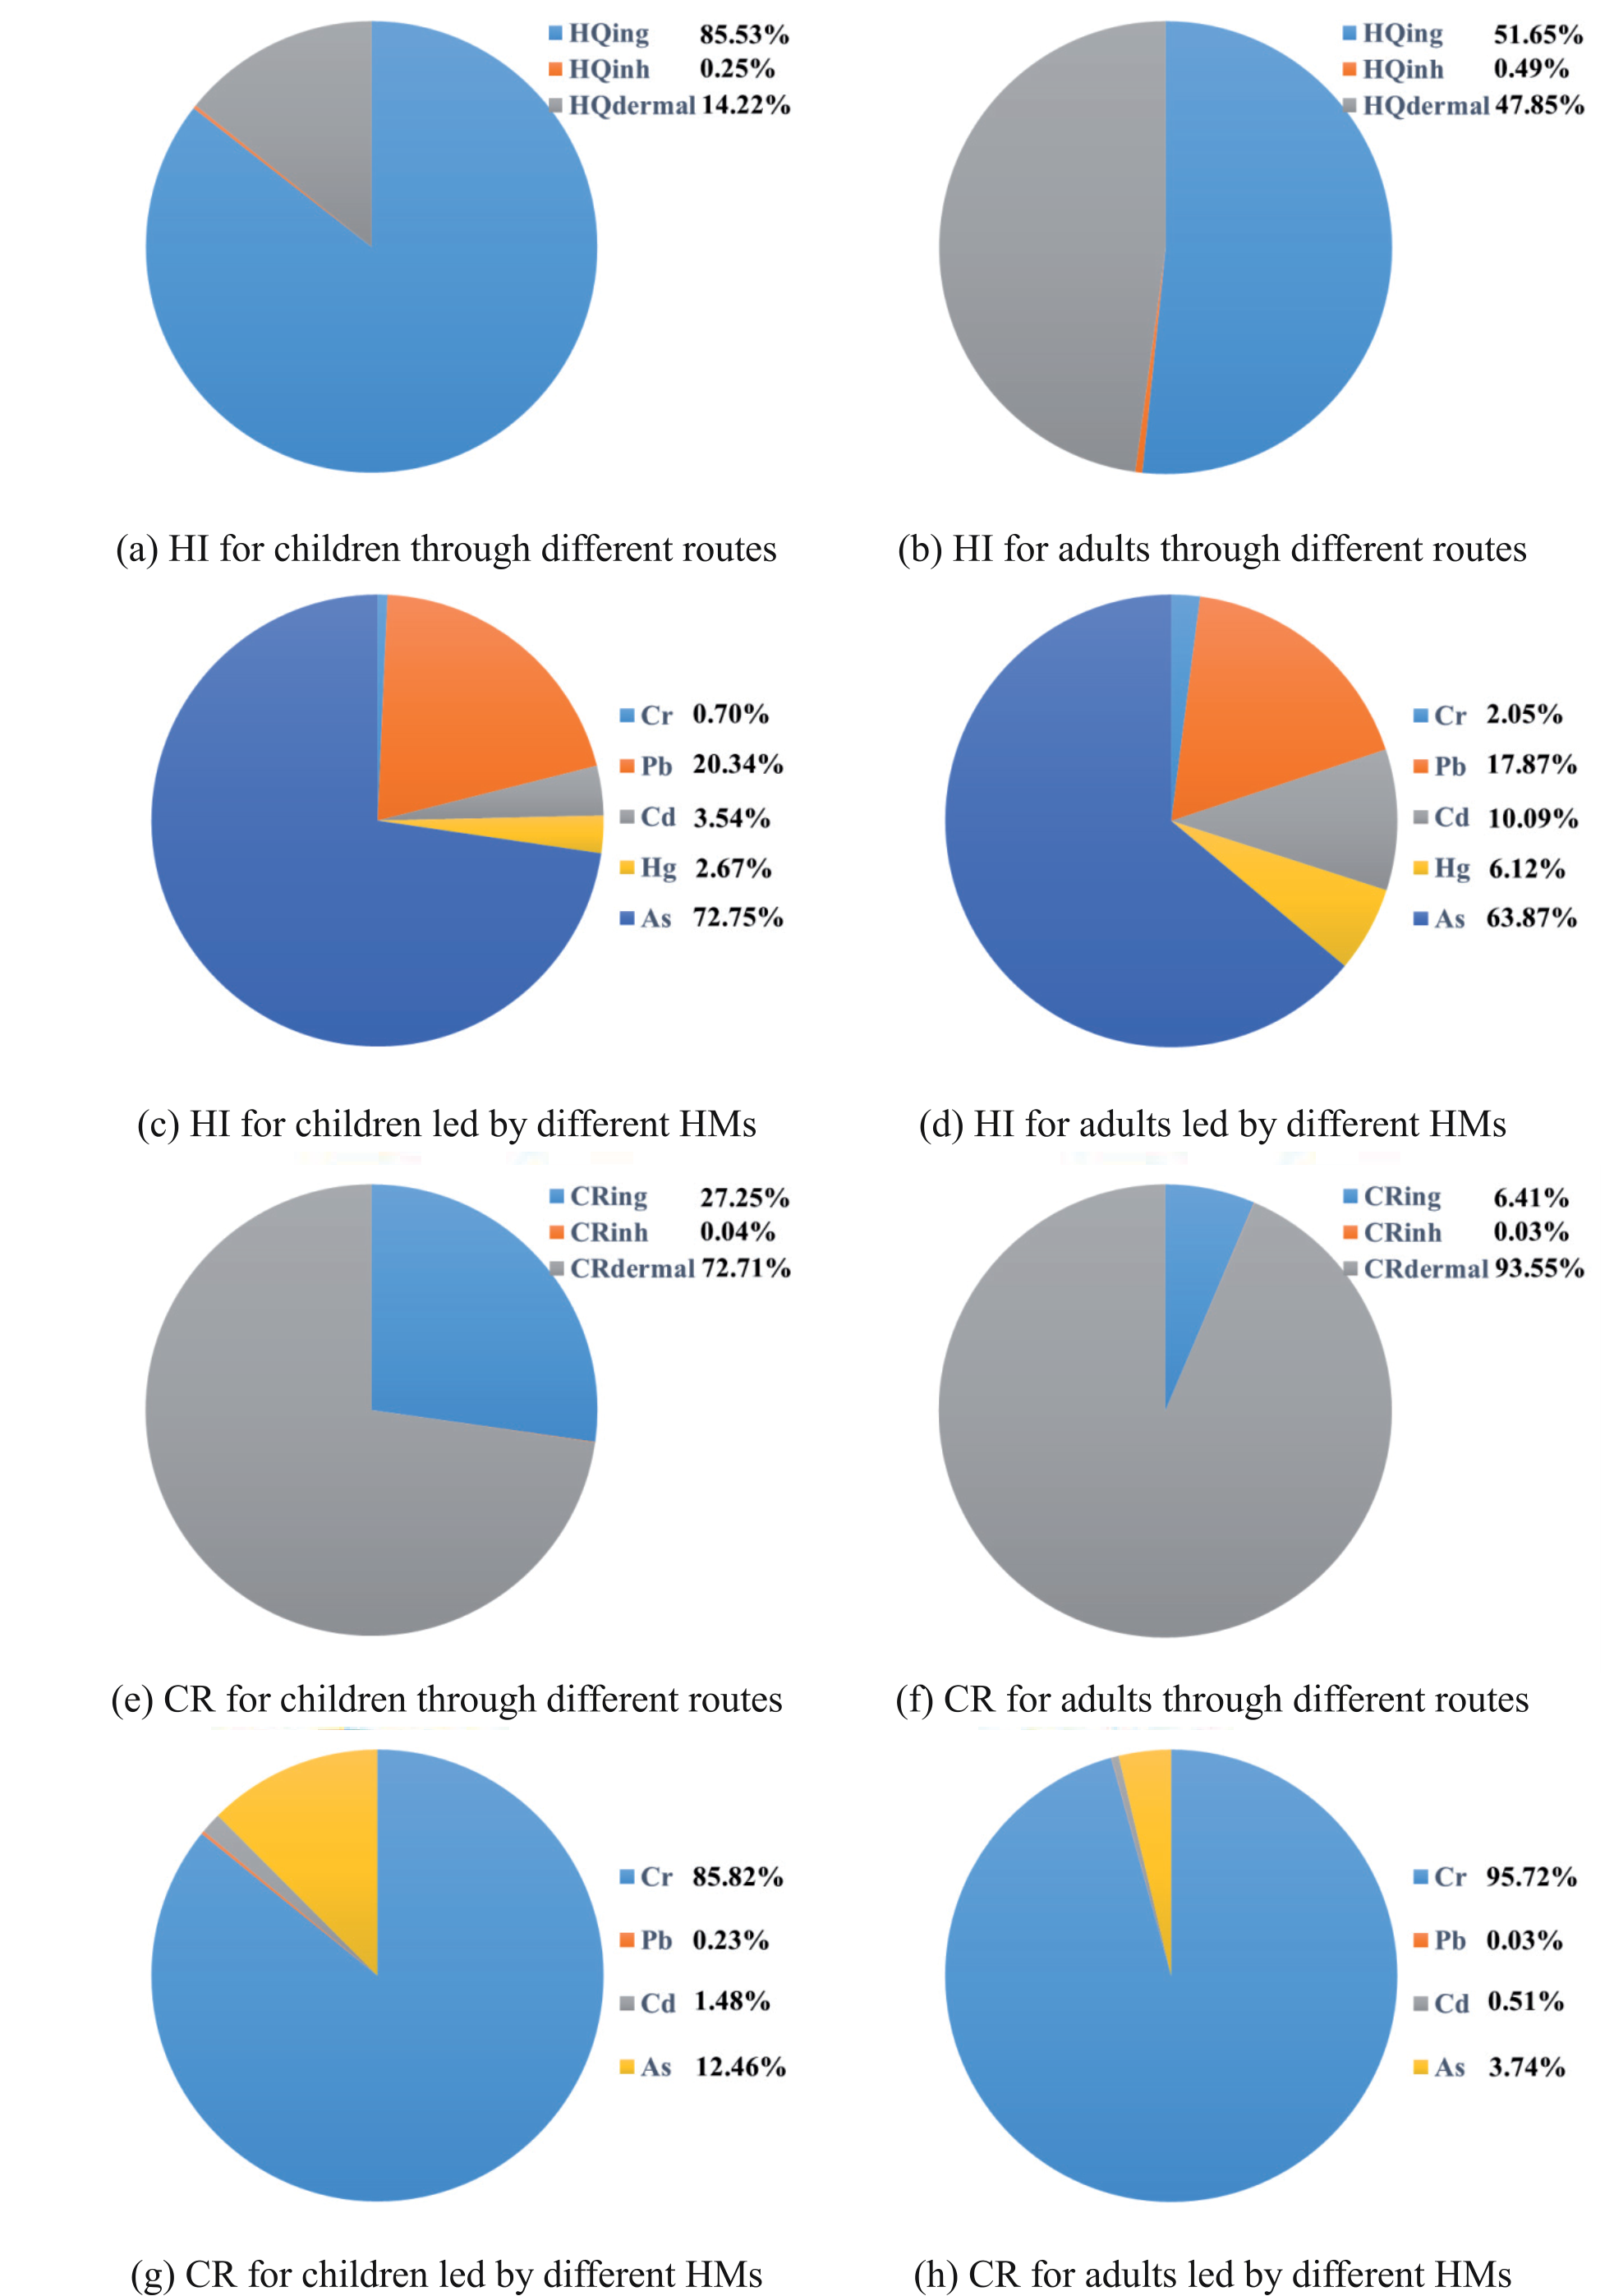
As for carcinogenic risk, the CR value for individual HM follows the same order for both children and adults: Cr > As > Cd > Pb. In particular, the CR values of Pb, Cd, and As for children were larger than those for adults, contrasting with those for Cr. For children, dermal contact (CRdermal) made the largest contribution (81.46%) to the carcinogenic risk caused by chronic exposure to Cr pollution. Ingestion (CRing) takes the largest account for the carcinogenic risk caused by long-term exposure to Pb (90.07%), Cd (90.14%), and As (78.81%) pollution. For adults, dermal contact (CRdermal) made the largest contribution to the carcinogenic risk caused by chronic exposure to Cr (96.03%) and Pb (98.31%) pollution, and ingestion (CRing) took the largest contribution to the carcinogenic risk caused by long-term exposure to Cd (62.08%) and As (62.12%) pollution. The CR values of Cr, Cd, and As for children and adults were larger than 10-6, which reflects the substantial carcinogenic risk of these HMs to children and adults in Hunan Province. The total CR values for both children (8.08E-04) and adults (1.19E-03) were larger than 1.00E-04, indicating high and unacceptable carcinogenic risk due to long-term exposure to HMs. Dermal contact was the dominant route to induce carcinogenic risk caused by HM pollution, accounting for 72.71% and 93.55% of the total carcinogenic risk for children and adults, respectively (Fig. 11). Cr made the largest contribution to carcinogenic risk for children (69.86%) and adults (91.87%).
Conclusions
In this research, we found that the average concentrations of Cd, Hg, Pb, and Cr showed a decreasing trend with an increase in soil depth in the farmland of Hunan Province. The Pb and Cd were mainly sourced from industrial and traffic activities, As and Cr were largely derived from agricultural and natural sources, and Hg mainly stemmed from atmospheric deposition. The Cr was significantly and positively correlated with pH throughout the profile, while Pb and soil pH had an extremely significant negative correlation. Cd was notably positively correlated with SBC in the whole soil profile. And Hg showed notable positive correlations with SOC and ALT. In addition, soil parental materials and soil textures also largely affected the concentrations of HMs. The MAT had the largest effect on Cd, Hg, and Pb accumulation, while Fe2O3 had the largest impact on the accumulation of As and Cr. There are no essential non-carcinogenic effects of HM accumulation in the farmland of Hunan Province. However, a high and unacceptable carcinogenic risk due to long-term exposure to HMs pollution was detected in the farmland of Hunan Province. Dermal contact was the dominant way to result in carcinogenic risk. As was the predominant contaminant that led to the largest non-carcinogenic risks, and Cr was the main contaminant that led to carcinogenic risks. Our results could provide valuable implications for ensuring the security of farmland production and guaranteeing public health.

