

Introduction
Environmental problems caused by municipal solid waste (MSW) are a critical and emerging issue, as the generation rate of MSW is rising with the increase in global population. The disposal of hazardous waste from households, such as batteries, paint residue, ash, treated wood, electronic waste, industrial waste, and construction waste, can contribute to the risk of minerals and/or potentially toxic elements at municipal disposal sites [1-3]. Inadequate source separation, waste management plans with no established laws, and the prevailing disposal systems can lead to environmental pollution. Unmanaged dumping of MSW may have detrimental consequences on terrestrial and surface water bodies through runoff and leachate [4]. Leachate released is a source of PTE and has a higher tendency to pollute surface and groundwater than industrial wastewater [5].
Complex interactions of PTE with different components of the ecosystem around an MSW disposal site led to environmental contamination [6, 7]. Potentially toxic elements that are mostly investigated in MSW disposal site environments are Cd, Mn, Cu, Ni, and Pb [8-14]. Cadmium is a carcinogenic agent as well as nephrotoxic element [8], Mn is an essential trace element for humans, but long-term environmental or occupational exposure can lead to numerous health problems [15], Cu is an essential element for growth and development of human body [16] and their consumption in excess may lead to health problems such as reproductive system disorder, anemia, irritability, stomach diseases, kidney disorder, liver disease, skin and eye irritation [17-19]. Similarly, Ni is a known hematotoxic, immunotoxic, neurotoxic, genotoxic, reproductive toxicant, pulmonary toxicant, nephrotoxic, hepatotoxic, and carcinogen [20], and Pb exposure tends to cause central nervous system toxicity, especially in children, and may cause encephalopathy [21].
Currently, Pakistan is producing about 49.6 million tons of MSW annually with an increase of 2.4% per year [22, 23]. Like other developing countries, the country is lacking a proper MSW management infrastructure. The generated MSW is mostly either burnt, left uncollected, or dumped openly [23]. Most of the studies [24-28] conducted in major cities of the country are based on quantification, disposal, and recycling of waste produced. However, quite limited attention is being given to related surface and groundwater contamination, specifically in the study areas [29].
There exists a greater chance of water pollution in the vicinity of MSW disposal sites due to leachate mobility originating from the dump. Hence, leachate leakage from MSW disposal sites can cause contamination of both surface and ground water as well as agriculture and natural ecosystems, particularly when uncontrolled leachate gets released from the dump sites, and thus, can cause environmental health problems [30-32]. The dumpsite leachate is a concern due to its complex nature. It is composed of various pollutants, such as PTE, organic and inorganic compounds, nutrients, and suspended solid particles [33-35]. Potentially toxic elements present in leachate from improper disposal of MSW pose a significant threat to public health by causing several health effects to humans as well as ecotoxicological impacts on terrestrial and aquatic ecosystems [36]. The elements also inhibit the synthesis and growth of photosynthetic pigments in plants [37, 38].
In the absence of an effective policy on the proper disposal of MSW, the developing countries find it hard to cope with the environmental challenges. Open dumping of MSW is a common practice in most cities of Pakistan, especially in the Khyber Pakhtunkhwa region. This study has been designed with two primary goals: (a) to evaluate exposure to contamination by the five PTE in surface and ground water, and (b) to estimate lifetime human health risks due to ingestion of groundwater. The overall objective of this study was to assess the health risk associated with PTE contamination in groundwater used for drinking in communities near the selected MSW dumpsites (Abbottabad, Bannu, and Peshawar) of Khyber Pakhtunkhwa. Additionally, the study aimed to identify the sources and level of groundwater pollution using multivariate statistical analysis as well as pollution evaluation indices. However, the study is mainly descriptive by design, supported with a correlational analysis, in a limited area of Khyber Pakhtunkhwa. The findings will help relevant authorities and policymakers in addressing PTE contamination around the selected dumpsites for effective waste management.
Materials and Methods
Study Area
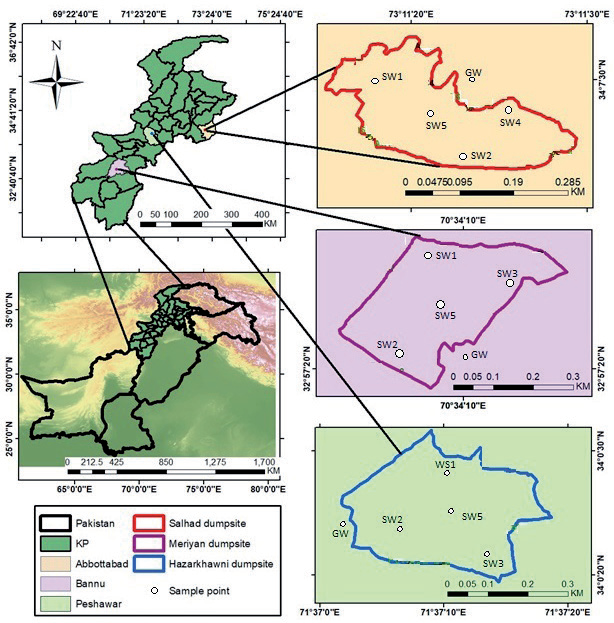
The Khyber Pakhtunkhwa, Pakistan, spans diverse terrain from high mountains to plains, including urban centers such as Abbottabad, Bannu, and Peshawar. Based on climate, rainfall, temperature, altitude, and topography, the province of Khyber Pakhtunkhwa (KP) is divided into different ecological zones as reported in the climate change policy, developed by the provincial Environmental Protection Agency [39]. Three urban setups (Abbottabad, Bannu, and Peshawar) from three different ecological zones of the KP province were included in the study (Fig. 1). Abbottabad is located at 34.1495°N latitude and 73.2117°E longitude in Hazara District. It is located at an altitude of about 1,260 meters above sea level. It has a moderate climate and receives about 1,200-1,500 mm of rainfall annually. Bannu is another city in KP that serves as the headquarters of Bannu District. It is located at 32.9861°N latitude and 70.6042°E longitude. It experiences a semi-arid climate and receives about 200-300 mm of rainfall annually. Peshawar, the capital of KP, is located approximately at 34.0150°N latitude and 71.5250°E longitude. It experiences a semi-arid climate where annual rainfall ranges from 400-600 mm. Much of the rainfall occurs in all the locations during the monsoon season, which typically runs from July to September.
Due to rapid urbanisation, inadequate infrastructure, and limited resources waste management in KP region faces challenges especially in urban setups, where MSW, that is mostly composed of food waste, yard trimmings, plastic materials, paper, clothes, metal, glass, and a little amount of electronic waste, batteries, car chunks, and disposed drugs, etc. Such waste is collected from homes, commercial areas, and public places, whereby it is transported and disposed of openly by municipal workers in MSW disposal sites located near urban setups.
Surface and Groundwater Sampling
Based on the ecological zones, both surface and groundwater sampling were done from three urban setups, namely Abbottabad, Peshawar, and Bannu. The surface water samples were collected from mid-July to August 2018. Surface water sample points were selected based on natural streams draining the study area, flow regimes, and topography. Next, composite samples were taken from the MSW disposal sites at five sampling points. Points SW1–SW4 were located in all four directions, while SW5 was in the middle of the MSW disposal sites [40]. For groundwater quality assessment, composite samples were collected in clean polyethylene bottles with a 1-liter capacity.
Physicochemical and Heavy Metals Analysis
Electrical conductivity (EC) and pH were determined by using EC cum pH meter (OHAOS-ST, 300). While PTE concentrations (Cd, Mn, Cu, Ni, and Pb) in surface and groundwater samples were measured using an atomic absorption spectrometer (AAS, PG-9900). A standard curve was obtained by running a prepared standard solution for each analyte. One hundred milliliters of each sample was transferred to a beaker. Concentrated 5 ml of hydrochloric acid was added and heated using a hot plate until the volume was reduced to 20 ml. The sample was cooled and then filtered. The pH of the digest sample was adjusted to 4 by adding 5.0 M NaOH. The sample was transferred to a 100 ml volumetric flask and then diluted to the mark with deionized water prior to analysis [40].
Quality Control
For quality assurance, the source was drained for at least 5 minutes to eliminate immobile water before the collection of a groundwater sample. Next, all readings were taken in triplicate along with double deionized water as a blank after standardization of the equipment used. In addition, certified reference material (ERM-CA615 with 97.1%±2.6SD) was used to ensure accuracy and precision of measurements by atomic absorption. Furthermore, standard chemicals of analytical grade purchased from Merck (Darmstadt, Germany) were used. Glassware was acid (10% nitric acid) and double deionized water washed, followed by drying before use to eliminate any contamination.
Heavy Metals Pollution and Health Risk Assessment
Pollution Evaluation Index (PEI)
To evaluate single metal contamination, a single factor evaluation index was proposed by [41] that can be computed using Equation (1).
Where Pi, Ci, and Si are the environmental quality index of pollutant i, concentration of ith parameter in the sample, and standard concentration of ith parameter, respectively.
Metal Index (MI)
To gain an understanding of the overall groundwater quality at the selected MSW disposal sites, the MI was employed [42].
Where Ci and (MAC) i are the concentration of ith parameter in the sample and the maximum allowable concentration of ith parameter, respectively. For groundwater quality evaluation, the critical value of MI is 1. The MI values ˃1 represent a potential health risk warning [43].
Heavy Metals Pollution Index (HPI)
Where n is the total number of parameters considered, Wi, is the unit weightage of the ith parameter, and Qi, is the sub-index of the ith parameter that is calculated by Equation (2).
Where Mi, Ii, and Si are monitored, ideal, and standard values of the ith parameter of the examined heavy metals. The HPI critical value for drinking water is 100. If the calculated HPI is higher than 100, the water is not suitable for drinking and can cause severe health damage [44, 45].
Heavy Metal Evaluation Index (HEI)
HEI is another heavy metal evaluation index used to gain an overall understanding of potential water contamination [46].
Where Hc and Hmac are the observed and maximum allowable limits of the ith parameter, respectively.
The purpose of utilizing the above four indices simultaneously to analyze the data was to have a clearer idea of potential groundwater contamination from MSW disposal sites. This approach was adopted because each index has its own strengths and limitations.
Health Risk Assessment
Assessment of health risk associated with study PTE was calculated by following the method used by [47]. For this purpose, the average daily dose (ADD) and hazard identification index were used. The ADD was calculated by using Equation (6).
Where Ci is the concentration of ith metal, IR is the ingestion rate, EF is the exposure frequency, ED is the exposure duration, BW is the body weight, and AT is the average time.
The details of the input parameters of equation 6 are given in Table 1 (collected through a survey).
Results and Discussion
Physicochemical Characteristics of Surface Water
Results of pH, EC, and PTE mean values, investigated in the surface water of all the selected MSW disposal sites, are given in Table 3. The pH ranged from 6.80- 7.30 <7.05±0.24 >, 6.70-7.20 <7.00±0.23>, and 6.90-7.40 <7.12±0.20> in the MSW disposal sites’ surface water of Abbottabad, Bannu, and Peshawar, respectively. Next, the EC values ranged from 12,195.00-16,193.00 <14430.73±1152.82>, from 11,882.00-24,144.00 <16061.25±937.35>, and from 18,124.30-21,686.30 <19824.08±893.23> μS/cm in all the MSW disposal sites sequentially. All pH mean values were found within the acceptable range of 6.5-8.5, as set forth in NEQS. While noticeable difference in pH values at SW1 (7.30) and SW4 (6.90) was due to surface water collected from old and fresh MSW dumping portions of the Abbottabad MSW disposal site. Next, high values of EC were observed, indicating high conductivity that might be due to the presence of dissolved salts and minerals. Overall, fluctuation in the values of both pH and EC observed at all the locations might be due to differences in MSW composition, environmental conditions, and lethogenic characteristics that existed at the selected MSW disposal sites [49-51].
Whereas, the concentrations of PTE (Cd, Mn, Cu, Ni, and Pb) were found sequentially as, the Cd (0.01- 0.04 ˂0.02±0.00˃, 0.02-0.10 ˂0.05±0.01˃ and 0.001- 0.02 ˂0.02±0.00˃ mg L-1), Mn (0.00-2.30 ˂0.71±0.05˃, 0.0-1.70 ˂0.85±0.08˃ and 0.00-1.10 ˂0.57±0.03˃ mg L-1), Cu (not detected), Ni (1.90-2.70 ˂2.41±0.17˃, 1.50-2.70 ˂1.49±0.02˃ and 1.10-2.70 ˂2.30±0.30˃ mg L-1) and Pb (0.00-0.20 ˂0.08±0.01˃, 0.00-1.00 ˂0.72±0.04˃ and 0.00-1.30 ˂0.53±0.03˃ mg L-1) in Abbottabad, Bannu and Peshawar MSW disposal sites across different sampling points (SW1, SW2, SW4, SW5), (SW1, SW2, SW3, SW5) and (SW1, SW2, SW3, SW5) respectively. The mean concentrations of Cd at all the locations were found lower (below the NEQS limit of 0.10 mg L-1). However, its continuous flow from leachate to sinks, i.e., soil and groundwater, may build up its concentration due to the process of accumulation [52]. While mean concentrations of Mn, Ni, and Pb were found crossing the NEQS permissible limits, indicating potential contamination issues. The highest mean concentrations of Ni and Mn in the surface water of all the locations might be due to battery waste, electronic devices, demolition waste, and ghee wrappers disposed of in the dumping site along with MSW [53].
The observed mean concentrations of Cd, Mn, and Pb in the MSW disposal site surface water were found to be higher than 0.004-0.010 mg L-1, 0.130-0.240 mg L-1, and 0.032-0.044 mg L-1, respectively, as reported by [54]. Furthermore, the mean concentrations of Pb (0.38-0.58 mg L-1) and Mn (9.40-19.41) as reported by [55] were found to be higher than the concentrations reported by this study at all the MSW disposal sites, except the Pb mean concentration found at the Bannu MSW disposal site. Overall, the PTE mean concentrations were in order of Ni>Mn>Pb>Cd>Cu in the selected MSW disposal sites.
Table 1.
Input parameters for calculating average daily dose (ADD) values.
| Exposure parameters | Symbols | Units | Value |
|---|---|---|---|
| Ingestion rate | IR | L/day | 2.3 |
| Average time | AT | years | 67.9 |
| Exposure duration | ED | years | 67.9 |
| Exposure frequency | EF | days/year | 365 |
| Body weight | BW | kg | 69 |
Table 2.
Heavy metals with oral reference dose (RfD).
| Heavy metals | Oral RfD (mg/kg/day) |
|---|---|
| Cd | 0.000057 |
| Mn | 0.013 |
| Cu | 0.04 |
| Ni | 0.0022 |
| Pb | 0.00035 |
Table 3.
Physico-chemical and PTE mean and standard deviation (SD) values of surface water (leachate) of the selected dumpsites.
Heavy Metal Analysis of Groundwater
The results of groundwater samples collected from selected MSW disposal sites are summarized in Table 4. The pH values were 7.00-7.10 <7.05±0.26>, 6.87-7.30 <7.14±0.17> and 6.73-7.27 <6.98±0.12>. After that, the EC values were 243.33-1043.00 <667.19±122.76>, 420.70-1072.70 <684.15±128.78>, and 429.74-985.70 <675.03±113.07> μS/cm. Mn concentrations were 0.00-0.22 <0.01±0.00>, 0.51-0.69 <0.56±0.07> and 0.00-0.53 <0.06±0.00> mg L-1, while Ni concentrations were 0.78-4.34 <1.88±0.15>, 0.38-2.66 <0.52±0.07> and 0.31-2.66 <2.02±0.12> mg L-1 in Abbottabad, Bannu, and Peshawar across various groundwater samples, respectively. The mean pH values (7.05, 7.14, and 6.98) were within the acceptable pH range (6.5-8.5) specified by NEQS.
The observed fluctuation in pH values of groundwater may be due to the presence of humic acid that is produced during biological decomposition of organic waste [56]. This may also be due to the age of the MSW disposal sites, as the pH of the leachate that gets into water and soil increases with the age of the landfill [57]. The observed variations in the mean EC values of the groundwater might be due to leachate (surface water) percolation that usually contains high concentrations of dissolved ions, exhibiting quite low electrical resistivity, soil cation exchange capacity, soil texture, porosity, and permeability [56-58].
Mean concentrations of PTE were within NEQS and WHO limits, except for Ni (1.88, 0.52, and 2.02 mg L-1), which exceeded the NEQS and WHO limit of 0.02 mg L-1 in all samples. Similarly, Mn (0.56 mg L-1) exceeded the limit set by NEQS and WHO (0.5 mg L-1) in the groundwater samples collected from the Bannu MSW disposal site. Comparing the overall PTE mean concentrations found in both surface and groundwater revealed different contamination patterns. In surface water, higher concentrations of Mn (0.71±0.05, 0.85±0.08 and 0.57±0.03 mg L-1), Ni (2.41±0.17, 1.49±0.02 and 2.30±0.30 mg L-1), and Pb (0.08±0.01, 0.72±0.04 and 0.53±0.03 mg L-1) indicated noticeable pollution in Abbottabad, Bannu, and Peshawar dumpsites, respectively. In contrast, Cd was not reported in ground water while Mn (0.005±0.00, 0.56±0.07 and 0.06±0.00 mg L-1) and Ni (1.88±0.15, 0.52±0.07 and 0.52±0.12 mg L-1) depicted lower concentrations in the selected dumpsites of Abbottabad, Bannu and Peshawar, respectively as compare to PTE concentrations in surface water. Retention and leaching of PTE from soil into groundwater are affected by soil type and properties, pH and redox conditions, organic matter content, water flow, precipitation patterns, and PTE concentrations and chemical forms [59, 60]. Cadmium usually forms complexes with organic matter like humic acids, making it less available for leaching [61].
Table 4.
Physico-chemical and PTE mean and standard deviation (SD) values of groundwater of the selected dumpsites.
Furthermore, Cd can also replace other ions on soil exchange sites, retaining it in the soil. It can also precipitate as insoluble compounds like cadmium carbonate or hydroxide, which are quite stable in the soil, making it difficult for water to leach it out [62]. However, the mobility of Cd is higher than Pb but lower than that of Ni and Mn [63]. The higher mean concentrations of both Ni and Mn in groundwater of the selected MSW disposal sites might be due to their higher mobility and percolation as compared to other PTE [63-64]. The observed mean concentration of Mn (0.56 mg L-1) in Bannu MSW disposal sites groundwater was found to be lower than that of 7.70 mg L-1 as reported by [54], while the mean values of Ni observed in all selected MSW disposal sites groundwater were higher than the values reported by [54]. Overall, the PTE was found in order of Ni>Mn>Cu, Cd, and Pb.
Pearson’s Correlation Analysis
Pearson’s correlation analysis was used to identify relationships among the studied parameters and to evaluate common sources for PTE detected in groundwater samples. The correlation matrix (Fig. 2) displays the correlation between different parameters: pH, EC, Cd, Mn, Cu, Ni, and Pb. The pH was found to be negatively correlated with EC, indicating that as pH increases, EC tends to decrease and vice versa. Electrical conductivity was found to be moderately positively correlated with Ni concentrations. Ni showed a moderate negative correlation with Mn, indicating an inverse relationship in the groundwater of the MSW disposal sites. This inverse relationship may be due to differences in the PTE sources, i.e., different types of waste contain different concentrations of the metals; a particular type of waste material could primarily contribute Mn and not Ni, and vice versa, which leads to the development of an inverse relationship in observed concentrations in groundwater. In addition, this may also be due to soil type and properties, redox conditions, organic matter content, differences in complexation and precipitation mechanisms of the PTE in MSW disposal sites environments [59-63]. The correlation analysis indicated that the PTE concentrations are closely related to the presence of organic matter and other pollutants in the groundwater of MSW disposal sites [65].
Principal Component Analysis (PCA)
The environmental parameters (pH, EC, Mn, and Ni) measured in the MSW disposal sites’ groundwater, along with their respective principal components analysis results, are summarized in Table 5. Each site had two principal components (PC 1 and PC 2) derived from the parameters, with corresponding eigenvalues indicating the amount of variance explained by each PC. Percentages of variance and cumulative variance explained by PC 1 and PC 2 provided insights into the variance and patterns observed in environmental data across the sites. pH showed positive and negative loadings at all sites. In Abbottabad, pH depicts negative loading on PC 1 (-0.26) and positive loading on PC 2 (0.34). Bannu showed the strongest negative loading on PC 1 (-0.50) and minimal positive loading on PC 2 (0.07). Peshawar showed a negative loading on PC1 (-0.37) and a strong positive loading on PC2 (0.80).
Differences in pH values of groundwater of the MSW disposal sites indicated the presence of leachate, which resulted in a lowering of the pH due to organic acids and decomposition byproducts [51]. In PCA, pH negative loadings on PC 1 and positive loadings on PC 2 reflected varying degrees of leachate infiltration and local lethogenic effects. Next, at all sites, EC showed positive loadings on both PC 1 and PC 2, with varying magnitudes (Abbottabad: PC 1 = 0.70, PC 2 = 0.05; Bannu: PC 1 = 0.55, PC 2 = 0.14; Peshawar: PC 1) = 0.57, pc 2 = 0.28). High EC values of groundwater of the MSW disposal sites indicated high ionic concentrations of dissolved salts or pollutants [38]. Positive loadings on both PCAs indicated consistent effects of MSW disposal site leachates on groundwater salinity, influenced by MSW disposal site leachate composition and surrounding soil properties.
Furthermore, Mn showed consistent loadings across PCs at all sites, indicating common geological sources (negative loading on PC 1, positive on PC 2). Nickel also showed stable positive loads on both PCs. These PTE often originate from industrial waste, batteries or electronic equipment, and empty ghee wrappers found in the MSW disposal sites [66]. The PCA loadings revealed its presence in groundwater, with consistent positive loadings indicating continued contamination from MSW disposal site runoff or leachate seepage.
Groundwater Pollution Assessment
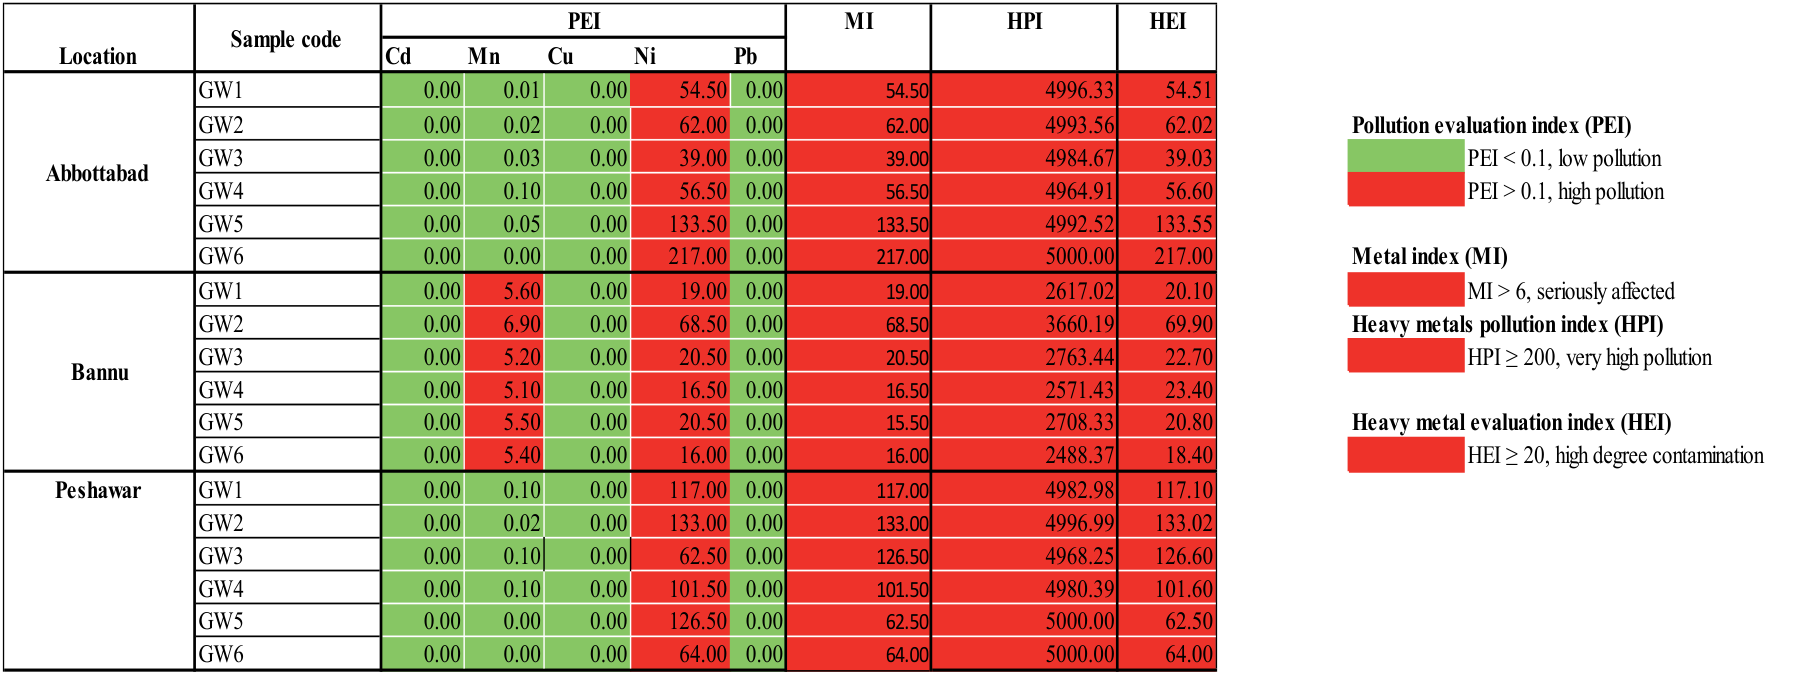
Both single-metal-based and overall PTE pollution assessments of the groundwater of the selected MSW disposal sites are shown in Fig. 3. The PEI values of all selected PTE were <0.1 (PEI ˂ 0.1), indicating low pollution, except Mn and Ni. The PEI values of Mn contamination of groundwater of Abbottabad and Peshawar MSW disposal sites were <0.1, indicating low pollution, while at Bannu MSW disposal site, it was >0.1 (PEI ≥ 0.1), indicating a very high level of pollution. Next, the PEI values of Ni were found to be >0.1, showing very high pollution of the said metal in the groundwater of all the selected MSW disposal sites [41].
According to the MI values, all the selected MSW disposal sites were seriously polluted with PTE, as all the MI values were found ˃6 [43]. The HPI values were found to be >200 (HPI ≥ 200, very high pollution), indicating the overall pollution status of the groundwater of the selected MSW disposal sites. It was concluded that PI values (PI ≥ 100) of Mn and Ni indicated very high pollution at individual levels, while collectively, based on HPI values (HPI ≥ 200), the groundwater at all the selected MSW disposal sites was found highly polluted [44, 45]. The HEI values were also found to be higher than 20, indicating an overall high degree of contamination of the groundwater of all study areas [47].
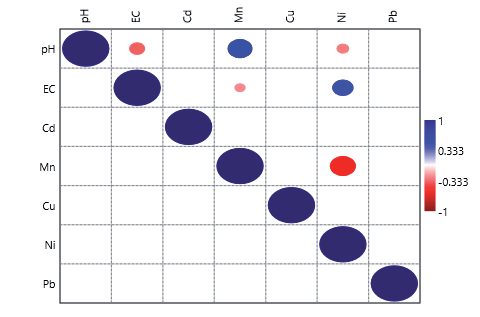
Table 5.
Principal component analysis of MSW disposal sites groundwater of the selected urban areas.
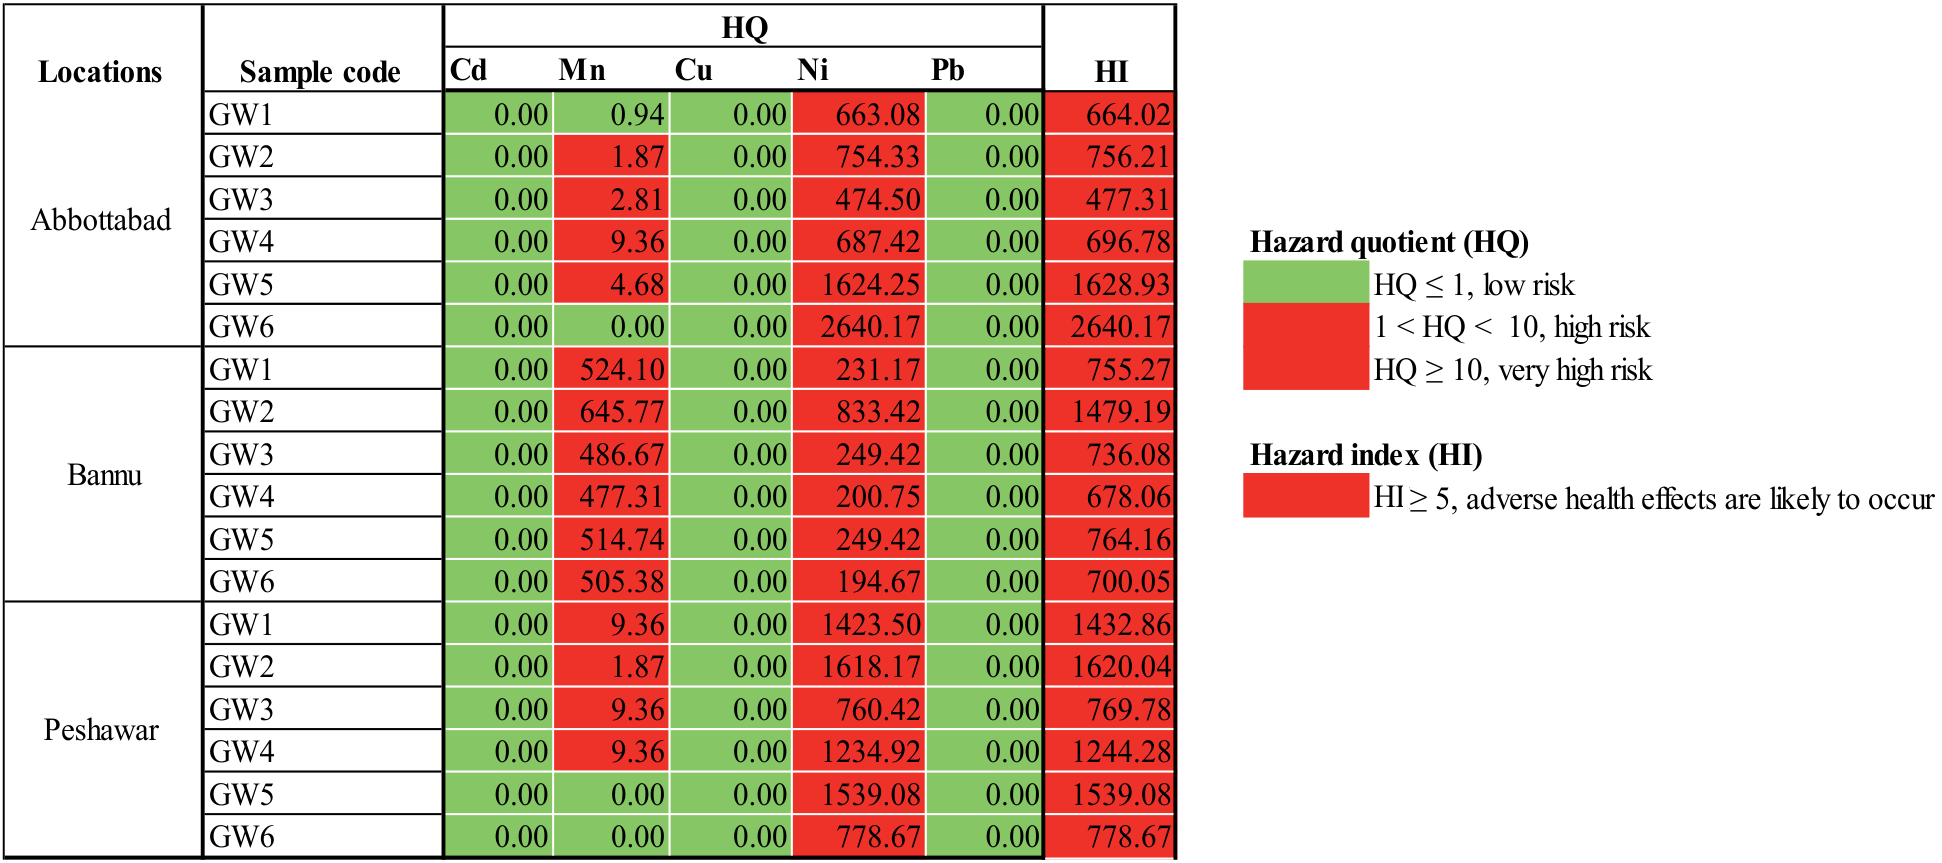
The ADD values for collected groundwater samples were calculated by using the input parameter values given in Table 1. The HQ values for individual PTE were calculated by dividing the ADD values by RfD values (as given in Table 2). Cd, Cu, and Pb showed low health risk (HQ ≤ 1). At the same time, Mn and Ni showed high and very high risk (HQ ˂ 10 and HQ ≥ 10) at almost all samples collected from groundwater sources at the selected MSW disposal sites of Abbottabad, Bannu, and Peshawar (Fig. 4). Whereas the HI values (HI ≥ 5) of all samples collected from the selected MSW disposal sites indicated adverse health effects likely to occur in all selected MSW disposal sites (Fig. 4). It was concluded from the HQ and HI calculated values that the groundwater of all the MSW disposal sites was highly polluted with Ni, thus posing a high risk of adverse health effects occurring in the selected urban MSW disposal sites.
Although the differences in Mn (0.005±0.00, 0.56±0.07 and 0.06±0.00 mg L-1) and Ni (1.88±0.15, 0.52±0.07 and 0.52±0.12 mg L-1) concentrations suggested spatial variability in contamination, potentially due to waste composition and heterogeneity of leachate along with different environmental conditions, the mean values of Mn ranged from <0.005±0.00> to <0.56±0.07> mg L-1, indicating very low and consistent levels in the collected samples, though the near-zero concentration values might reflect limitations in detection procedure. Further, the Ni concentration values indicated higher variability mean values ranged from <0.52±0.12> to <1.88±0.15> mg L-1), suggesting moderate measurement uncertainty. The sources of these existing uncertainties might be due to sampling methods, including depth, time, and site location, along with the instrument’s detection limits, as well as potential interference from other pollutants in the groundwater.
Fig. 3.
Summarized presentation of all the calculated PTE indices for evaluation of groundwater quality of all the selected MSW disposal sites.
As the urbanization correlates directly with a surge in MSW generation [68]. According to the 2017 census report of Pakistan, the urban population was recorded as 293,985, 49,948, and 1,969,823 with an average population annual growth rate of 3.32, 0.24, and 3.72 in Abbottabad, Bannu, and Peshawar, respectively [69]. This annual increase in the communities surrounding dumpsites not only amplifies the health risks associated with inadequate waste management but also emphasizes the necessity for developing sustainability assessment criteria when choosing MSW management technologies [23]. Moreover, addressing the issue of illegal MSW dumping demands innovative solutions, such as employing artificial intelligence (AI) techniques like deep learning for enhanced detection capabilities and effective management of MSW [70-72].
Conclusions and Recommendations
The selected MSW disposal sites receive mixed waste (household, market, industrial), undergoing physicochemical and biological transformation upon dumping. This generates a thick, semiliquid byproduct (leachate) containing PTE, impacting surface and groundwater. Fluctuations in pH, EC, and PTE concentrations (Cd, Mn, Cu, Ni, Pb) were observed in both surface and groundwater due to MSW composition and environmental conditions at MSW disposal sites. Surface water pH was within permissible limits, but Mn, Ni, and Pb exceeded NEQS limits. Groundwater pH and EC were within the permissible limits; however, Mn and Ni concentrations exceeded the NEQS limits. MI values indicated serious PTE pollution (MI > 6), with HPI values (>200, very high pollution) confirming overall groundwater pollution. HQ values showed l ow health risk (HQ ≤ 1) for Cd, Cu, Pb, and very high risk (HQ ≥ 10) for Mn and Pb in groundwater samples. HI values (HI ≥ 5) suggested potential adverse health effects at all MSW disposal sites, emphasizing the need for MSW segregation and leachate treatment to mitigate PTE pollution. Untreated leachates pose significant environmental and public health risks in the surrounding areas dependent on these water resources. For effective PTE removal, technologies, e.g., kinetic degradation fluxion (KDF) filters for drinking water, may be considered for MSW disposal sites’ communities as a short-term mitigation strategy. Furthermore, in order to minimize the health risks, long-term mitigation strategy such as disposal of MSW in the MSW disposal sites should be discouraged, with a way forward to shift the existing waste to purpose-built landfills, followed by a comprehensive point source segregation and recycling program in the selected urban setups to ensure environmental sustainability and protect community health.

