

Introduction
The river ecological flow pertains to the quantity and process of water that must be retained within rivers, lakes, and marshes for the purpose of safeguarding the ecological environment. The ecological flow constitutes the river flow necessary to sustain the survival and biodiversity of aquatic organisms within the river, as well as to prevent sediment deposition, water pollution, seawater intrusion, river desiccation, and lake atrophy [1, 2]. The ecological base flow of rivers is hard to guarantee, and both the river ecological chain and species diversity have been severely damaged in recent years against the backdrop of climate change and increasing human activities (water conservancy project construction, soil and water conservation, agricultural practices, etc.) [3]. Consequently, the lower guarantee rates of river ecological flow have given rise to a multitude of ecological and environmental issues, such as water quality degradation, river cessation, reduced vegetation on riverbanks, and decreased biodiversity of phytoplankton and fish communities [4-6]. The inappropriate utilization of water resources has given rise to a situation where the river flow is unable to fulfill the requirements of ecological sustainable development. A scientifically and rationally defined ecological flow constitutes the prerequisite or foundation for comprehensive water resources management and the restoration of river ecosystems. Consequently, the research on river ecological flow has garnered extensive attention [7, 8].
Currently, the number of methods for calculating river ecological flow exceeds 200. The research approaches for river ecological flow mainly consist of hydrological methods (such as the Tennant method [9], the Texas method [10], the 7Q10 method [11], the Normalized Grouped Percentile Runoff Procedure method (NGPRP) [12], and the basic flow method, etc.), hydraulic methods (such as the Wetted Perimeter Method [13] and the R2CROSS Method [14]), habitat methods (such as the Instream Flow Incremental Methodology (IFIM) [15] and the Computer Aided Simulation Model for In-stream Flow Regulations (CASIMIR) [16]), and comprehensive methods (such as the Building Block Methodology (BBM) [17] and the holistic evaluation method) owing to the diversity and complexity of water resources systems. The hydraulic method includes the Wetted Perimeter Method and the R2-CROSS method. For example, the wet perimeter method can determine the minimum environmental flow of a river, but it requires a large amount of field measurement data and cannot reflect the seasonal changes of the river [13]. Although the habitat method encompasses the ecological connections between target species and flow processes, it is prohibitively costly. The comprehensive method approach demands considering the relationship between ecosystems and flow processes, yet it entails the integration of multidisciplinary knowledge and has high data requirements. The hydrological method is prevalently employed in ecological flow research due to the scarcity of hydraulic and hydrological data of rivers. These methods encompass the Tennant method, the Normalized Grouped Percentile Runoff Procedure method (NGPRP), the Copula-based Flow Duration Curves (CFDC) method, and others. These methods require only historical hydrological data, thereby obviating the need for field measurements, and are computationally straightforward. For example, Yang et al. [18] used the modified Tennant method to estimate the ecological runoff of the Irtysh River. Dong et al. [19] applied the monthly guarantee rate method to estimate the ecological water requirement of typical areas in the Huai-he River Basin. Nevertheless, the outcomes of traditional hydrological research often fail to accurately represent the natural hydrological processes of rivers, particularly when there are notable disparities between intra-annual and inter-annual circumstances. Long et al. [20] incorporated Copula functions into the model for the combination and allocation of streamflow in various seasons at the watershed scale, and the resulting model constructed a hydrological process that was capable of reflecting the interannual and intra-annual variability of streamflow in the watershed. The Copula-based Flow Duration Curves (CFDC) method calculates ecological flow by taking into account the inter-annual and intra-annual variations in hydrological processes and the “cross-phenomena” of monthly inflow types. The results are anticipated to accurately reflect the ecological water requirements of rivers in different years with diverse inflow types. In reality, the correlations among hydrological variables encompass linear and non-linear correlations; the marginal distribution of hydrological variables may adhere to a normal distribution or a skewed one. Consequently, constructing multivariate joint probability distributions under nonlinear and non-normal conditions poses a considerable challenge. The Copula functions have achieved substantial breakthroughs in the theory and methods for constructing multivariate joint distributions. This function is capable of segregating the edge distribution and correlation structure for study, has no constraints on the type of edge distribution, and is able to depict the nonlinear and non-symmetric correlation relationships among variables [21]. The Copula functions have been attested to be an efficacious tool for constructing multivariate joint distributions and addressing multivariate issues, featuring good applicability and irreplaceability, and have been widely applied in the field of hydrology and water resources in recent decades. For instance, the Copula functions have been utilized in the multivariate frequency analysis of hydrological events [22], the combination analysis of hydrological events [23], and the hydrological stochastic simulation [24].
The Dawen River is the largest tributary of the lower Yellow River and the only input river to Dongping Lake of the South-to-North Water Diversion Project. The inter-annual and intra-annual variations of precipitation in the Dawen River are quite dramatic, and there are instances of consecutive years of abundant water and consecutive years of drought. Consequently, the hydrological process of the Dawen River demonstrates considerable intra-annual and inter-annual variations. The river flow and environmental capacity have decreased sharply, and the river ecological environment has been severely damaged, which is caused by economic development, urbanization construction, increased water use, and the discharge of pollutants into the river. The inter-annual and intra-annual precipitation distribution of the Dawen River is uneven both spatially and temporally. Meanwhile, large-scale human activities have led to a relatively low guarantee of ecological flow for the Dawen River, and the health of the river is severely threatened [25, 26]. Considering the seasonal variation characteristics of the hydrological process of the Dawen River, 1) The paper calculates the ecological flow process of the Dawen River basin for the different annual inflow types and the different monthly inflow types by introducing the combined distribution function (Copula) to determine the joint distribution probability of the inter-annual and intra-annual variations of streamflow based on the natural streamflow data from three hydrological stations on the BeiWang, Loude’, and Dai’cun Dams. 2) The suitability of the ecological flow process is evaluated by employing a set of indicators, namely accuracy rate, fulfillment rate, suitability, and comprehensive index. This study provides a scientific basis for determining the ecological flow of rivers characterized by variable hydrological processes.
Study Area
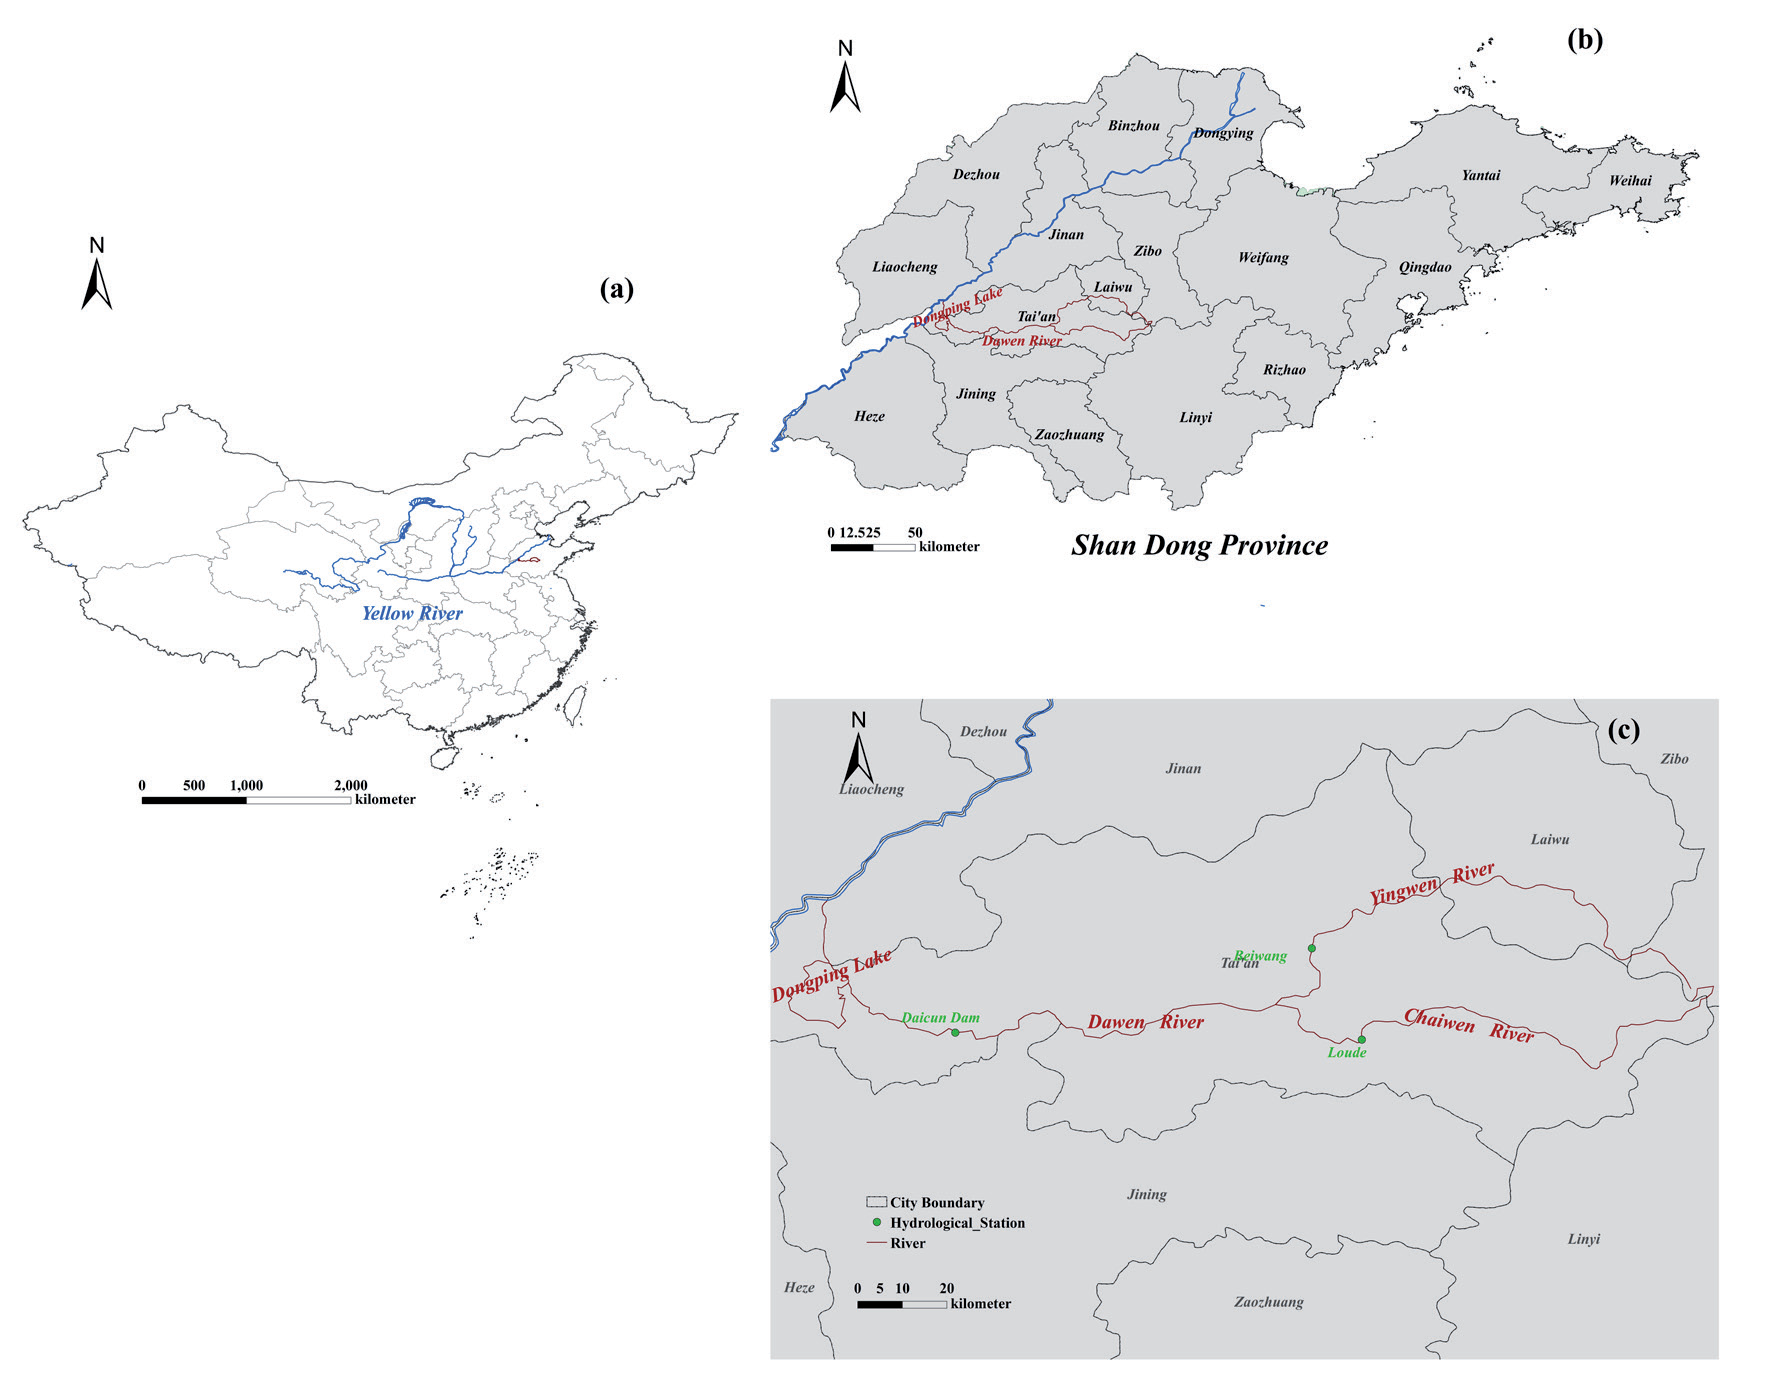
The Dawen River is the main tributary of the lower Yellow River, which is located at 35.7°–36.6°E and 116°–118° N, has a length of 292km and covers a total control basin area of 8944 Km2 (Fig. 1(a)). The upper reaches of the Dawen River are composed of two major tributaries, namely the Yingwen River and the Chaiwen River. The water flow direction is from east to west, entering Dongping Lake and subsequently flowing into the Yellow River via the Xiaoqing River (Fig. 1(b)). The region is characterized by a warm temperate, semi-humid, continental monsoon climate, with an annual average temperature of 13°C. The average annual precipitation of the Dawen River amounts to 708.9 mm, predominantly concentrated from July to September. The inter-annual and intra-annual variations of precipitation are rather intense, and there have been continuous periods of flood and drought. To determine the ecological flow of the Dawen River, the paper chose three typical hydrological stations at the river’s typical assessment sections, namely Beiwang Station, Loude Station, and Daicun Dam Station (Fig. 1(c)).
Materials and Methods
Data Acquisition and Processing Methods
In this paper, the ecological flow of the Dawen River is calculated based on the natural streamflow from 1960 to 2016 at the three hydrological stations of Beiwang, Loude, and Daicun Dam, using the Flow Duration Curves (FDC) method corrected by various Copula functions. The paper establishes an ecological flow evaluation system with suitable ecological flow accuracy rate, satisfaction rate, suitability, and comprehensive index as indicators based on hydrological data, such as the rate of change of river flow, occurrence time, and extreme flow. The suitability of the ecological flow calculated by the FDC method corrected by the COUPLA function is also evaluated.
The Copula-based Flow Duration Curves (CFDC) Method
This method is an improved hydrological method. It scientifically calculates the ecological flow process of different inflow types in a river based on the theory of the FDC method, considering the inter-annual and intra-annual variations of streamflow [21, 27].
The calculation steps are as follows:
Step 1: Ecological flow calculation based on the traditional FDC method (Q90%).
Firstly, the annual and monthly average streamflows at each hydrological station are calculated from a long series of monthly streamflow data. Then, the P-Ⅲ type hydrological frequency distribution curve was selected to conduct hydrological frequency analysis on the above annual and monthly average runoff series. Its calculation formula is shown in (1):
Where Γ(α) is the gamma function of the parameter α; the parameters α, β and a0 represent the shape, size, and position of the P-III distribution curve, respectively.
The annual average streamflow corresponding to the hydrological frequency of 25% and 75% and the monthly average streamflow corresponding to the hydrological frequency of 25% and 75% are selected as the boundary between the annual and monthly inflow types of the above two groups of streamflow series, according to the results of the hydrological frequency distribution curve.
Step 2: The probability weight of each monthly inflow type under different annual inflow types
The Copula function is a flexible tool for constructing a multivariate joint distribution, which can completely retain the correlation information between variables, and has widespread applications in hydrological analysis and calculation [28]. At present, the Copula function shows good applicability and irreplaceable advantages in the encounter combination analysis of hydrological events [29]. The basic form of the two-dimensional Copula function is shown in (2):
Where H(u, v) is the variable, u, v is the two-dimensional joint distribution function, F1(x) and F2(x) are the marginal distribution functions, and C(F1(x), F2(x)) is the two-dimensional Copula function.
There are many kinds of Copula functions. This paper selects the Clayton, Frank, and Gumbel functions of the Archimedean Copula function family and the Gaussian and t-Student functions of the elliptic Copula function family, with reference to relevant research (3-7) [30]. When a Copula function is used to establish the joint probability distribution of annual and monthly inflow types (there are five joint distributions of annual and monthly water types in each month), the parameters of each Copula function need to be calculated first. There are two main types of calculation methods: the correlation index method and the maximum likelihood method [31]. In this paper, the correlation index method is used to calculate the parameters of the Archimedean Copula function, and the maximum likelihood method is used to calculate the parameters of the elliptical Copula function according to the characteristics of the above two types of coupled functions. According to the calculated parameter values, the expressions of the above Copula functions are obtained, and then the joint distribution of monthly inflow type and annual inflow type is constructed. There are five joint distribution functions in each month.
Clayton
Frank
Gumbel
Gaussion
t-Student
The inverse function of the standard normal distribution is denoted as φ–1; ρ represents the correlation coefficient; tκ–1 is the inverse function of the univariate t-distribution with κ degrees of freedom; s = Tκ–1(u); t = Tκ–1(x2); u and v are bivariate random variables.
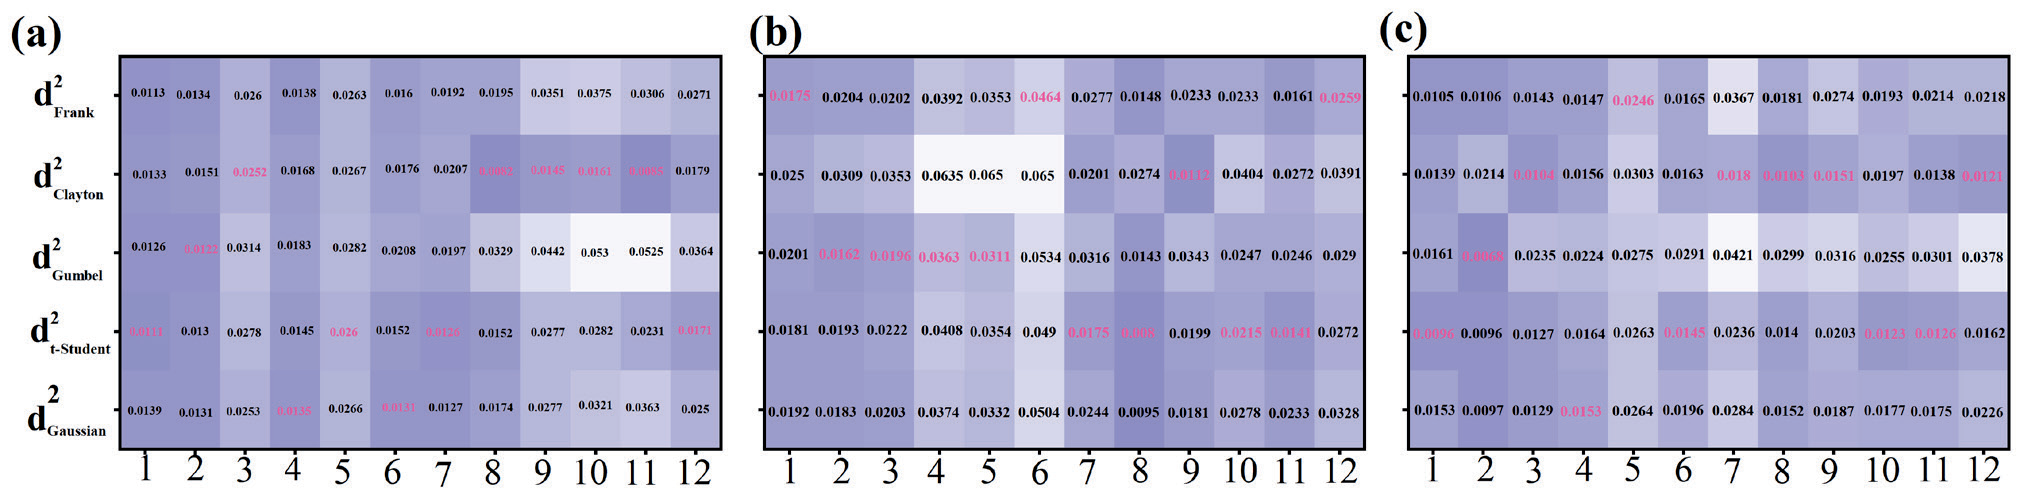
The Euclidean square distance between the estimated Copula function model value and the empirical Copula function value is calculated, and the binary empirical Copula function is used as a reference. The smaller the Euclidean square distance d2 (Formula 8) is, the better the fitting effect of the selected Copula model, and the better the selected model can reflect the correlation structure between random variables.
The Euclidean square distance formula is as follows:
Where W represents the estimated Copula function type, ui and vi represent the values of the edge distribution functions.
Once the Copula function for annual and monthly inflow types is determined, the joint distribution probabilities for different annual inflow types and monthly inflow types are first computed. Subsequently, the conditional probabilities of monthly inflow types (wet, normal, and dry) under different annual inflow types can be calculated using Equation (9).
Where i represents the month, with its value ranging from 1 to 12; j represents the monthly inflow type, with j = 1, 2, 3 representing the wet month, the normal month, and the dry month, respectively; k represents the annual inflow type, with k = 1, 2, 3 representing the wet year, the normal year, and the dry year, respectively; P(Bk) represents the probability of the k type of annual inflow; P(AijBk) represents the joint probability distribution of the j type of monthly inflow and the k type of annual inflow in the i month; P(Aij|Bk) represents the conditional probability of the j type of monthly inflow in the i month under the k type of annual inflow.
Step 3: Ecological Flow Process Analysis Based on the Copula Function for FDC
The conditional probabilities of different monthly inflows under various annual inflow types, calculated as described above, are used as probability weights. These weights are then incorporated into Equation (10) to determine the final ecological flow process for the wet year, the normal year, and the dry year.
The ecological flow Qik for month i under the annual inflow type k and the characteristic flow values Qi1,90%, Qi2,90%, Qi3,90% at the 90% cumulative frequency of flow duration curves for wet, normal, and dry inflow types in the month i are defined.
Ecological Flow Suitability Evaluation Method
With reference to the relevant technical documents on ecological flow suitability evaluation issued by the Ministry of Water Resources, the paper formulates an evaluation system taking accuracy rate, satisfaction rate, suitability, and comprehensive index as indicators, based on hydrological indicators like flow rate variation, occurrence time, and extreme flow of rivers. The ecological flow determined by the Copula-based Flow Duration Curves (CFDC) method was evaluated for suitability.
(1) Accuracy: Accuracy is one of the indicators reflecting the deviation between suitable ecological flow and natural streamflow. The calculation formula is:
The accuracy Pj of the suitable ecological flow for the j month is defined by the ecological flow Qzj (m³/s) and the median monthly flow Qzj (m³/s) during the corresponding period, where j denotes the cyclic timing parameter.
The closer the suitable ecological flow is to the natural flow, the more reasonable it is, meaning that the ratio between the two should be closer to 1.
(2) Fulfillment Rate [32]: The fulfillment rate is an indicator that reflects how well the suitable ecological flow is met. The calculation formula is:
The fulfillment rate Mj of suitable ecological flow in the month j is calculated as the ratio of days Dij meeting the ecological flow requirement to total days Dj in that month, where Dij counts days in the year i and the month j with observed flow Qijk (m³/s)≥suitable ecological flow Qej (m³/s), indicating higher fulfillment with more compliant days.
(3) Suitability [33]: Suitability is one of the indicators that reflects the degree of dispersion between the suitable ecological flow and the natural flow.
The dispersion degree Sj and suitability Sj' of the suitable ecological flow for month j are defined with reference to the characteristic flow values Qsj and Qsj' (m³/s) respectively, where Qej and Qj (m³/s) denote the monthly suitable ecological flow and natural flow, and Qsj is set equal to Qj in this study
When the suitable ecological flow equals the natural flow, the suitability Sj = 1.
(4) Comprehensive Index: To provide a comprehensive evaluation of the applicability of different calculation methods in the study area, a geometric mean method is used to integrate the ecological flow accuracy, fulfillment rate, and suitability. The calculation formula is:
Since the accuracy, fulfillment rate, and suitability of the suitable ecological flow are more favorable when they approach 1, this indicates that the calculated suitable ecological flow is closer to the river’s natural inflow. In other words, when the comprehensive index (Zj) approaches 1, the suitable ecological flow is more beneficial to the river’s health. The comprehensive index (Zj) reflects how well the suitable ecological flow meets the natural flow and validates the reasonableness of the ecological flow settings. Therefore, based on the value of Zj, five levels of river health are defined [33], as shown in Table 1.
Results and Discussion
The Ecological Flow Determined by the Copula-based Flow Duration Curves (CFDC) Method
(1) The ecological flow (Q90%) of Dawen River in different annual inflow types was calculated based on the FDC method
The annual average streamflow of the three hydrological stations, namely Beiwang, Loude, and Daicun, is shown in Fig. 2. The natural streamflow during the flood season (July-September) accounts for 80%, while the natural streamflow during the non-flood season accounts for about 20% in the Dawen River. The extremely uneven distribution of the natural monthly average streamflow in the Dawen River reflects the seasonal hydrological variability of the river. This is associated with the climatic and geographical conditions of the region. The river is located at the southern end of Mount Tai and is a typical heavy rainfall center in northern China, with 80% of the precipitation concentrated in the Summer [34].
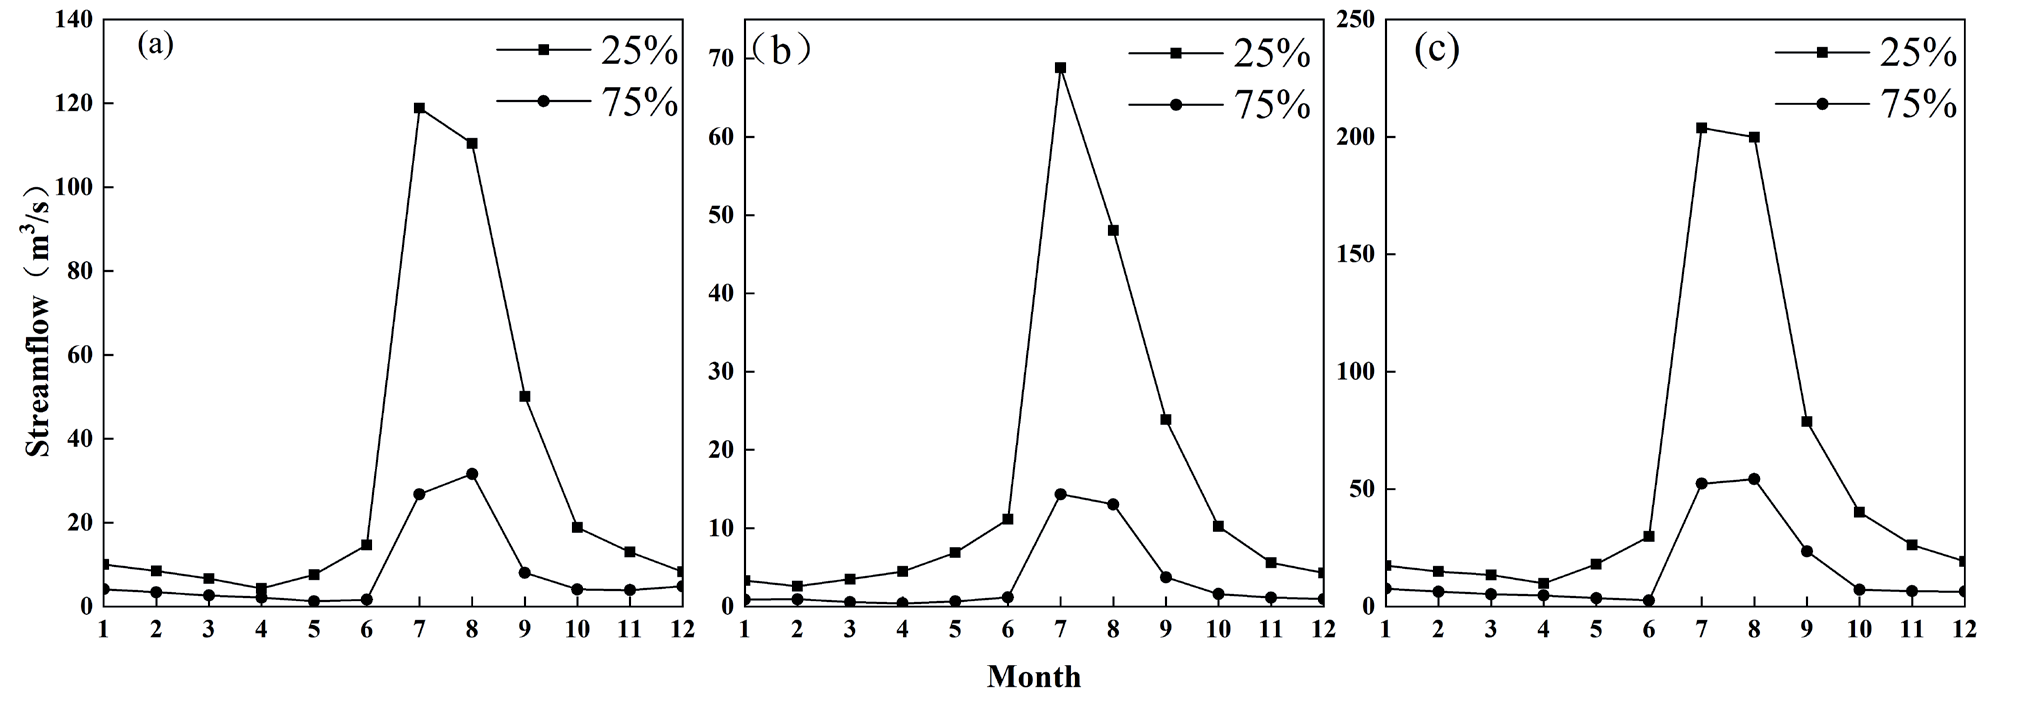
The annual and monthly natural streamflows corresponding to 25% and 75% hydrological frequencies at the three hydrological stations of Beiwang, Loude, and Daicun Dam are determined by analyzing the P-Ⅲ hydrological frequency distribution curve (Fig. 3). The monthly average natural streamflow with a hydrologic frequency of 25% is 2 to 10 times that with a hydrologic frequency of 75%, and the disparity is most pronounced during the flood season. The annual average natural streamflow at the Beiwang hydrological station with hydrologic frequencies of 25% and 75% is 30.19 m3/s and 12.01 m3/s, respectively. The annual average natural streamflow at the Loude hydrological station with hydrologic frequencies of 25% and 75% is 116.76 m3/s and 5.72 m3/s, respectively. The annual average natural streamflow at the Daicun hydrological station with hydrologic frequencies of 25% and 75% is 55.35 m3/s and 22.31 m3/s, respectively. The annual natural streamflow with a hydrologic frequency of 25% is 2 to 23 times that with a hydrologic frequency of 75%. Therefore, the hydrological process of the Dawen River exhibits significant inter-annual and intra-annual variability. In the paper, the annual natural streamflow with hydrologic frequencies of 25% and 75% is used as the dividing line for the annual inflow types (wet, normal, dry). The monthly natural streamflow with hydrologic frequencies of 25% and 75% is used as the dividing line for the monthly inflow types (wet, normal, dry).
The ecological flow is determined by the cumulative 90% streamflow rate within the monthly flow duration curves at the different annual inflow types (Fig. 4). The variation process of ecological flow under different annual inflow types is fundamentally consistent, all reaching the peak in July. The ecological flow during the flood season is conspicuously higher than that in the non-flood season, and the monthly average ecological flow during the flood season is approximately 2-10 times that of the non-flood season. For example, in the wet year, the average ecological flow of Daicun Dam (Fig. 4) during the flood season is 7.58 times that of the non-flood season. In the normal year, the average ecological flow during the flood season is 8.25 times that of the non-flood season. In the dry year, the average ecological flow during the flood season is 4.68 times that of the non-flood season.
Table 1.
Evaluation Standards for River Health Levels Based on Suitable Ecological Flow Grades.
| Comprehensive Index | 1≤Zj <0.2 | 0.2≤Zj <0.4 | 0.4≤Zj <0.6 | 0.6≤Zj <0.8 | 0.8≤Zj ≤1 |
|---|---|---|---|---|---|
| River Health Level | Extremely Poor | Poor | Moderately good | Good | Excellent |
Fig. 2.
The natural monthly average streamflow of Beiwang hydrological station a), Loude hydrological station b), and Daicun Dam hydrological station c) in the Dawen River from 1956 to 2016.
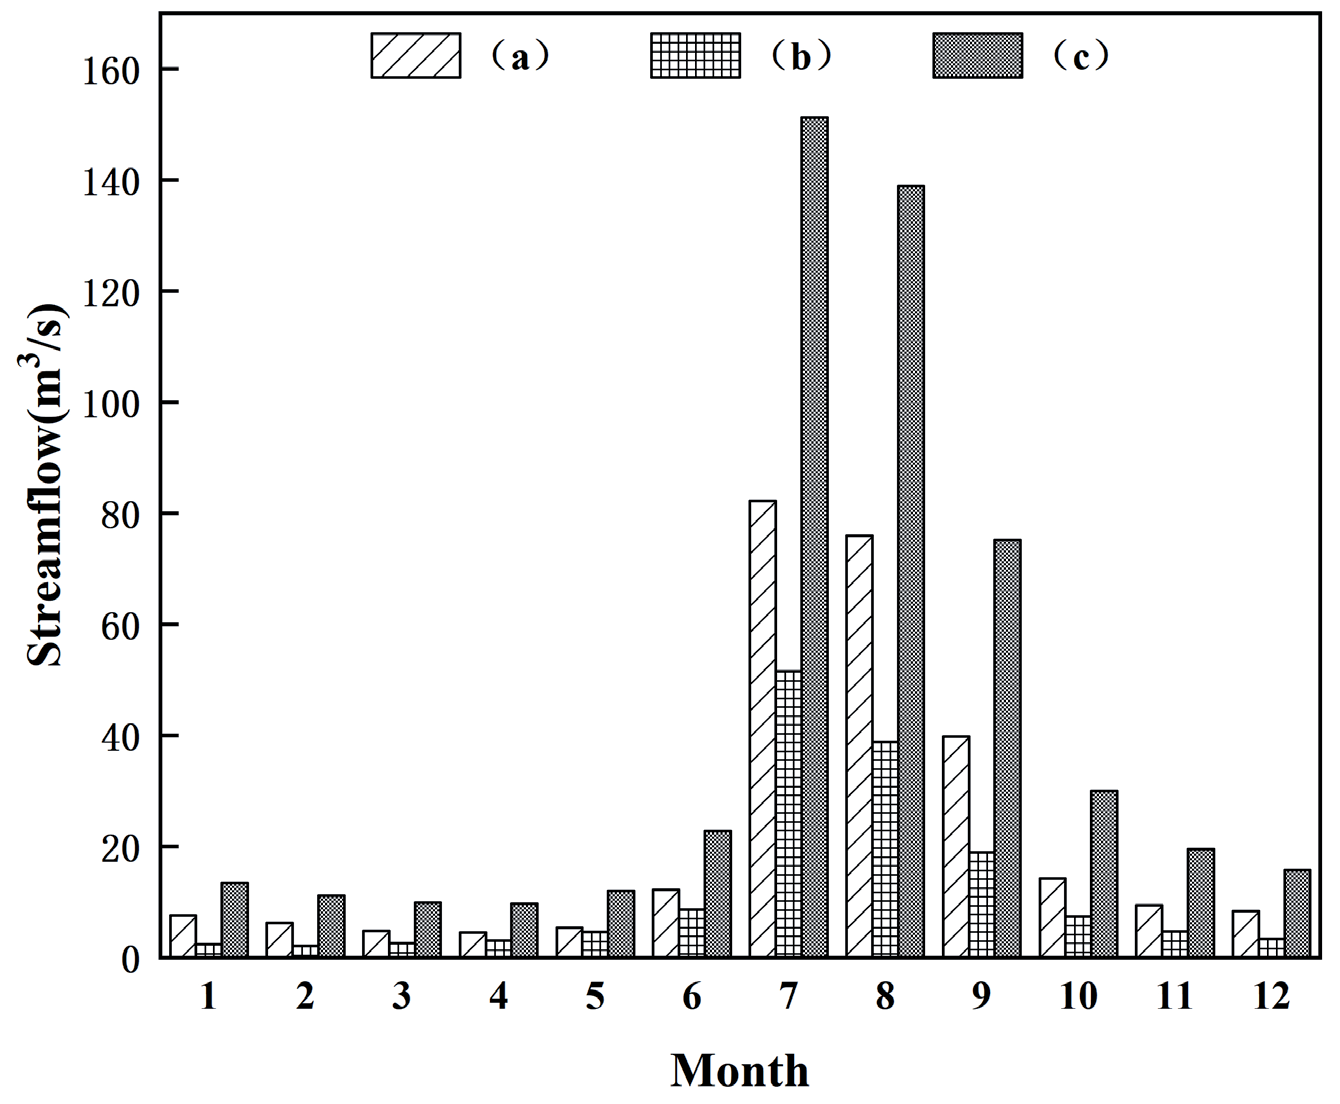
Fig. 3.
The average monthly streamflow with hydrological frequency of 25% and 75% at the Beiwang hydrological station a), the Loude Hydrological Station b), and the Daicun Dam hydrological station c).
There are significant differences in ecological flow among different annual inflow types, in the order of wet year, normal year, and dry year. For instance, the Beiwang hydrological Station (Fig. 4a) has ecological flows of 137.90 m3/s, 35.13 m3/s, and 3.33 m3/s in July during a wet year, a normal year, and a dry year, respectively. The ecological flows in the wet and normal years are, respectively, 41 times and 10 times that of the dry year in July. The Loude hydrological Station (Fig. 4b) has ecological flows of 87.57 m3/s, 19.12 m3/s, and 1.43 m3/s in July during a wet year, a normal year, and a dry year, respectively. The ecological flows in the wet and normal years are, respectively, 61times and 13 times that of the dry year in July. The Daicun Dam hydrological Station (Fig. 4c) has ecological flows of 215.61 m3/s, 71.22 m3/s, and 5.42 m3/s in July during a wet year, a normal year, and a dry year, respectively. The ecological flows in the wet and normal years are, respectively, 39 times and 21 times that of the dry year in July.
Fig. 4.
Ecological flow (Q90%) under different annual inflow types at Beiwang hydrological station a), Loude hydrological station b), and Daicun Dam hydrological station c) of Dawen River.
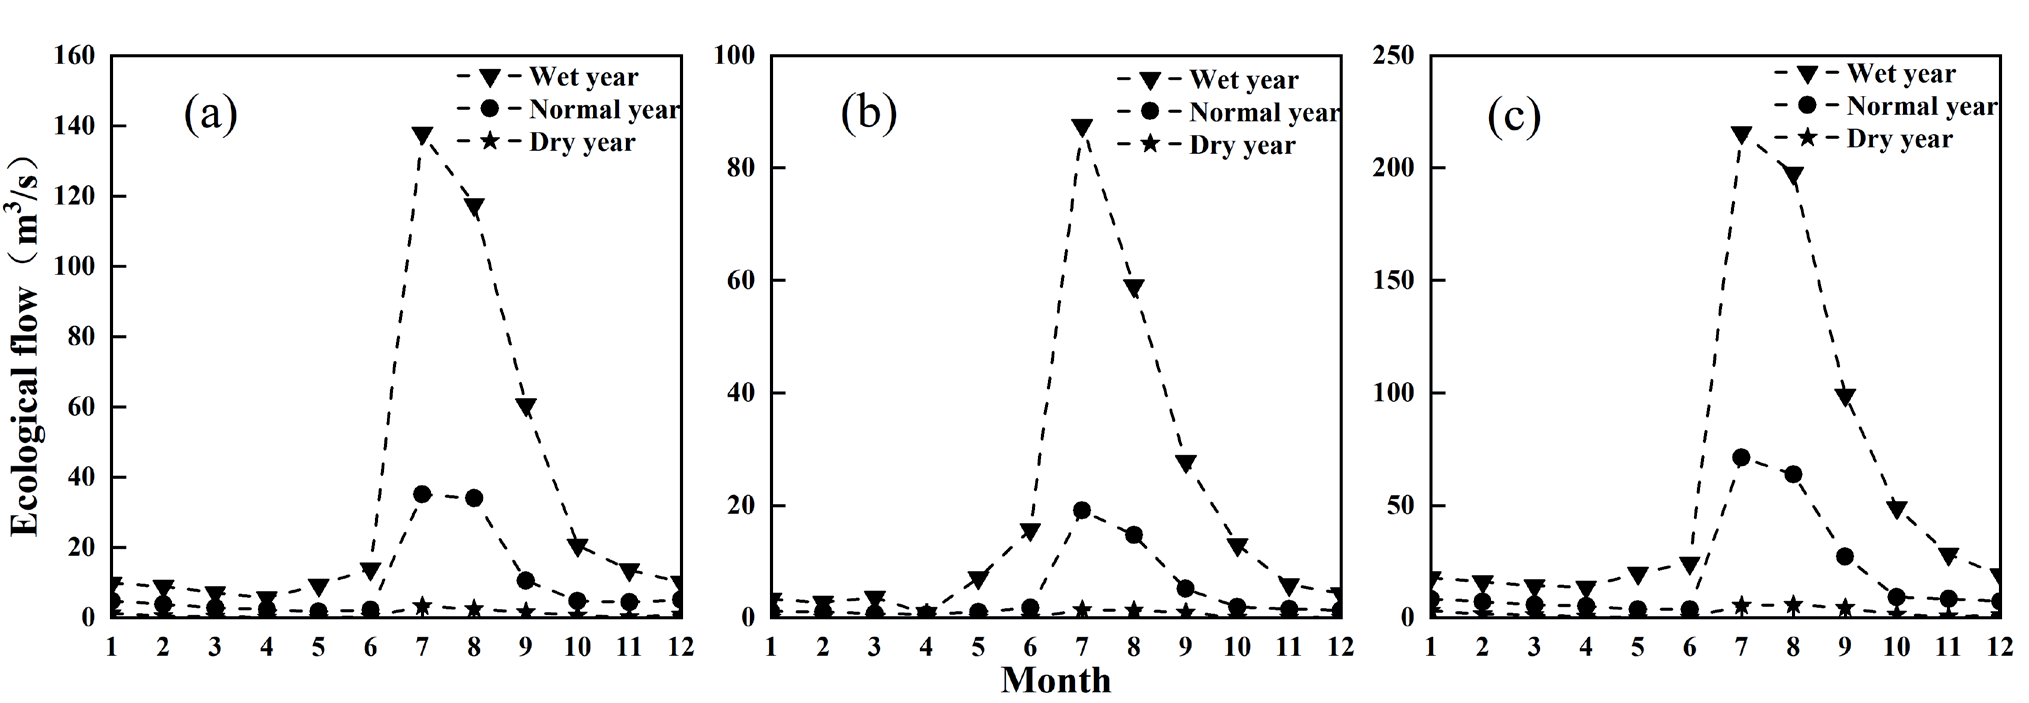
Fig. 5.
The Euclidean square distance of the joint distribution function at the hydrological stations of Beiwang a), Loude b), and Daicun Dam c).
The monthly inflow types of a seasonal river are not necessarily wet period but could also be normal or dry period in the wet year. Due to the influence of global extreme weather and human activities, the frequency of extreme droughts during wet years will keep increasing. Therefore, there is a certain “crossing” relationship between the annual and monthly inflow types, and the probability of flood and drought in different typical years is different for each month [35]. Consequently, the annual and monthly water types are not necessarily in synchrony. The traditional FDC method (Q90%) fails to comprehensively reflect the ecological flow process of seasonal rivers [36].
In this paper, the Euclidean squared distance between the Copula function model value and the empirical Copula function value was computed, and the results are presented in Fig. 5. Hence, the optimal joint distribution function of the hydrological station was determined by the smallest Euclidean squared distance, as indicated in Table 2. Subsequently, the joint distribution probability of the annual inflow types and monthly inflow types was determined, and then the conditional probability of each monthly inflow type being wet, normal, or dry under different annual inflow types was calculated in accordance with Formula 9, as depicted in Fig. 6.
At the Beiwang hydrological station (Fig. 6a). The Conditional probability of the monthly inflow types being wet and normal period is 80%-95%, while the conditional probability of it being dry is relatively low, accounting for only 5%-20% in the wet year, and the annual inflow types are in synchrony with the monthly inflow types during the flood season in the wet year. The Conditional probability of the monthly in-flow types being normal period is 50%-65%, while the conditional probability of the monthly inflow type being a wet period and a dry period are basically equal in the normal year, and the annual and monthly inflow types show a pronounced synchronicity at the whole year in the normal year. The Conditional probability of the monthly inflow types being a dry period is 20%-65%, while the conditional probability of the monthly inflow type being a normal period is 40%-70% in the dry year, and the annual inflow types are not in synchrony with the monthly inflow types during the flood season in the dry year.
Table 2.
Optimal joint distribution function of the annual inflow types and monthly inflow types at the Beiwang hydrological station, the Loude hydrological station, and the Daicun Dam hydrological station.
At the Loude hydrological station (Fig. 6b), The Conditional probability of the monthly inflow types being wet and normal period is 20%-65%, while the conditional probability of it being dry is relatively high, accounting for only 20%-65% in the wet year, and the annual inflow types are in synchrony with the monthly inflow types during the flood season in the wet year. The Conditional probability of the monthly inflow types being normal period is 50%-65%, while the conditional probability of the monthly inflow type being a wet period and a dry period are basically equal in the normal year, and the annual and monthly inflow types show a pronounced synchronicity at the whole year in the normal year. The Conditional probability of the monthly inflow types being a dry period is 25%-60%, while the conditional probability of the monthly inflow type being a normal period is 37%-60% in the dry year, and the annual inflow types are not in synchrony with the monthly inflow types during the flood season in the dry year.
At the Daicun Dam hydrological station (Fig. 6c), The Conditional probability of the monthly inflow types being wet and normal period is 90%-95%, while the conditional probability of it being dry is relatively low, accounting for only 5%-10% in the wet year, and the annual inflow types are in synchrony with the monthly inflow types during the flood season in the wet year. The Conditional probability of the monthly inflow types being normal period is 50%-65%, while the conditional probability of the monthly inflow type being a wet period and a dry period are basically equal in the normal year, and the annual and monthly inflow types show a pronounced synchronicity at the whole year in the normal year. The Conditional probability of the monthly inflow types being a dry period is 20%-65%, while the conditional probability of the monthly inflow type being a normal period is 40%-70% in the dry year, and the annual inflow types are not in synchrony with the monthly inflow types during the flood season in the dry year.
It is reasonable to analyze the joint distribution probability of abundant water, normal water, and scarce water based on the Copula function, especially suitable for quantifying the dependence relationship and compound risk of multistate hydrological events [37, 38]. The above results indicate that there is a “non-consistency” between the annual and monthly inflow types of the Dawen River, with high hydrological variation. This is basically consistent with the climatic variation conditions of the Dawen River [39, 40].
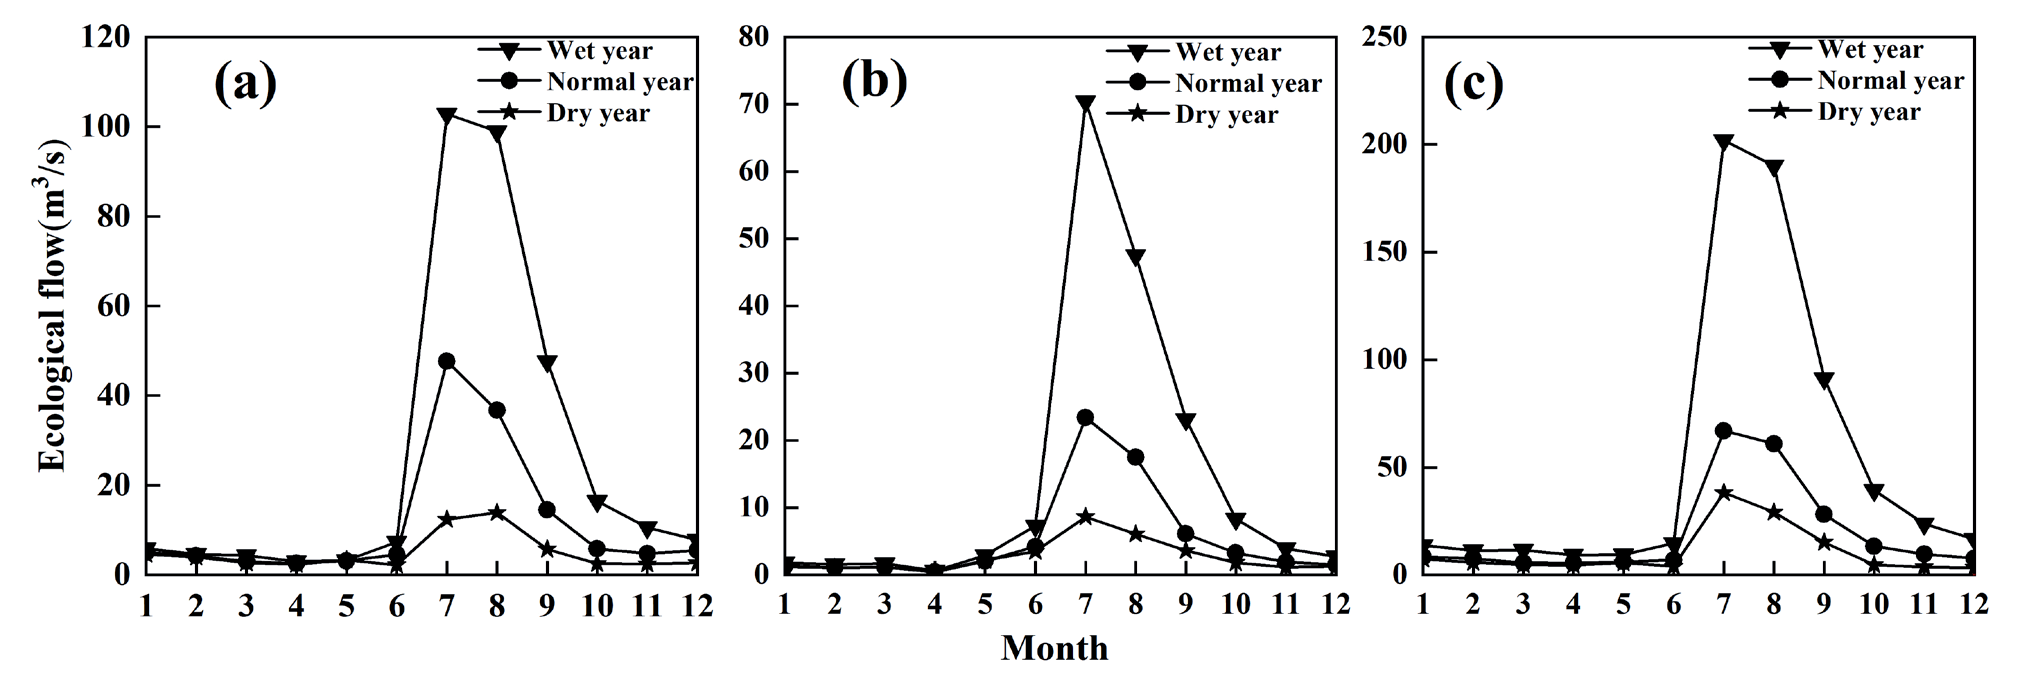
In the paper, the ecological flow process of the Dawen River is calculated using formula (1.4) based on the probability weight calculated by the coupla function and the ecological flow determined by the FDC method. The results are shown in Fig. 7. The ecological flow at the Beiwang Hydrological Station is 2.96-102.79 m3/s, 2.56-47.68 m3/s, and 2.20-13.90 m3/s in the wet year, the normal year, and the dry year, respectively, and the maximum and the minimum ecological flow occur in July and June (Fig. 7a). The ecological flow at the Loude Hydrological Station is 0.60-70.39 m3/s, 0.45-23.40 m3/s, and 0.51-8.65 m3/s in the wet year, the normal year, and the dry year, respectively, and the maximum and the minimum ecological flow occur in July and April (Fig. 7b). The ecological flow at the Daicun Dam Hydrological Station is 9.29~201.95 m3/s, 5.59~66.97 m3/s, and 4.49~38.17 m3/s in the wet year, the normal year, and the dry year, respectively, and the maximum and the minimum ecological flow occur in July and April. (Fig. 7c). The ecological flow during the flood season is obviously greater than that during the non-flood season due to the seasonal variability of hydrology in the Dawen River.
Fig. 6.
The conditional probability of each monthly inflow types under different annual inflow types for the Dawen River at the hydrological stations of Beiwang a), Loude b), and Daicun Dam c).
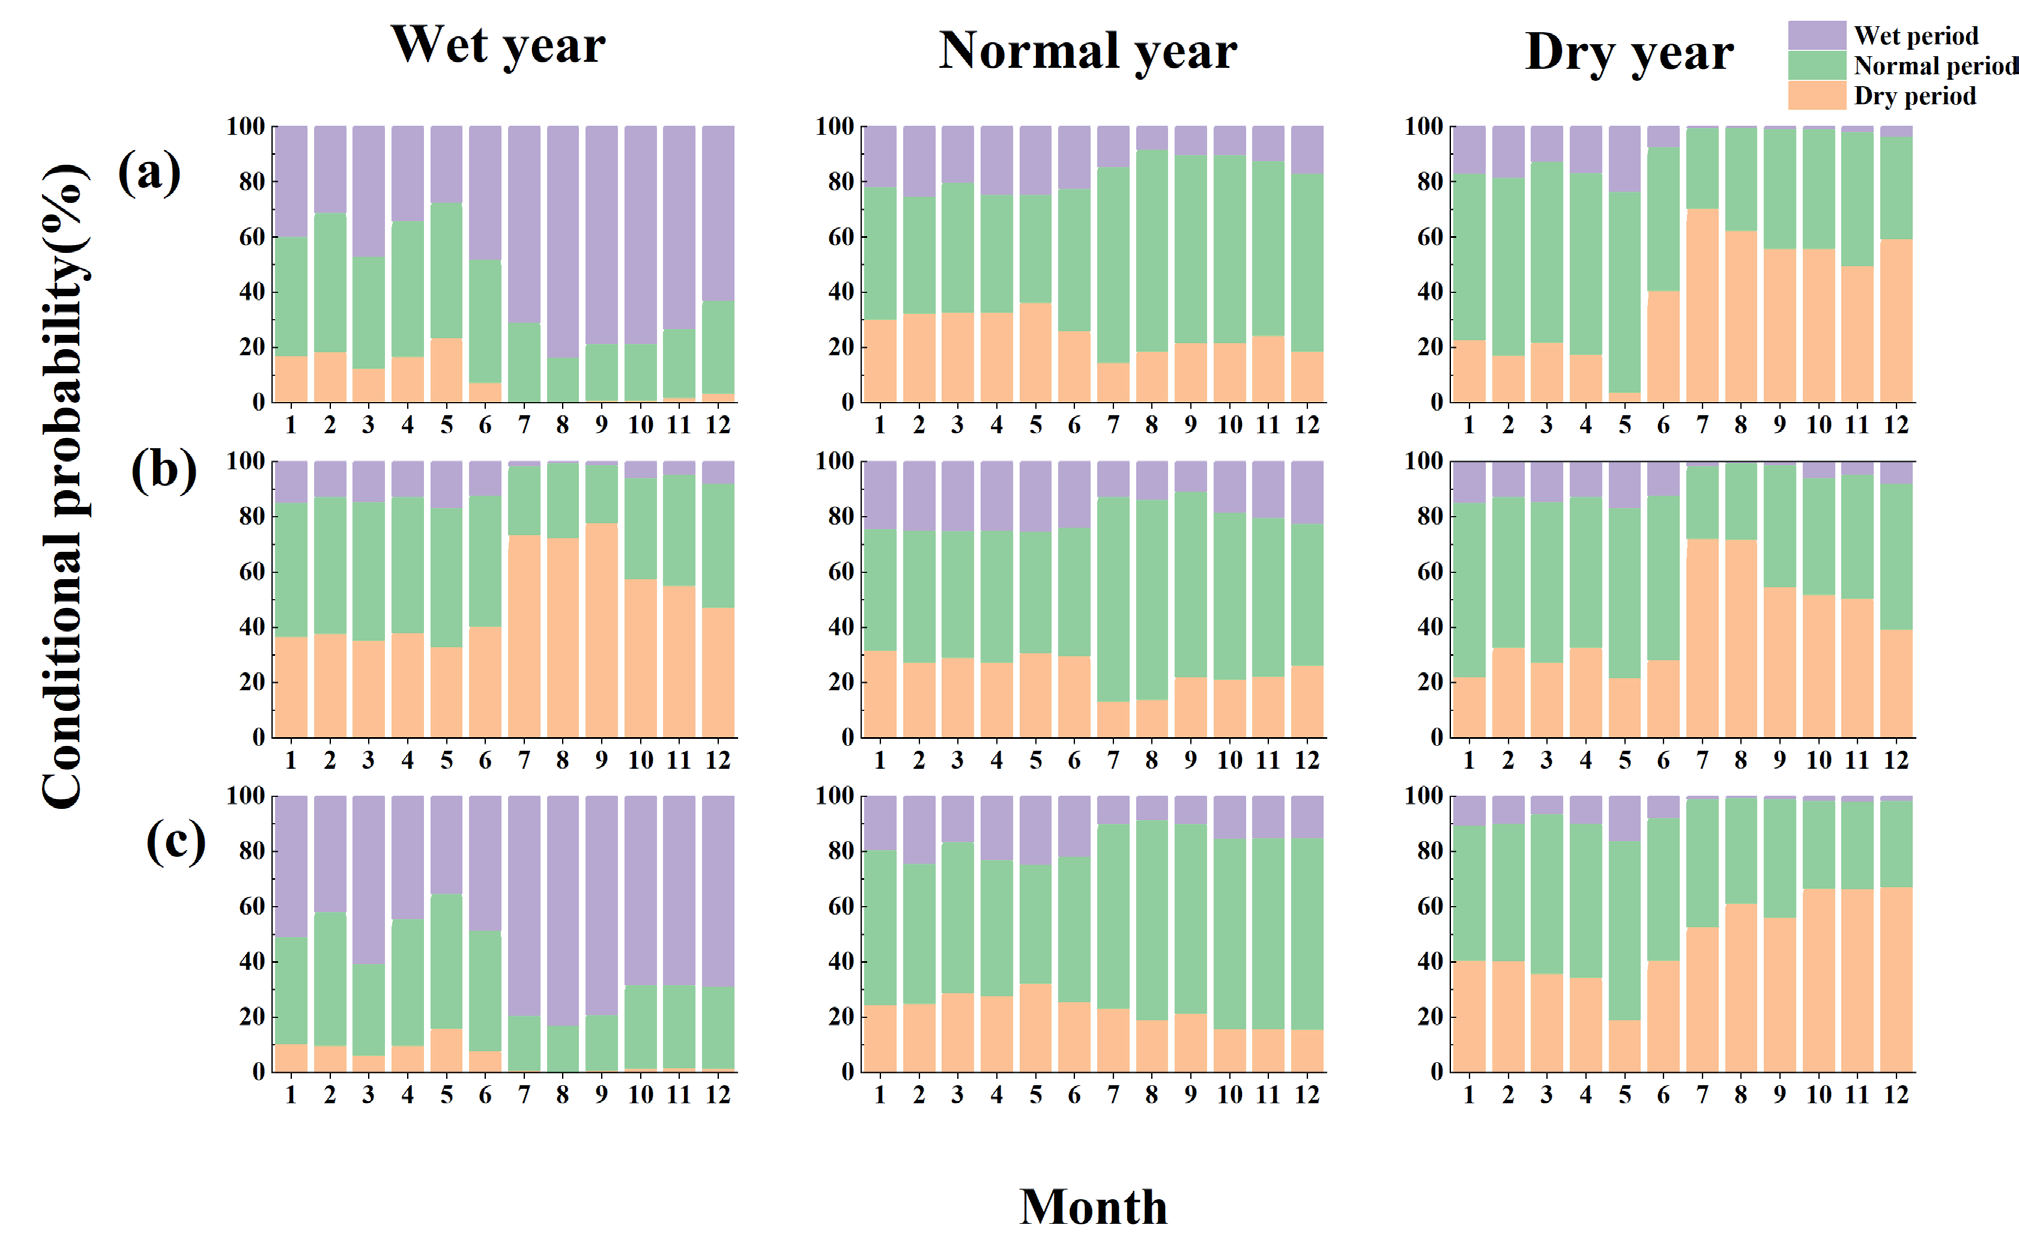
Fig. 7.
The ecological flow process determined by the Copula-based Flow Duration Curves (CFDC) method at the hydrological stations of Beiwang a), Loude b), and Daicun Dam c) for the Dawen River.
Comparing the ecological flow process calculated by the Flow Duration Curves (FDC) method and the Copula-based Flow Duration Curves (CFDC) method, The trend of ecological flow process in the Dawen River is consistent, showing a “single peak” pattern, with the peak in July, and the ecological flow is larger during the flood season (July-September) than during the non-flood season (Fig. 8). Compared with the ecological flow process calculated by the FDC method, the ecological flow process calculated by the Copula-based Flow Duration Curves (CFDC) method is significantly lower in the wet year and significantly higher in the normal and dry years, with the most significant difference in July. Based on the hydrological process variations of seasonal rivers in northern China, the ecological flow accounts for 35% to 44% of the annual runoff. Consequently, the ecological flow of the DaWen River aligns with the characteristic variations observed in seasonal rivers across northern China.
Fig. 8.
The ecological flow process based on the traditional FDC method (Q90%) (dashed line) and the Copula-based Flow Duration Curves method (solid line) for the Dawen River at the hydrological stations of Beiwang a), Loude b), and Daicun Dam c).
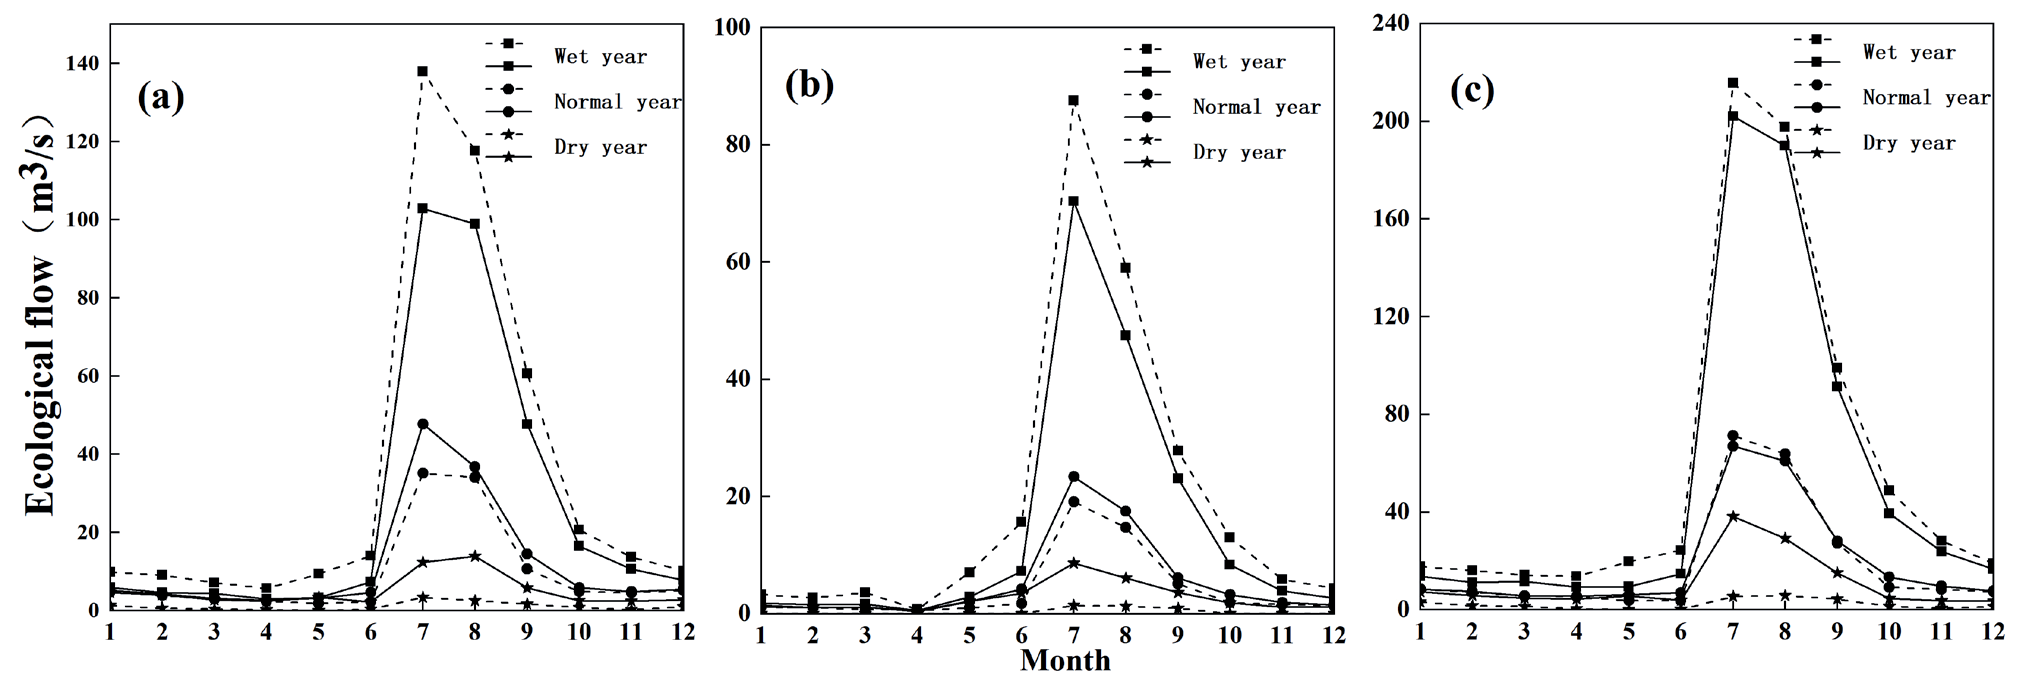
The probability of the monthly inflow type being either a wet period or a normal period is equal in the wet year (Fig. 6), which makes the ecological flow calculated by the Copula-based Flow Duration Curves (CFDC) method generally lower than the ecological flow determined by the traditional FDC method. The probability of the monthly inflow type being a normal period is about 50% to 65%, and there is high synchronicity between the annual inflow type and the monthly inflow type in the normal year. Consequently, the monthly ecological flow calculated by the Copula-based Flow Duration Curves (FDC) method is marginally higher than that of the traditional FDC method, and the disparity is minor in the normal year. In the dry year, the probability of the monthly inflow type being a normal period is comparatively high, approximately ranging from 40% to 70%, which leads to the monthly ecological flow calculated by the Copula-based Flow Duration Curves method being higher than that calculated by the traditional FDC method. The hydrological process variations on both inter-annual and intra-annual are taken into account, and the “cross-phenomena” between the annual inflow types and the monthly inflow types are deeply integrated into the Copula-based Flow Duration Curves (CFDC) method. This method is capable of facilitating the description of the trends of ecological water requirements for seasonal rivers and extreme climate areas [41, 42].
The Suitability Assessment of Ecological Flow
With reference to the relevant technical documents on ecological flow suitability evaluation issued by the Ministry of Water Resources, the paper formulates an evaluation system taking accuracy rate, fulfillment rate, suitability, and comprehensive index as indicators, based on hydrological indicators like flow rate variation, occurrence time, and extreme flow of rivers. The ecological flow determined by the Copula-based Flow Duration Curves (CFDC) method was evaluated for suitability in the paper, and the results are shown in Table 3. The accuracy, fulfillment rate, and suitability of ecological flow at the three hydrological stations of Beiwang River, Loude, and Daicun Dam are all relatively high. The ecological flow fulfillment rate at Loude Station in April was as low as 0.17, with a comprehensive index of 0.5. Thus, the river health evaluation for the suitable ecological flow at Loude Station in April was rated as moderately good. However, the evaluation results of the river health for the suitable ecological flow at Loude Station in other months were basically rated as good or excellent. The suitability evaluation index of ecological flow for the Beiwang Station and Daicun Dam stations of the Dawen River in each month ranges from 0.69 to 0.89, and the corresponding river health levels are either good or excellent. Therefore, the suitable ecological flow of the Dawen River, which is determined by the Copula-based Flow Duration Curves (CFDC) method, complies with the requirements for river ecological health, and the suitable ecological flow determined by this method is more scientific and reasonable.
Table 3.
Evaluation of Suitable Ecological Flow at three hydrological Stations of the Beiwang, Loude, and Daicun Dam Main text paragraph.
Conclusions
In this paper, the Copula-based Flow Duration Curves (FDC) method is used to determine the ecological flow process under different annual and monthly inflow types. The ecological flow of Beiwang station in Dawen River varies in the range of 2.96-102.79 m3/s, 2.56-47.68 m3/s, and 2.20-13.90 m3/s in wet year, normal year, and dry year, respectively. The ecological flow of Loude station in Dawen River varies in the range of 0.60-70.39 m3/s, 0.45-23.40 m3/s, and 0.51-8.65 m3/s in wet year, normal year, and dry year, respectively. The ecological flow of Daicun Dam station in Dawen River varied from 9.29 to 201.95 m3/s, 5.59 to 66.97 m3/s, and 4.49 to 38.17 m3/s in wet year, normal year, and dry year, respectively. Among them, the difference in ecological flow in the annual inflow types is mainly reflected in the flood season, especially in July. In addition, the Copula-based Flow Duration Curves (FDC) method deeply integrates the ‘cross phenomenon‘ of annual inflow type and monthly inflow type, which further describes the ecological flow process of seasonal rivers and extreme climate zones with different annual inflow types and monthly inflow types. In this paper, the evaluation system of ecological flow accuracy, fulfillment rate, suitability, and comprehensive index was established. The research shows that the suitable ecological flow determined by the Copula-based Flow Duration Curves (FDC) method in the Dawen River meets the requirements of river ecological health, and the suitable ecological flow determined by this method is scientific and reasonable. This achievement not only improves the applicability of the hydrological method to determine ecological flow, but also provides a theoretical basis for ecological restoration and comprehensive management of water resources in the Dawen River.

