

Introduction
Waste is defined as the remains of materials that are no longer useful and can cause pollution or disturbance to the environment. The issue of waste continues to pose a significant environmental challenge, resulting in substantial negative consequences. Reservoirs fall under the classification of artificial resources, thereby indicating their typical inclusion within the category of Common Pool Resources (CPRs) [1]. Common pool resources (CPRs), also referred to as natural resources with open access, are characterized by the perception that all parties possess a sense of entitlement to govern and utilize the resources within them. A reservoir is a significant freshwater resource that serves various purposes in multiple facets of human existence, including its role in facilitating socio-economic endeavors. Water resources in reservoirs are very basic to support economic development in the surrounding area. Jatigede Reservoir is a new reservoir built in Sumedang by damming the Cimanuk River. It was built for various purposes, including as a source of irrigation for 90,000 hectares of paddy fields in the Indramayu, Majalengka, and Cirebon areas. Jatigede Reservoir has an area of 3,035.34 ha. The construction inundated five sub-districts in Sumedang Regency. The specific locations mentioned are Cisitu, Wado, Jatinunggal, Jatigede, and Darmaraja.
There are facts in the data regarding the volume of waste that occurs in Indonesia. The volume of waste from the household sector that enters the waters of the reservoir is 58 metric tons per day, and that from the fisheries sector is 12 metric tons per day. Meanwhile, liquid waste is 106 million liters per week in the household sector and 12 million liters per week in the fisheries sector [2]. Indonesia is an archipelagic country; this country is dominated by the ocean as a place for rivers and reservoirs to flow, which shows the fact that Indonesia produced around 66-67 million tons of waste in 2019. Jatigede Reservoir has potential in terms of aquaculture activities, but the unknown distribution of waste around the Wado Area is an obstacle to knowing the potential of the Wado Area in terms of water quality and its relation to fishing activities. The waters of the Jatigede Reservoir, especially in the Wado District, Sumedang Regency, have fluctuating pollution levels. Wado District is part of the Jatigede Reservoir, which has the highest waste distribution.
Similar problems also occur in the Citarum River. Apart from being a water source, the Citarum River is also a source of irrigation water for hundreds of thousands of hectares of rice fields and power plants on the islands of Java and Bali. Along its stretch, there are three reservoirs on this river, namely Saguling Reservoir, Cirata Reservoir, and Jatiluhur Reservoir. The current status of the Citarum River is heavily polluted; this is due to the high level of domestic and industrial activity on the riverbanks. The main causes of river pollution include industrial pollution, agricultural waste, livestock waste, fishery waste, and domestic waste. The waste problem cannot be separated from a poor management system, namely ignorance regarding the processing system for various types of waste. Many types of waste can be managed to produce economic value. Plastic waste can be recycled or resold, paper waste can be made into recycled paper, kitchen waste can be processed into plant fertilizer, and waste in the form of chemical waste receives special treatment at its disposal. Apart from recycling, several types of waste, such as plastic, paper, and metal waste, can be resold and provide economic benefits.
The waste comes from various community activities in Sumedang, including tourism activities and aquaculture activities, namely floating net cages (KJA). The lack of understanding of the local community regarding the harmful effects of throwing waste into the water makes the routine of throwing waste always occur. In addition, the Wado area is the main inlet of the Cimanuk River, which is the main point where waste from various areas enters. Apart from the Cimanuk River, the Cialing River and the Cibudah River are rivers located along the banks of the Wado Area that are also sources of waste entry into the Wado Area. The area with the highest level of waste volume is on the banks of Wado, which is located in Wado Village. Based on the description that has been described above, there is a necessity for a study to ascertain the distribution and dispersion patterns of waste within the Jatigede reservoir originating from three primary sources. So, the implication of this research in this study is to provide basic data on waste management in the Jatigede Reservoir.
Material and Methods
Time and Place of Research
A preliminary investigation was conducted on July 29, 2022, in the Wado Area, commencing from the Tugu Wado. The primary investigation was conducted between the dates of February 15th and April 30th, within the Wado Area, located in Sumedang, West Java. The location specifications used are three locations. As shown in Fig. 1, station 1 is situated in the Cimanuk (main river), station 2 is situated in the Cibudah (sub-river), and station 3 is situated in the Cialing (sub-river).
Research Method
The research method used in this research activity is through surveys with a field observation approach. The procedure applied in determining the location or sampling point in this study is the purposive sampling design method. The research stations are the 3 Cimanuk River, Cibudah River, and Cialing River. At each research station, there are 5 observation points. Using transects to pick up waste, which is made of a square measuring 2 x 2 m2 with a diameter of 3.4 inches, so that the total observation points in the 3 locations are 15 points, sampling twice. The waste found is then sorted according to its type, recorded based on its characteristics, and weighed and classified into macro and meso-sized waste, to get the weight of the waste concerning the waste classification (Koswara 2014).
Then, it is analyzed in terms of weight, size, and type of waste. Waste calculations were carried out at the research location by looking visually. A sample weighing was carried out using a 10 kg digital scale. Then the data that has been obtained will be displayed in graphical form, which is processed first in Microsoft Excel and then analyzed descriptively until finally a conclusion is drawn based on the data obtained. The land area was calculated using ArcMap software using several types of existing projection systems to map patterns of waste distribution as well as estimate the total volume of waste contained in the Jatigede reservoir. Reference for types of wastewater is shown in Table 1.
Fig. 1.
Study Site on Jatigede Reservoir, The 3 Sampling Station Located at The Inlet of The Reservoir.
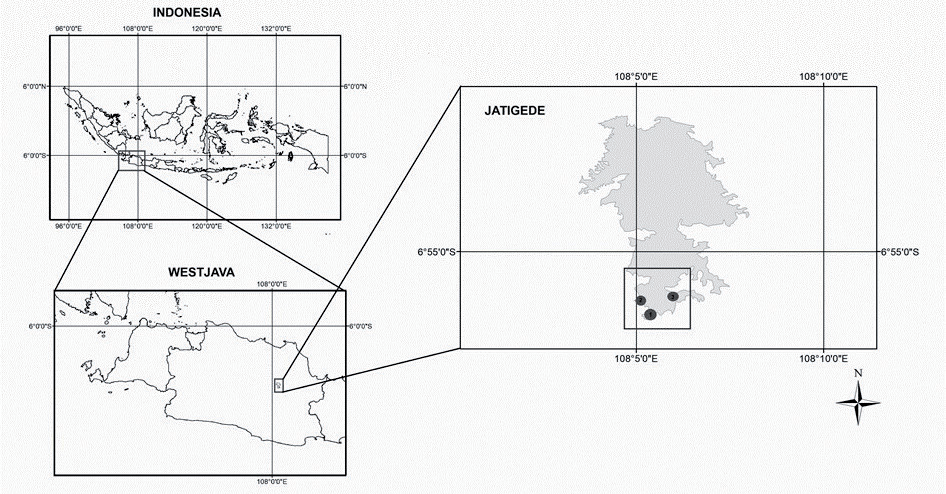
Table 1.
Types of Waste Water.
Results and Discussion
The Composition of Waste in Jatigede Reservoir
The results of the study regarding the components of waste along with a description of the types and overall weight of waste in the Jatigede Reservoir are listed in Table 2 and Fig. 2.
The findings indicated that the primary constituent of waste in the Jatigede Reservoir was organic waste, accounting for a total of 32.298 kg and representing 34% of the total waste, which consisted of coconut fiber, twigs, wood, bamboo, water hyacinth, and snails. This large number was due to the condition of the research location, where many kinds of plants were found along the edges. Starting from coconut trees, banana trees, bamboo trees, teak, mahogany, sengon, bungur, etc. This is by [3], which states that the most common waste found on the banks and near river mouths is organic waste. The existence of this organic waste can cause serious problems for aquatic ecosystems; one phenomenon that will occur is eutrophication.
Table 2.
Percentage Calculations of Waste Water.
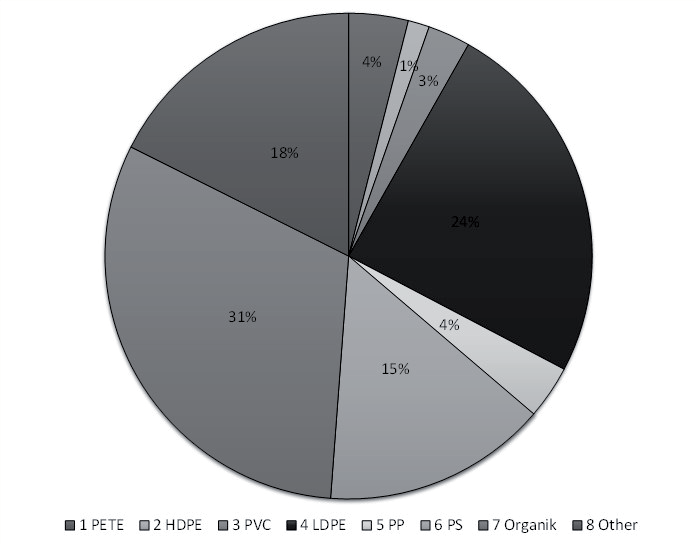
The results showed that the total amount of waste contained in the Jatigede Reservoir in second place was dominated by LDPE plastic waste, which is the most frequently encountered polymer with an amount of 21.816 kg and a percentage of 23%, the composition of which consists of plastic bags, bubble wrap, packaging instant noodles, oil packaging, laundry soap packaging, instant snack packaging, flour packaging, and seasoning packaging. This large number is because plastic is still frequently used today because of its lightweight, durable, strong, and relatively inexpensive nature. Sources of plastic waste that are deposited close to its origin [4]. Therefore, the resident area’s microplastic litter was very abundant during sampling. Plastic food packaging is the most common, mostly junk food wrappers, spice sachets, and other food storage, and is present in macroplastic flux and bank collection sampling as it is available locally and can be purchased in smaller quantities, which makes it more affordable [5]. The disposal of plastic waste by the community will be carried to the coast; this is what causes an increase in the type of plastic waste in the waters. The light nature of plastic causes it to tend to float on the surface of the water [6]. This also happens in the waters of Ambon Bay when it rains. Plastic waste that is on the coast or carried by the river flow will enter the waters of Ambon Bay and float, resulting in dirty waters full of waste [7]. LDPE tends to have a density lower than 1 kg/m3, which makes this species afloat in sea and fresh water. LDPE is a plastic sheet that can cause intoxication in fish.
Among the waste, PS-type plastic waste accounted for the majority, with a total weight of 15.84 kg, representing approximately 17% of the total waste. The predominant component within this category was styrofoam. This large amount is due to Styrofoam being a popular material of choice that can be relied upon by food and beverage outlet owners. The basic ingredients used in the manufacture of styrofoam consist of 90-95% polystyrene and 5-10% n-butane gas [8]. This styrofoam material has an effect that needs to be watched out for because it contains hazardous materials for health and the environment. The residue contains styrene monomer, which is carcinogenic and can trigger cancer. Styrofoam carried into the water can damage ecosystems and biota in both rivers and seas. Styrofoam waste can be recycled after 65 to 130 years.
The category of others is various waste types, constituting a total of 13.89 kg and accounting for 15% of the overall waste composition. These waste items encompassed dolls, bags, shoe insoles, shoes, hats, sandals, carpets, rope mines, electronic devices, metal straws, children’s toys, candles, lighters, balloons, wallets, hats, LED lights, sacks, cloth, hair ties, and cables. This large number comes from the high population. The population of an area contributes positively to the increase in the presence of waste [9]. This can be seen from other types of waste, which are household items, with a total population of 44,527 residents in the Wado District. Several rivers that flow into the Jatigede Reservoir will contribute waste when it rains because the people who live around the river use the river as a waste disposal site.
The total weight of PETE waste was 4.016 kg, accounting for approximately 4% of the total waste. This waste category primarily consisted of bottled mineral water and glass drink bottles. This large amount comes from the high output of bottled water produced by the factory. This large amount comes from the high output of bottled water produced by the factory. Drinking containers made of PETE are usually found accumulating at the bottom of the water and floating in the water due to the buoyancy effect, which is affected by water currents, turbulence, and trapped air. PETE is recommended to be used only once (single use) and can be dangerous if exposed to hot water because it can melt and release carcinogenic substances [10]. PETE plastic is difficult to clean from bacteria, and this PETE plastic material can be toxic.
PP waste accounted for 3.171 kg, representing 3% of the total. The composition of PP waste included plastic spoons, plastic forks, bottle caps, plastic straws, plastic cups, spray hand sanitizer, and rubber covers for LPG gas. This large amount comes from the high production results of various human activities. This PP plastic can protect the material inside from moisture, oil, and other chemical compounds. Considered safe when reused and recyclable. This type of plastic has a high trade value; it is estimated that it will reach 133.3 billion USD in 2023 [11]. If PP is disposed of in a landfill, it will decompose between 20 and 30 years later, so efforts should be made to recycle as much as possible.
The least amount of waste was observed in the HDPE type, which had a total mass of 2.315 kg and accounted for 2% of the total waste. Similarly, the PVC-type waste had a mass of 1.869 kg and also constituted 2% of the total waste. Due to its dangerous nature, this type of plastic HDPE is recommended for single use only, but if it is to be reused, it is necessary to pay attention to the liquid that will be used, which must be the same type as the original liquid (the initial product). Meanwhile, 70 percent of PVC is used as a construction material due to its high corrosion resistance and durability, making it suitable for underground and surface pipelines. If PVC is burned, it will produce vinyl chloride gas, which is carcinogenic [12]. In addition to the principle that it is difficult to recycle, it can only be reused according to the original product. Detailed information about the waste in each station is described below.
Description of Waste Water at Station 1 Cimanuk River
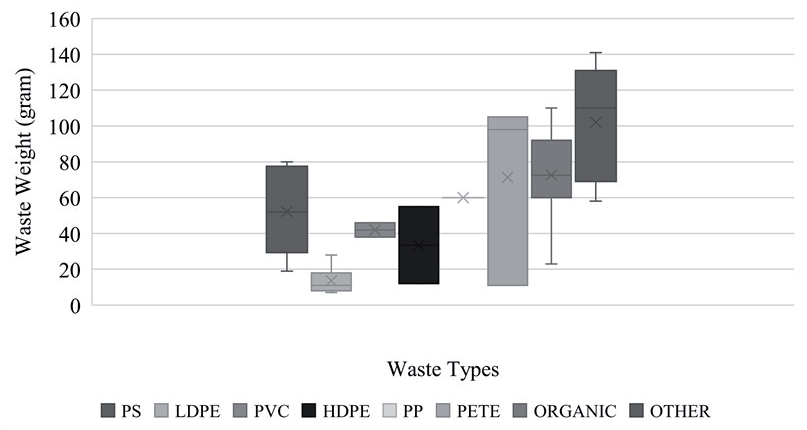
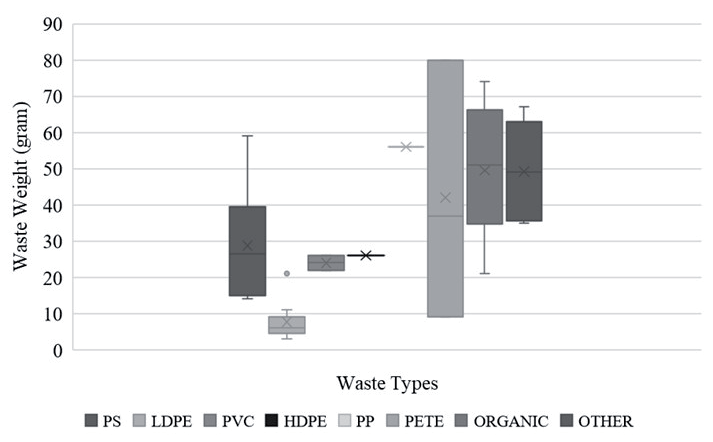
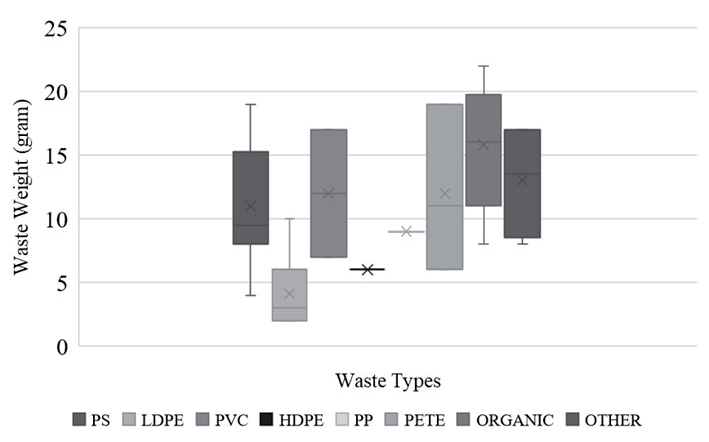
The Jatigede Reservoir is surrounded by wastewater that can be classified into eight categories. The Cimanuk River has the highest volume of waste among the other two river stations. The results of research on the distribution of waste in the Cimanuk River can be seen in Fig. 3-5.
Starting from plastic, organic, and other types of waste. Waste belonging to the Other type of waste ranks first for the type of waste that has the largest weight, which reaches 141 g with a size of 43 x 30 cm2, a medium weight of 67 g with a size of 28 x 9 cm2, and the smallest weight of 8 g with a size of 6 x 3 cm2. Next, organic waste ranks second for the type of waste that has the second largest weight, which reaches 110 g with a size of 60 x 2 cm2, a medium weight of 74 g with a size of 30 x 2 cm2, and the smallest weight of 8 g with a size of 3 x 3 cm2. The third highest rank is occupied by PETE-type waste, with the largest weight of 105 g with a size of 39 x 27 cm2, the medium weight of 80 g with a size of 16 x 5 cm2, and the smallest weight of 6 g with a size of 9 x 6 cm2.
Additionally, there is PS-type waste, which has the largest weight of 80 g with a size of 50 x 4 cm2, a medium weight of 59 g with a size of 30 x 9 cm2, and the smallest weight of 10 g with a size of 4 x 3 cm2. It is joined by PP-type waste, which has the largest weight of 60 g with a size of 16 x 4 cm2, a medium weight of 56 g with a size of 11 x 3 cm2, and the smallest weight of 9 g with a size of 7 x 2 cm2. Then it is connected with HDPE-type waste, which has the largest weight of 55 g with a size of 21 x 7 cm2, a medium weight of 26 g with a size of 15 x 7 cm2, and the smallest weight of 6 g with a size of 11 x 3 cm2. Followed by PVC-type waste, which has the largest weight of 46 g with a size of 60 x 50 cm2, a medium weight of 26 g with a size of 45 x 30 cm2, and the smallest weight of 7 g with a size of 25 x 25 cm2. Finally, there is LDPE type waste, which has the largest weight of 28 g with a size of 50 x 30 cm2, the medium weight of 21 g with a size of 30 x 16 cm2, and the smallest weight of 2 g with a size of 10 x 6 cm2.
Description of Waste Water at Station 2 Cibudah River
Cibudah River ranks last because the volume of waste in this area is the lowest compared to the other two river stations. The results of research on the distribution of waste in the Cibudah River can be seen in Fig. 6-8.
Neither PP nor PETE waste types were detected in the Cibudah River during the initial or subsequent sampling periods. Organic waste ranks first for the type of waste that has the largest weight, which reaches 105 g with a size of 40 x 2 cm2, a medium weight of 42 g with a size of 25 x 2 cm2, and the smallest weight of 4 g with a size of 2 x 2 cm2. Next, waste belonging to the Other type of waste ranks second to the type of waste that has the second largest weight, which reaches 102 g with a size of 35 x 25 cm2, a medium weight of 37 g with a size of 21 x 5 cm2, and the smallest weight of 2 g with a size of 5 x 1 cm2. The third highest rank is occupied by PS-type waste, which has the largest weight of 94 g with a size of 35 x 20 cm2, the medium weight of 26 g with a size of 26 x 17 cm2, and the smallest weight of 2 g with a size of 3 x 2 cm2.
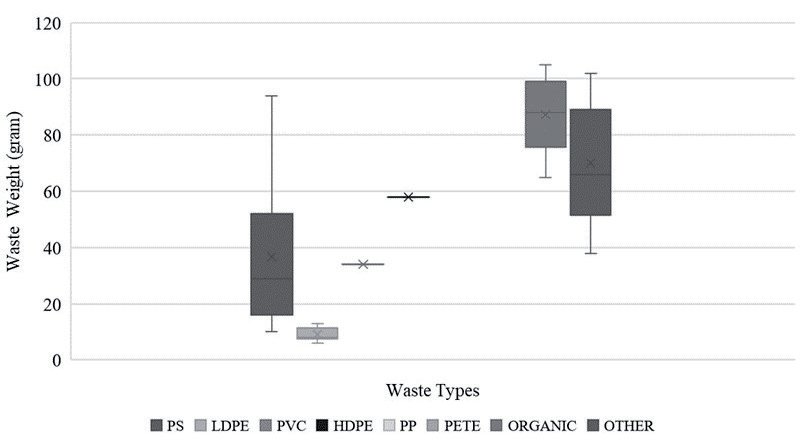
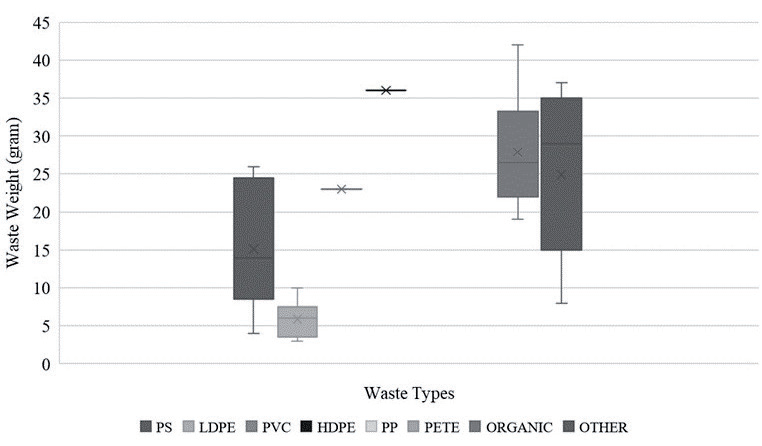
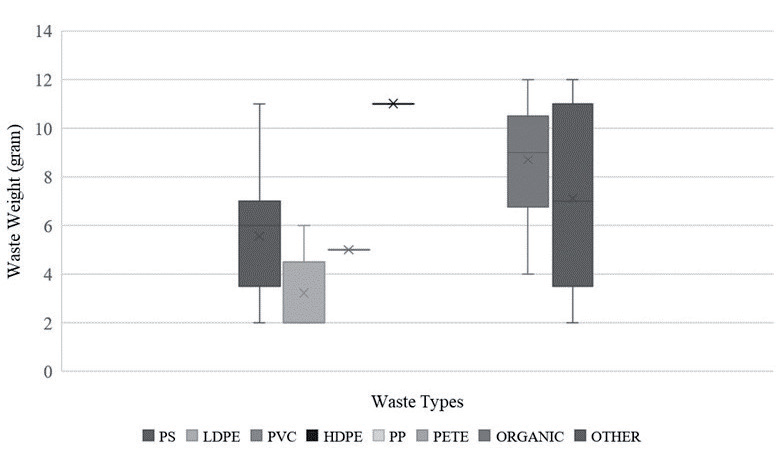
Furthermore, there is HDPE-type waste, which has the largest weight of 58 g with a size of 22 x 16 cm2, a medium weight of 36 g with a size of 13 x 11 cm2, and the smallest weight of 11 g with a size of 6 x 6 cm2. It is joined by PVC-type waste, which has the largest weight of 34 g with a size of 10 x 5 cm2, the medium weight of 23 g with a size of 5 x 3 cm2, and the smallest weight of 5 g with a size of 2 x 2 cm2. Lastly, there is LDPE-type waste, which has the largest weight of 13 g with a size of 40 x 30 cm2, a medium weight of 10 g with a size of 26 x 20 cm2, and the smallest weight of 2 g with a size of 6 x 3 cm2.
Description of Waste Water at Station 3 Cialing River
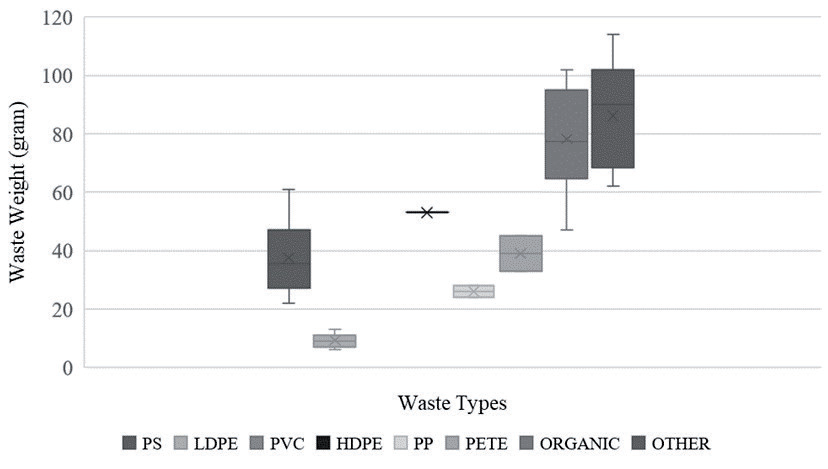
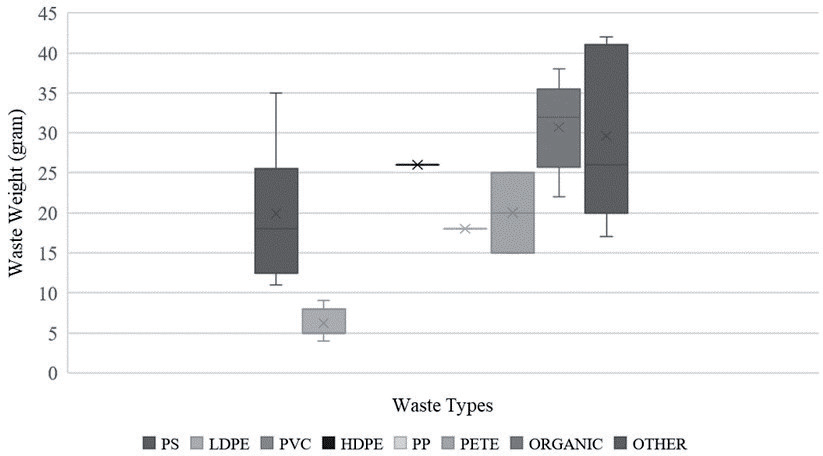
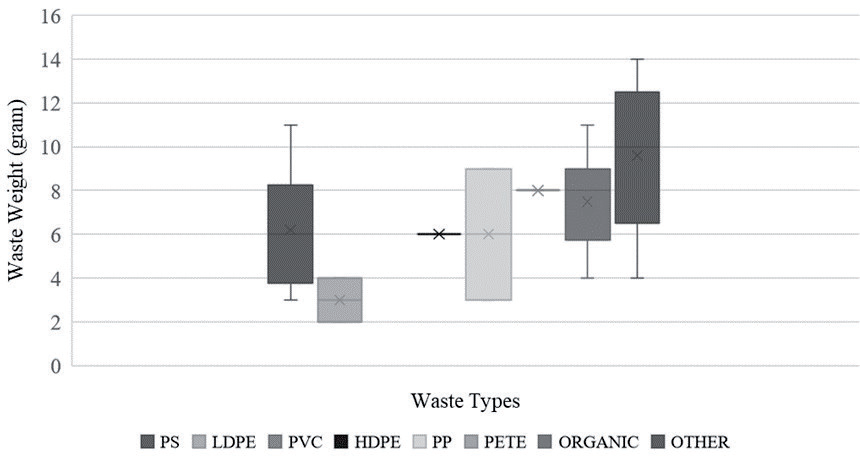
Cialing River has the second-largest volume of waste, after Cimanuk River station. The results of research on the distribution of waste in the Cialing River can be seen in Fig. 9-11.
The Cialing River does not contain any polyvinyl chloride (PVC) waste. Among the various categories of waste, those falling under the classification of “other types” claim the top spot in terms of weight. Other types of waste have the largest weight of 114 g with a size of 68 x 53 cm2, the medium weight of 42 g with a size of 22 x 6 cm2, and the smallest weight of 4 g with a size of 8 x 3 cm2. Next, organic waste ranks second for the type of waste that has the second largest weight, which reaches 102 g with a size of 40 x 3 cm2, a medium weight of 38 g with a size of 25 x 2 cm2, and the smallest weight of 4 g with a size of 6 x 3 cm2. The third highest rank is occupied by PS-type waste, which has the largest weight of 61 g with a size of 120 x 10 cm2, a medium weight of 35 g with a size of 50 x 20 cm2, and the smallest weight of 3 g with a size of 8 x 1 cm2.
Subsequently, there is HDPE-type waste, which has the largest weight of 53 g with a size of 20 x 15 cm2, a medium weight of 26 g with a size of 10 x 7 cm2, and the smallest weight of 6 g with a size of 7 x 3 cm2. It is joined by PETE-type waste, which has the largest weight of 45 g with a size of 19 x 5 cm2, a medium weight of 25 g with a size of 14 x 3 cm2, and the smallest weight of 8 g with a size of 5 x 3 cm2. Then it is connected with PP-type waste, which has the largest weight of 28 g with a size of 13 x 4 cm2, a medium weight of 18 g with a size of 9 x 3 cm2, and the smallest weight of 3 g with a size of 4 x 2 cm2. Finally, there is LDPE-type waste, which has the largest weight of 13 g with a size of 60 x 30 cm2, medium weight of 9 g with a size of 28 x 20 cm2, and the smallest weight of 2 g with a size of 9 x 7 cm2.
The Estimated Total Area of Waste Distribution
The estimated total area of waste distribution can be seen in Fig. 12 and Table 3. It reaches 42.6 hectares of waste area in the Cimanuk River, 2,17 hectares in the Cibudah River, and 23,3 hectares in the Cialing River.
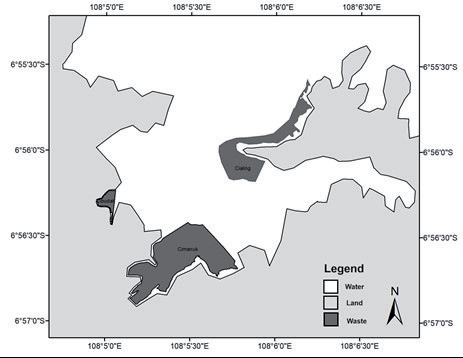
Table 3.
The Estimated Total Waste.
| No. | Location | Total Waste per Area (kg) | Total Area of Waste (ha) | Estimated Total of Waste (Ton) |
|---|---|---|---|---|
| 1. | Cimanuk River | 62.209 | 42.6 | 2.921 |
| 2. | Cibudah River | 11.651 | 2.17 | 27.8 |
| 3. | Calling River | 21.355 | 23.3 | 54.85 |
Table 4.
The Impact of The Existence Waste Water.
Plastic can be degraded into smaller plastic particles, one of which is microplastic. Plastic materials that enter the environment as plastic waste can turn into microplastics and nanoplastics through chemical and biological processes. Plastic polymers are less biodegradable in water areas, including rivers, but are degraded into smaller parts due to UV radiation and water currents [13]. This phenomenon leads to the displacement of the waste, which will be transported towards the river estuary and ultimately into the sea. In the absence of the rainy season, this factor is considered to have minimal impact. The issue of waste on the banks is multifaceted due to the convergence of multiple rivers into the sea. Amongst the research sites, the Cimanuk River stands out as the area with the most diversity of aquatic waste. The Cimanuk River serves as an inlet, a residential region, and a dense source of human activity. The following table presents the impact of the existence of all types of waste listed in Table 4.
Water pollution is quantified by the concentration of pollutant substances present in water bodies and is assessed using a water quality benchmark known as the Base Maximum Allowable Concentration (BMA). When the concentration of a pollutant surpasses the established threshold for acceptable quality, it signifies that its presence has resulted in detrimental effects on organisms that rely on it [17]. In research conducted by Khasanah 2022, the water quality parameters analyzed were divided into physical parameters and chemical parameters. All water quality parameters that have been analyzed are then compared with the water quality standard (BMA) stipulated in Government Regulation No. 22 of 2021 concerning the Implementation of Environmental Protection and Management for class 2 and class 3 designations of fisheries, which are processed using the Storet Method. Based on the results of the water quality calculation above, station 1, which is the observation station in this study, shows that the water quality there belongs to the heavily polluted status. The impact felt due to water pollution status is included in heavily polluted i.e. causing the exceedance of the ability of the reservoir to clean itself (self-purification), so that it will cause serious problems, namely water pollution. Polluted waters will negatively affect the life of aquatic biota and of course the health of the people who use the reservoir water. With details as shown in Table 5.
Table 5.
Water Quality in the Wado Area.
The amount of wastewater and its distribution in the Jatigede Reservoir indicate shared environmental issues in West Java and Indonesia. An extensive approach is required to effectively handle the substantial volume of plastic waste present in the water. The principles of reduce, reuse, and recycle should be implemented with the utmost importance and unwavering consistency. One way to handle single-use plastic waste is through the implementation of local government regulations to limit the use of single-use plastic. This has been regulated in the Ministry of Environment and Forestry Regulation No. P.75/MENLHK/SETJEN/ KUM.1/10/2019 concerning the Roadmap for Waste Reduction by Producers (Permen LHK 75/2019) in 2019. This regulation requires producers in the manufacturing, food and beverage services, and retail sectors to reduce waste arising from products, product packaging, and/or containers made of plastic, aluminum cans, glass, and paper. Enforcement of the prohibition on single-use plastic may be necessary, as education cannot be divorced from this policy. An integrated plan involving all stakeholders, from the upstream to the downstream areas, is important for effective river basin management.
Conclusions
The results of research on all the waste found in the Jatigede Reservoir show the following results:
1. The highest percentage of total waste found in the Jatigede Reservoir is organic waste, with a total percentage of 34%. Most plastic waste is found in LDPE-type waste, with a total percentage of 23%. The least amount of waste is found in HDPE and PVC waste, with a total percentage of only 2%.
2. Based on the waste found, The Cimanuk River has the largest distribution of waste, with the largest composition of waste being organic type waste.
3. While the study highlights the significant amount of waste in the Jatigede Reservoir originating from the Cimanuk River, conducting additional research that encompasses the entire reservoir will provide helpful insights for reservoir management. Subsequently, the investigation of waste in the Cimanuk River Basin will expand the data to bolster the management of rivers, lakes, and reservoirs.

