


Introduction
Rivers are essential for the community as a water source with various ecosystems and fulfill human needs. Along with increasing development, especially in urban areas, rivers are experiencing ecological degradation [1]. An assessment involving the ecological integrity of both biotic and abiotic elements is necessary to see the river as an ecosystem unit [2]. The management of the global aquatic environment has gradually shifted from pollution control to ecological restoration. The threat of biodiversity loss is caused by habitat change, pollution, the entry of invasive alien species, overexploitation, and climate change. Various countries are trying to implement multiple programs to restore the condition of the biodiversity of river ecosystems through river rewilding and restoration [3].
Jakarta is one of the provinces and the capital city of Indonesia. No less than 13 rivers flow in Jakarta [4]. The potential of these rivers can be utilized to support various ecosystem services. Although the surface area of rivers in Jakarta only reaches 0.5% of the total land area, rivers are vital for drinking water, fisheries, and urban businesses [5]. River fisheries production accounts for up to 81% of the nutrient supply to low-income countries where other protein sources are too expensive. On the other hand, the potential for fisheries in river ecosystems has various threats. Currently, river management in Jakarta still focuses on managing river water quality due to deteriorating conditions. Along with technological advances, the transition from river management to ecological restoration must occur in stages [6].
The high level of pollutants downstream of Ciliwung significantly affects the diversity index of benthos, plankton, and fish [7]. Based on previous studies, the abundance of several classes of insects is more common in the upper reaches of the Ciliwung River because larval communities are associated with low-polluted and well-oxygenated streams [8]. The research results on benthic macroinvertebrates in the downstream Ciliwung watershed show the dominance of Mollusks, Annelids, and Insects [9]. Various aquatic ecosystems in Jakarta are already dominated by invasive species, and only a few native fish species remain [10].
During the last few decades, there have been many uses of technology that utilize DNA isolated from the environment [11]. The environmental DNA (eDNA) method can detect the presence of target species and the abundance of organisms in an area more effectively and efficiently than conventional methods [12]. eDNA consists of DNA fragments released by organisms into the environment and will then be dispersed and degraded over time. DNA fragments can come from the skin, urine, feces, mucus, and reproductive cells. eDNA cannot describe the life phase of organisms, but it can help identify species and provide semi-quantitative estimates of taxonomic abundance based on DNA readings [13]. This study aims to: 1) identify the current status of aquatic biota and previously based on eDNA, 2) identify the water quality physically and chemically, and 3) identify the relationship between water quality and aquatic biota composition basedon eDNA at three sites of the Lower Ciliwung River in Jakarta. This research will provide significant benefits and become a preliminary study of aquatic biota research in the Lower Ciliwung River. Several discoveries of aquatic biota that have not been found in previous studies can become new findings to enrich the status of the composition of aquatic biota in Jakarta.
Materials and Methods
Study Locations
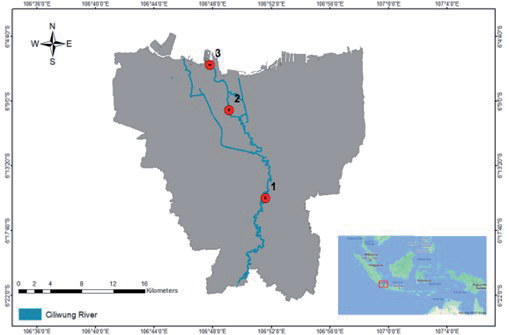
Samples of eDNA were collected from three sites in the Lower Ciliwung River (Fig. 1). At each site, the sample was repeated three times. Several locations were sampled, including the natural river (point 1), the normalized river (point 2), and estuaries (point 3). The three sites were chosen based on differences in river conditions.
eDNA Sampling and Analysis
A sampling of eDNA was carried out by Oceanogen Laboratory in July 2022. River water samples were taken at the surface of the water column and collected in 4 L bottles. Each water sample was filtered through 0.45 μm sterile filter paper using a peristaltic pump. After filtration, each filter paper was placed in a 2 mL cryotube filled with a 1.5 mL DNA/RNA shield. According to the manufacturer’s guidelines, the Geneaid gSYNC DNA Extraction Kit was used to extract the eDNA from the filter papers. The first PCR amplified the target region using mlCOIintF as forward and jgHCO2198 as reverse. The primers target a COI gene (~313 bp), which includes enough information to identify universal metazoan to taxonomic family, genus, and species [14]. The phases of the DNA amplification PCR profile were as follows: (1) pre-denaturation of the template DNA (95ºC, 5 minutes); (2) denaturation of the template DNA (95ºC, 30 seconds); (3) annealing (42ºC, 30 seconds); (4) primary extension (72ºC, 30 seconds); and (5) final extension (72ºC, 5 minutes) with 35 cycles of stages (2)-(4).
PCR product quality was visualized using electrophoresis on a 2% agarose gel (100 mL TAE buffer and 2 g agarose). The electrophoresis machine was run at 50 volts for 60 minutes, and the results were visualized using a UV Fluorescent via an Alpha Imager Mini Gel Documentation System. All PCR products that passed the electrophoresis quality control underwent a second PCR for indexing purposes. The PCR cycle comprised an initial denaturation (95ºC, 3 minutes), then 9 cycles of 95ºC for 30 seconds, 55ºC for 30 seconds, 72ºC for 30 seconds, and a final extension at 72ºC for 5 minutes. DNA sequencing was performed on an Illumina NovaSeq 6000.
Bioinformatic analysis was performed using the software Quantitative Insights into Microbial Ecology 2 (QIIME2, https://qiime2.org/). The process in QIIME2 includes: (a) deletion of forward and reverse primer sequences with cut-adapt, (b) detection and correction of amplicon sequences with the DADA2 pipeline [15], and (c) grouping sequences based on their proportion of similarity (clustering) to produce an Operational Taxonomic Unit (OTU). Taxonomic identification of COI sequences identified to the species level based on the CRUX database (Creating Reference Libraries Using the eXisting tool).
This study only highlights organisms at the class level to serve as a database for recently detected organisms. Data analysis was performed on Plotly. js v2.14.0 software (https://plotly.com/) and R v. 4.2.1 (http://r-projekt.org). The results of relative abundance were evaluated using the ANOSIM test on PAST (PAleontological STatistics) v. 4.11 to determine which levels differed significantly (p-value<0.05). The ANOSIM-R value shows the extent to which groups differed, i.e., well-separated groups (R>0.75), separated but overlapping groups (R = 0.50-0.75), separated but strongly overlapping groups (R = 0.25-0.50), and barely separated groups (R<0.25) [16]. Shannon-Wiener (H') and the Simpson Index (D) were calculated to assess diversity and dominance using the vegan package in R software.
Water Quality
Water quality data at the sampling point was obtained from the Jakarta Provincial Environmental Service. This institution conducted river water quality sampling 4 times in 2021 (twice in the dry season and twice in the rainy season). Water quality data in this study were obtained from the results of the second monitoring period (June-August 2021) due to the similarity of seasonal variability to the eDNA data collection period in July 2022. Water quality parameters such as pH, biochemical oxygen demand (BOD), chemical oxygen demand (COD), total suspended solids (TSS), total nitrogen (TN), total phosphorus (TP), and ammonia-nitrogen (NH3-N) are important factors that determine the presence of biota in the riverine ecosystem [17, 18]. Several previous studies have shown a link between water quality and aquatic ecosystem eDNA assessments, both carried out cross-sectionally and in several climate variations [19].
Results and Discussion
Biodiversity Assessment
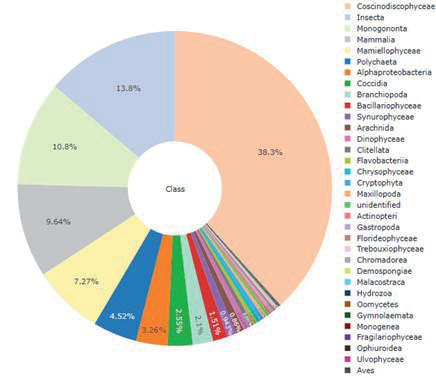
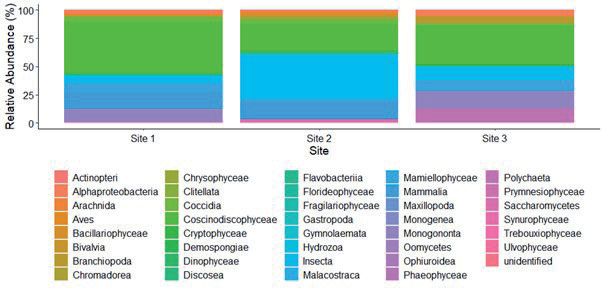
A total of 1,492,975 original reads, then filtered to 1,265,307 reads, were generated from the next-generation sequencing of amplicons from 9 samples collected. The sequences refer to 35 classes from 22 phyla. A total of 22, 24, and 28 classes of organisms were detected at sampling points 1, 2, and 3, respectively. So far, research on biodiversity in the Ciliwung River has tended to be divided between plankton, benthos, nekton, and other macro-microbiologies. This study uses the eDNA approach to detect all organisms in one sampling as long as their genetic material remains in the environment. At the class level, taxonomic composition across the sampling locations was dominated by Coscinodiscophyceae, with a higher proportion (38.3%) than Insects (13.8%), Monogononta (10.8%), Mammalia (9.64%), Mamiellophyceae (7.27%), and Polychaeta (4.52%) (Fig. 2). Class Coscinodiscophyceae dominates sites 1 and 3, while Insects dominate at site 2 (Fig. 3). This study's results align with Hasibuan [20] that Bacillariophyta (diatoms), such as Coscinodiscophyceae and Bacillariophyceae, are phytoplankton that dominates the Ciliwung River.
Bacillariophyta has high adaptability to aquatic conditions and can reproduce quickly [21]. Diatom, a kind of autotrophic photosynthetic eukaryotic algae, is an essential primary producer. As bioindicators, some diatoms can indicate the eutrophication or oligotrophication of waters. Moreover, some species of diatom can also detect acidity, water's Cu concentration, Zn concentration in waters, water's contamination, ecological status of the river, and nutrient distribution. When diatoms reach a limited volume, they separate vegetatively. This type of reproduction permits the diatoms to attain (under no resource limitation) huge clonal populations and, therefore, the capacity to overcome a new space and control the accessible resources [22].
The insects were from Coleoptera, Diptera, Blattodea, Lepidoptera, Hemiptera, Hymenoptera, and Phthiraptera. Insects are ubiquitous environmental components, including terrestrial and freshwater, as part of food webs [23]. River water quality changes will affect aquatic insects’ composition and distribution. The use of these animals as bioindicators is based on their wide distribution, relatively high density, and relatively high sensitivity to pollution. The benthos found in this study were from Gastropods, Bivalves, Monogenea, Polychaeta, Clitella, and Malacostraca. Benthos is an organism that lives at the bottom of the water, in direct contact with sediments. Hence, it has the potential to be directly exposed to pollutants. According to Wiedarti et al. [23], Gastropods have a wide range of tolerance to water conditions and a wide distribution area. The diversity of macro-zoobenthos is decreasing towards the lower reaches of the Ciliwung River. This is closely related to the increasing level of pollution downstream [23].
The higher DNA in the water based on the read sequence from DNA materials can be detected because genetic material can be stored for a long time. Degradation time is related to topography and oceanography, affecting water transport [24]. Environmental factors (i.e., temperature, organic matter, pH, currents, and the type and number of materials used during sampling) cause highly variable DNA particles. DNA degradation in the water column can last several hours, days, or weeks, depending on the biotic and abiotic conditions [25]. The quality of DNA also dramatically affects the time it can survive in the water column. Deiner and Altermatt [26] suggested that fish and invertebrate genetic material can be found ± 10 km from their natural habitat.
Rivers integrate the signals of aquatic and terrestrial vertebrates since water can transport material from the entire catchment, and eDNA accumulates inside water bodies [26]. In this study, a few organisms identified utilizing eDNA from water samples belong to terrestrial organisms, such as Aves and Mammalia. This result can be explained by the contact of these terrestrial organisms with water or by the transport of DNA from the encompassing terrestrial surface into the river.
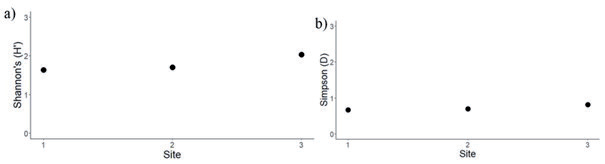
The Shannon-Wiener diversity index (H‘) was generally negatively correlated with the Simpson dominance index (D). The diversity index H‘ ranged from 1.63 to 2.03 (moderate diversity), while the dominance index (D) ranged from 0.67 to 0.81 (high dominance) (Fig. 4). The overall D was close to 1, indicating that a taxon was dominant across the whole study area [27]. The study‘s results described an unstable condition, especially point 3. The read sequence detected from eDNA water samples varied significantly between the three sites (ANOSIM on relative abundance (%) by site: R = 0.43, p-value < 0.05). Organisms identified compositions that were separated but strongly overlapped between sites (R = 0.25-0.50). The high diversity at point 3 is influenced by its location near the river mouth, so more organisms are detected. These include freshwater organisms carried by rivers upstream and marine organisms carried into the river mouth during high tide [28, 29].
Water Quality
Table 1 shows some water quality parameters at the 3 sampling locations. The high TSS value can be caused by several factors, such as high river currents from the upstream area during heavy rains, thereby increasing the amount of run-off entering water bodies [22]. In contrast to points 2 and 3, point 1 has a natural river wall without a constructed retaining wall. Although this area can be used as a riverbank green belt, the condition of the riverbank bordering the land has the risk of increasing erosion, which impacts high sedimentation. Higher amounts of suspended solids increase surface water temperatures because the sediments absorb heat from sunlight, depleting dissolved oxygen (DO). Moreover, a higher amount of suspended sediment also harms fish and invertebrates in the vicinity because it clogs the spawning habitat and ultimately makes breeding difficult [22].
Other parameters, such as DO, ammonia, TN, TP, BOD, and COD, generally showed worsening conditions in the downstream area. The DO, ammonia, and BOD parameters did not meet the quality standard for all locations. Ammonia is a compound that usually consists of the degradation process of a toxic nitrogen substance. Higher ammonia values can harm fish [30]. However, it can serve as a nutrient in small concentrations for algal overgrowth [31]. Research also shows that in the Ciliwung River, the phytoplankton diversity index is decreasing and the dominance index is getting higher [32].
Table 1.
Water quality at the sampling locations.
High levels of pollutants from human activities can flow into the river through point-source and non-point-source pollutants. Land use in trade areas, settlements, and agriculture significantly affects the increase in total phosphorus and BOD [33-36]. Increasing domestic waste potential from the high population in Jakarta contributes to organic pollutants such as BOD, COD, and TSS. BOD increases due to the biodegradation of inorganic materials that exert oxygen stress in bodies of water [37]. Low levels of oxygen in the waters or commonly called hypoxia, will impact fish mortality [38]. The death of aquatic biota will affect the balance of the food chain and the increasing invasive species population (Havel et al. 2015). Water quality parameters such as pH, TN, TP, and NH3-N are important factors that determine the presence of aquatic biota [17]. In high pollutant conditions, species derived from fungi, protists, flagellates, and other microscopic animals tend to be easy to find [18].
The upstream area tends to have a higher abundance of macroinvertebrates than the middle and downstream areas [28]. In contrast, the whole organisms detected at sampling points 1, 2, and 3 were 22, 24, and 28 classes, respectively. The highly detected genetic material in point 3 is presumably caused by swift river currents from upstream to downstream. Different sampling points in this study can provide an overview of the relationship in different river ecosystem conditions: natural, normalized, and estuary. Although the estuary ecosystem tends to have the lowest genetic diversity based on the consideration of deteriorating water quality, this ecosystem has high potential due to various factors that tend to be complex. Each region’s potential for genetic diversity has its peculiarities. Therefore, changes in water quality in aquatic biota can impact genetic diversity in an aquatic ecosystem [29].
Conclusions
A total of 22, 24, and 28 classes of organisms were detected at sampling points 1, 2, and 3, respectively. A few organisms identified by eDNA belong to terrestrial organisms. The taxonomic composition was dominated by Coscinodiscophyceae, followed by Insects, Monogononta, Mammalia, Mamiellophyceae, and Polychaeta. The diversity index H’ ranged from 1.63 to 2.03 (moderate), while the dominance index (D) ranged from 0.67 to 0.81 (high). Degraded water quality is related to the abundance of biota with a high tolerance for pollutants and toxic materials. The number of classes is increasing downstream since various factors are causing the high abundance of classes in most downstream areas.

