

Introduction
Early studies on plant diversity primarily focused on species inventories, habitat data collection, and vegetation classification within standardized sampling protocols [1]. These descriptive approaches helped reveal geographic patterns and distribution of diversity. While useful for species distribution modeling, phytogeographic classification, and plant resource surveys, they often lacked more profound analysis of how biodiversity interacts with environmental factors and ecosystem productivity [2]. Researchers have pointed out that traditional survey-based studies fail to integrate macro-environmental factors and community structure, limiting our understanding of the mechanisms driving ecosystem structure, function, and biodiversity patterns [3].
Early BEF studies involved controlled experiments in laboratories, greenhouses, and experimental fields, leading to the development of theoretical concepts such as the “insurance effect” and “overyielding effect”. However, these studies, which were often based on artificial designs with strong explanatory power, were limited by their small-scale settings, typically confined to laboratory microenvironments or experimental plots of less than 10,000 m² [4]. As a result, the conclusions drawn could not be easily extrapolated to larger scales, limiting the applicability of BEF findings to broader ecosystem management. To address this gap, large-scale BEF studies are increasingly needed to inform biodiversity conservation and ecosystem sustainability planning. These studies offer valuable insights into diversity patterns and their relationship with productivity, thereby enhancing ecosystem management. Recent advancements in networked experiments and data collection have extended the applicability of BEF theory. Research across various species groups ‒ such as crops, birds, marine organisms, and forests ‒ has revealed quantitative links between diversity patterns and ecosystem functioning across environmental gradients and large-scale spatial heterogeneity.
Alongside the expansion of spatial scales, BEF research has increasingly focused on species’ functional traits. The measurement and statistical analysis of plant functional traits, in particular, have provided insights into the mechanisms connecting species’ physiological characteristics with ecosystem functioning [5, 6]. This has enhanced the explanatory power of BEF theory and advanced our understanding of plant functional economics [7, 8].
The Qilian Mountains National Park is a critical high-altitude pastoral region in China, with ecosystems that are essential for the sustainable livelihoods of local communities [9]. The Plateau also serves as a key ecological security barrier and biodiversity hotspot. Grassland ecosystems, which cover the largest area, are foundational to the region’s ecological functions, supporting pastoral systems, protecting biodiversity, and contributing to Asian ecological security. Large-scale BEF research on Qilian Mountains National Park grasslands will not only reveal biodiversity distribution patterns but also identify key factors influencing biodiversity, particularly the variation in species and functional diversity along climate and landscape gradients. Such studies will improve our understanding of how grassland plant diversity responds to climate variability. Recent large-scale surveys have advanced our knowledge of the relationship between grassland diversity and productivity across environmental gradients, reflecting the link between environmental variability and plant community structure and function [10, 11]. However, the role of habitat heterogeneity as an environmental factor remains underexplored [12]. While some studies suggest that ecosystem diversity promotes plant species richness in certain ecosystems, this conclusion has primarily been confirmed in agricultural systems. It remains unclear whether similar patterns exist in alpine grassland ecosystems in the Qilian Mountains National Park. Conducting research in this area will enhance biodiversity regulation at the species level from an ecosystem management perspective.
This study, framed within the large-scale BEF theory, presents an extensive survey of grassland plant communities in the Qilian Mountains National Park. It includes measurements of functional traits such as leaf morphology and plant height to assess species and functional diversity and evaluates aboveground biomass as an indicator of community productivity. Climate factors and landscape diversity indices were used to reflect habitat heterogeneity. The study seeks to answer the following key questions: Does ecosystem diversity at the landscape level promote higher plant diversity? How do environmental changes affect plant diversity, community biomass, and the diversity-productivity relationship? By analyzing these relationships, this research will reveal the patterns of environmental influence on plant diversity and biomass in the Qilian Mountains National Park, clarify the responses of grassland plant diversity to climate and landscape changes, and provide quantitative and empirical support for understanding the links between ecosystem diversity and functioning.
Materials and Methods
Study Area and Sampling Point Setting
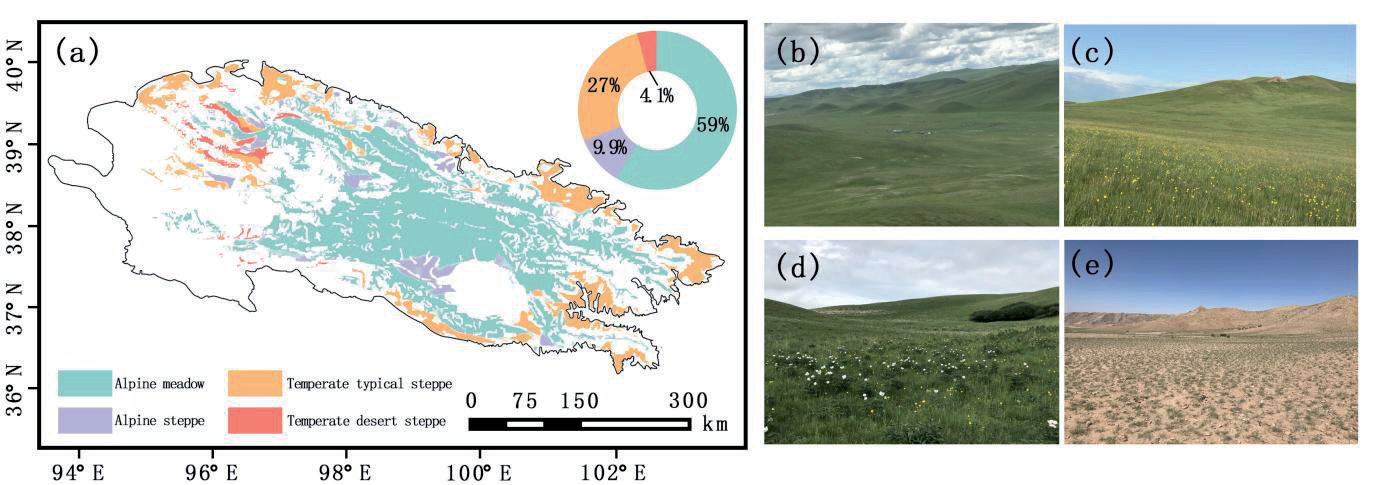
This study was conducted in the Qilian Mountains National Park, located in the southwestern part of China. The region encompasses the entire Qilian Mountains National Park Autonomous Region and Qinghai Province, as well as portions of Gansu Province, covering an area of approximately 2.6×10⁶ km² [13]. Its average elevation exceeds 4,000 m. The Qilian Mountains National Park is home to the world’s largest and most characteristic alpine vegetation ecosystems, playing a critical role as an ecological security barrier for both China and Asia. Additionally, it is recognized as a global hotspot for biodiversity conservation [14]. From July to August in 2020 and 2021, a north-south transect was established (Fig. 1). The period of July-August has been identified as the time when grass biomass is at its most abundant in the study area. It is therefore the most scientifically sound period in which to study the relationship. This study was conducted on sampled leaves, which were not significantly affected by year-on-year differences. As a result, the amount of monitoring data collected over two years was deemed to be sufficient. A plot-based sampling method was used, with each plot covering 100 m². The plots were divided into shrub and herb layers. In the shrub plots, data were collected on species, crown diameter (length and width), basal diameter, height, and individual count. In the herb plots, species, height, cover, density, and biomass were recorded. Shrub plots measured 5 m×5 m, while herb plots were 1 m×1 m. Herbaceous plants were categorized into functional groups (Gramineae, Cyperaceae, Leguminosae, and other grasses). Aboveground biomass was collected using a ground-level cutting method and weighed (g/m²). For shrubs, branches were collected, and biomass was estimated using a volume-based method to calculate unit-area biomass (g/m²) [15]. The total aboveground biomass of both the herb and shrub layers was summed for each plot. Given that herbaceous vegetation is the dominant type in the study area, the accumulated aboveground biomass at the end of the growing season was used as an estimate of community productivity [16]. A total of 24 shrub plots and 45 herb plots were surveyed, resulting in 97 community survey plots overall [17].
This study was conducted in Qilian Mountain National Park (36°29′-39°42′N, 93°31′-103°00′E), encompassing 5.02×10⁴ km² with elevations spanning 2,600-4,800 m. During July-August 2020-2021, a north-south transect was established to investigate seven dominant vegetation types through stratified random sampling, ensuring proportional representation relative to their spatial distribution. Alpine meadows (32 plots), dominated by Kobresia humilis and Polygonum viviparum, occupied shaded slopes at 3,200-3,800 m, while alpine steppes (28 plots), characterized by Stipa purpurea and Artemisia frigida, were distributed in broad valleys (2,800-3,500 m). Alpine shrublands (24 plots), featuring Potentilla fruticosa (14 plots) and Caragana jubata (10 plots), occurred along river terraces at 3,100-3,700 m. Swamp meadows (9 plots), dominated by Blysmus sinocompressus, inhabited wetlands at 2,900-3,300 m, whereas alpine cushion vegetation (5 plots), comprising Thylacospermum caespitosum, colonized scree slopes at 4,000-4,500 m. Desert steppes (4 plots), represented by Sympegma regelii and Reaumuria soongorica, occupied arid south-facing slopes at 2,600-3,000 m, and alpine scree vegetation (3 plots) dominated by Saussurea medusa occurred in periglacial zones at 4,200-4,800 m. Each 100 m² plot employed a nested design: four 5 m×5 m shrub quadrats for measuring crown dimensions, basal diameter, and density of woody species, and nine 1 m×1 m herbaceous quadrats stratified by functional groups (Poaceae, Cyperaceae, Fabaceae, and Forbs). Aboveground biomass was quantified using standardized protocols: herbaceous plants were clipped at ground level, sorted by functional group, and weighed fresh (ME204E balance, ±0.1 g) before oven-drying at 65ºC, while shrub biomass was extrapolated from representative branches using volume-proportion methods validated by 3D laser scanning (Faro Focus S70). Spatial coordinates of 105 plots (420 shrub quadrats, 945 herbaceous quadrats) were recorded with differential GPS (Trimble R8s, ±1 cm + 1 ppm accuracy), aligning sampling intensity with vegetation type prevalence.
Plant Sample Survey and Determination of Plant Functional Traits
This study selected average plant height, individual canopy cover, and leaf traits as functional indicators based on field measurements. Since leaves are the primary sites for photosynthesis and transpiration, their functional traits, or economic spectrum, can effectively represent key ecosystem functions, such as nutrient cycling and productivity [18-20]. The quantification of leaf shape traits typically relies on the leaf length-to-width ratio [21-23], while the analysis of leaf edge morphology can reveal adaptations for temperature regulation and water conservation, essential for survival in high-temperature, cold, and arid environments [24]. Three leaf traits were chosen and quantified for their role in water conservation: the leaf length-to-width ratio, the position of the leaf’s widest point, and leaf margin characteristics. The leaf length-to-width ratio was assigned values as follows: less than 1 = 1, equal to 1 = 2, slightly greater than 1 = 3, and much greater than 1 = 4. A ratio significantly greater than 1, indicative of needle-like leaves, received the highest value due to the dense arrangement of stomata. The position of the leaf’s widest point was assigned a value of 3 if located near the leaf base (suggesting higher water conservation), 2 if centered, and 1 if near the leaf tip. For leaf margin features, values were assigned as follows: deeply lobed = 1, semi-lobed = 2, serrate = 3, and entire margin = 4. It is generally believed that the degree of lobing reflects the openness of water use; entire leaves, with a lower perimeter-to-area ratio, are less exposed to the environment and therefore more water-conserving.
Fig. 1.
Sampling location distribution, landscape diversity analysis, and typical landscape photos of the Qilian Mountains National Park study area.
Based on these traits, a composite leaf morphology index was developed to characterize leaf shape, using the following formula:
(1)
Leaf morphological traits for each plant species were derived from the *Flora of China*, and these results were then used to calculate functional diversity.
Species Diversification
To assess the diversity characteristics from different perspectives, this study employed three widely used species diversity indices: the Shannon-Wiener Diversity Index (SWD), the Inverse Simpson Index (ISP), and the Pielou Evenness Index (EVE). The formulas for these indices are as follows:
In these formulas, \( Pi \) denotes the proportion of individuals belonging to species \( i \) within the total population, \( Ni \) is the number of individuals of species \( i \), \( N \) is the total number of individuals in the community, and \( S \) is the total number of species. Taxonomic diversity of the plant communities was calculated using the “vegan” package in R, based on a field survey plant database. Data collection and organization were performed using Excel 2019.
Functional Versatility
Species survey and trait data were standardized, including information on family, genus, and functional traits. A species-by-trait matrix was then constructed, with species represented as columns and functional traits as rows. To quantify functional diversity, three indices were selected: Functional Richness (FRich), Functional Evenness (FEve), and Functional Divergence (FDiv). Functional Richness (FRich) quantifies the extent to which species occupy ecological niche space, reflecting the degree of ecological space utilization [25, 26]. Functional Evenness (FEve) measures the evenness of species trait distribution within functional space, incorporating species relative abundance to reflect resource utilization. Functional Divergence (FDiv) evaluates the dispersion of species’ functional traits within functional space, considering relative abundance and reflecting resource partitioning and interspecies competition. Functional diversity was calculated using the “FD” package in R (version 4.2.0). Additionally, the Community-weighted Mean (CWM) index was used as a supplementary measure. CWM represents the weighted average of functional traits within a community, where species abundance serves as the weight, providing a community-level trait composition [27].
where trait i is the trait value of species i.
Regional Climate Environmental Data
The meteorological data used in this study were sourced from two public databases: the Climate Anomaly Detection System of the National Oceanic and Atmospheric Administration (NOAA), which provides monthly temperature (T) assimilation data (http://iridl.ldeo.columbia.edu/sources/), and the Global Precipitation Climate Center, which offers monthly precipitation assimilation reanalysis data (http://mpimet. mpg.de/cdi). Both temperature (T) and precipitation (P) data are in NetCDF (Network Common Data Form) format, which stores multidimensional numerical matrices. The data have a temporal resolution of 30 days and a spatial resolution of 0.5°, covering the period from 2000 to 2016 (17 years, 204 months). The data were processed using QGIS 3.22. Raster layers were opened, and a table file containing the latitude and longitude coordinates of the sampling locations was overlaid onto the point vector layer. Raster data extraction tools were then used to retrieve temperature and precipitation values for each sampling location. The annual averages (T_mean, P_mean), long-term trends (calculated using least squares linear regression) (T_rate, P_rate), and coefficients of variation (T_CV, P_CV) were computed. The influence of regional climatic factors on plant diversity was then analyzed. Calculations and statistical analyses were conducted using R software.
Diversity of Regional Landscapes
The land cover change data for the study area were provided by the Resource and Environmental Science and Data Center of the Chinese Academy of Sciences (http://www.resdc.cn/). Land cover classification information was derived from 30-m resolution mosaicked Landsat satellite imagery for the year 2020. The data were imported into QGIS Desktop 3.30.2, and a buffer zone analysis with a 20 km radius was conducted. The vector boundary of the buffer zone surrounding the sampling points was used as a mask to clip the land use data. Landscape heterogeneity and structural dynamics in the Qilian Mountains National Park were quantified using the Landscape Shannon-Wiener Diversity Index (LSWD). Higher LSWD values indicate greater heterogeneity of ecosystem types and higher landscape diversity.
LSWD was calculated using the following formula, where Pi represents the proportion of each patch in the landscape (or the proportion of that patch type in the total number of landscape grid cells), and i refers to the specific land use type. The Moving Windows method in Fragstats 4.2 was applied, with a spatial grain size of 2 km, to visualize the Shannon-Wiener Diversity Index.
Statistical Analysis of Data
This study employed a hypothesis-driven approach to optimize statistical modeling procedures. The analysis commenced with Box-Cox transformations (optimal λ values ranging from 0.12-0.35) on biomass and environmental variables to improve distribution properties, followed by normality verification using Shapiro-Wilk tests (W≥0.96, P>0.05) and Q-Q plots. Scatterplot matrices with locally weighted regression (LOESS) curves were generated to characterize variable relationships. Pearson correlation analysis was applied to linearly associated variable pairs (e.g., precipitation-species richness), with model assumptions validated through residual plots (residuals vs. fitted values) and Durbin-Watson tests (DW = 1.82-2.15). For detected nonlinear relationships (e.g., temperature-biomass), generalized additive models (GAMs) with thin-plate spline smoothing (effective degrees of freedom = 2.8-4.1, P<0.01) were implemented, while multicollinearity was controlled via variance inflation factors (VIF<3.5). Structural equation modeling (SEM) elucidated cascading climate-functional trait-biomass pathways (comparative fit index = 0.94, root mean square error of approximation = 0.05). All analyses incorporated bootstrap resampling (n = 1,000 iterations) for parameter confidence intervals and robustness verification through Huber M-estimation regression (β coefficient variation<15%) [28]. Data processing and modeling were conducted in the R 4.3.0 environment using the mgcv, lavaan, and glmnet packages.
Results and Discussion
Spatial Distribution of Climatic Factors and Landscape Diversity and their Relationship with Plant Functional Traits
In the north-south transects, the warm shrubland in Qinghai Province recorded the highest average temperature. The regions with the fastest temperature change rates were the warm shrubland and alpine meadows in the Qilian Mountains National Park Autonomous Region. The alpine grassland in Qinghai Province exhibited the highest temperature coefficient of variation. The site with the highest average precipitation was the warm shrubland and alpine meadows in Qilian Mountains National Park, while the area with the greatest precipitation rate of change was the mountain meadows in Qinghai. The marsh meadows in Qilian Mountains National Park had the highest precipitation coefficient of variation. The highest landscape diversity index was found in the mountain meadows of Qinghai.
Fig. 4.
The relationship between temperature factors (T_mean, T_CV, T_rate) and the length-to-width ratio (LWR), the width position (WP), and leaf edge (LE), and the relationship between precipitation factors (P_mean, P_CV, P_rate) and the length-to-width ratio (LWR), the width position (WP), and leaf edge (LE).
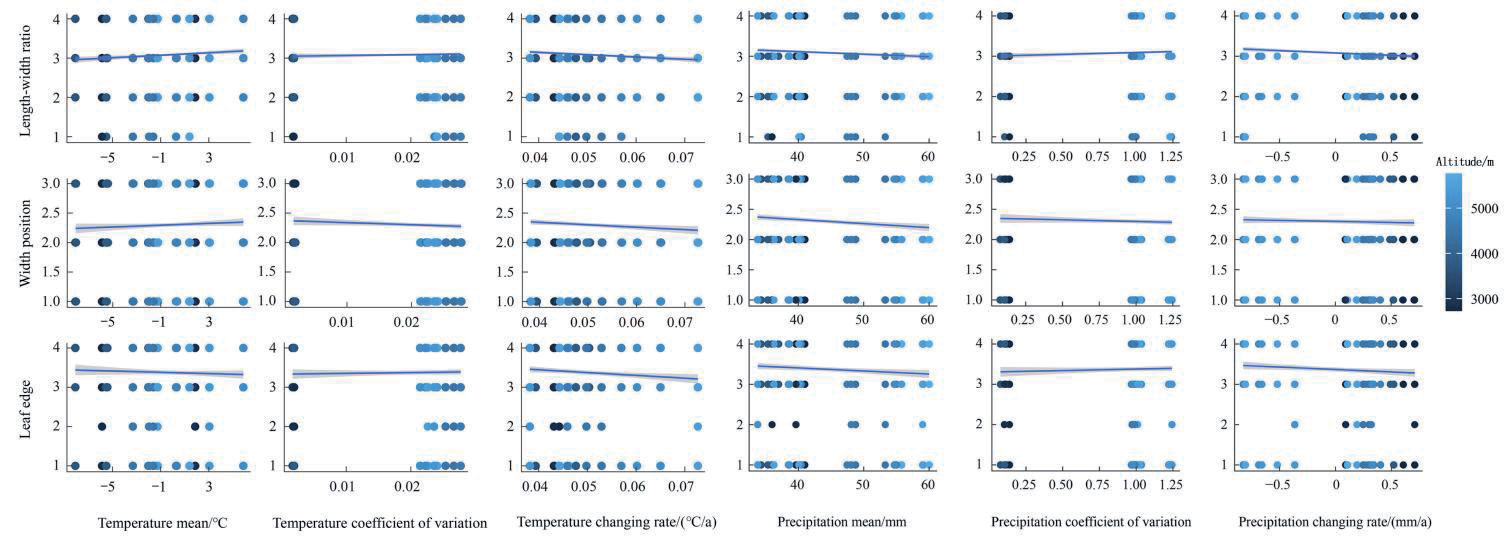
Fig. 5.
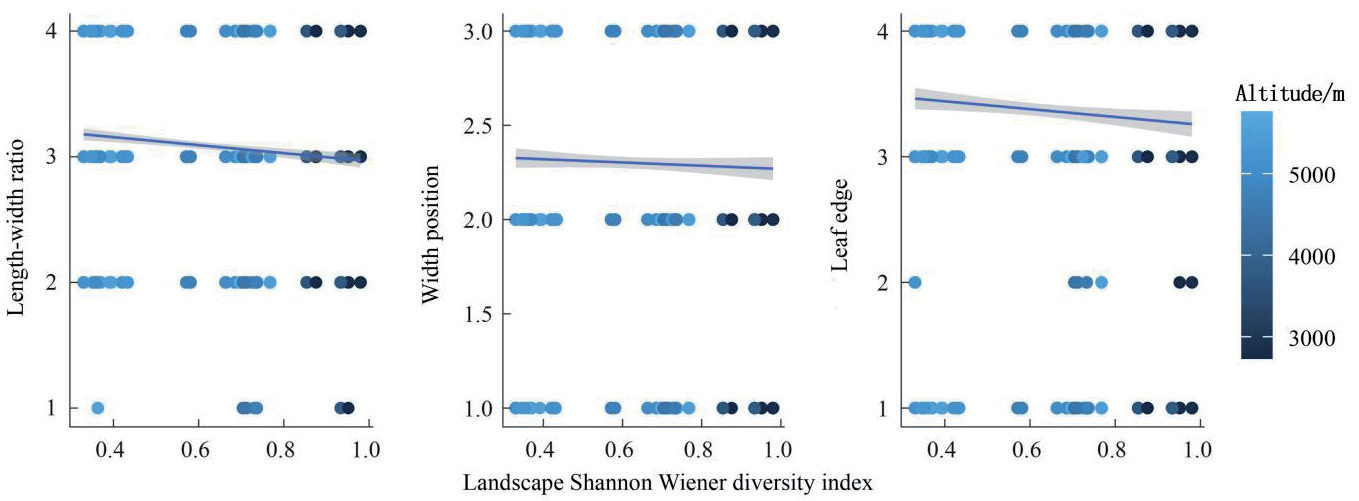
The relationship between landscape diversity (LSWD) and the length-to-width ratio (LWR), the width position (WP), and leaf edge (LE).
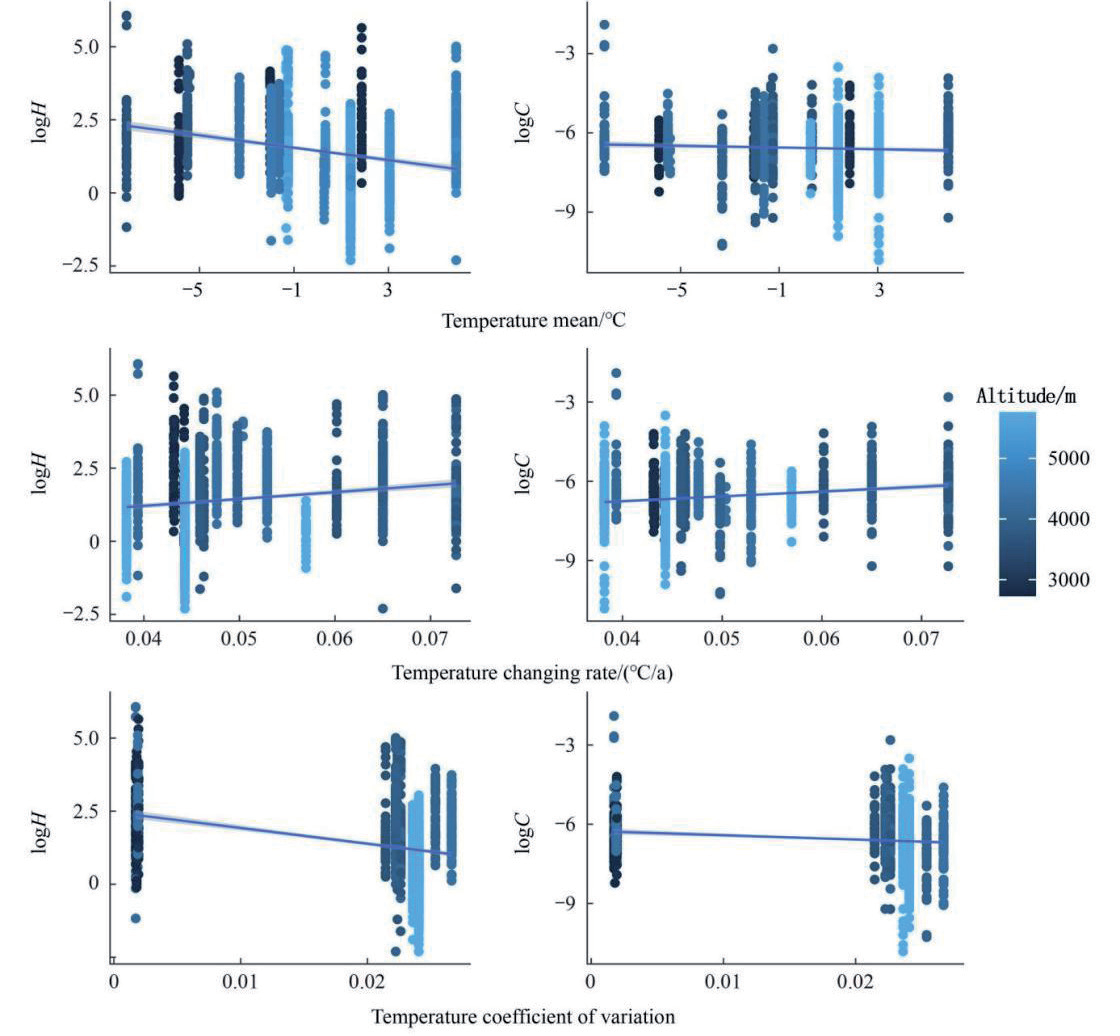
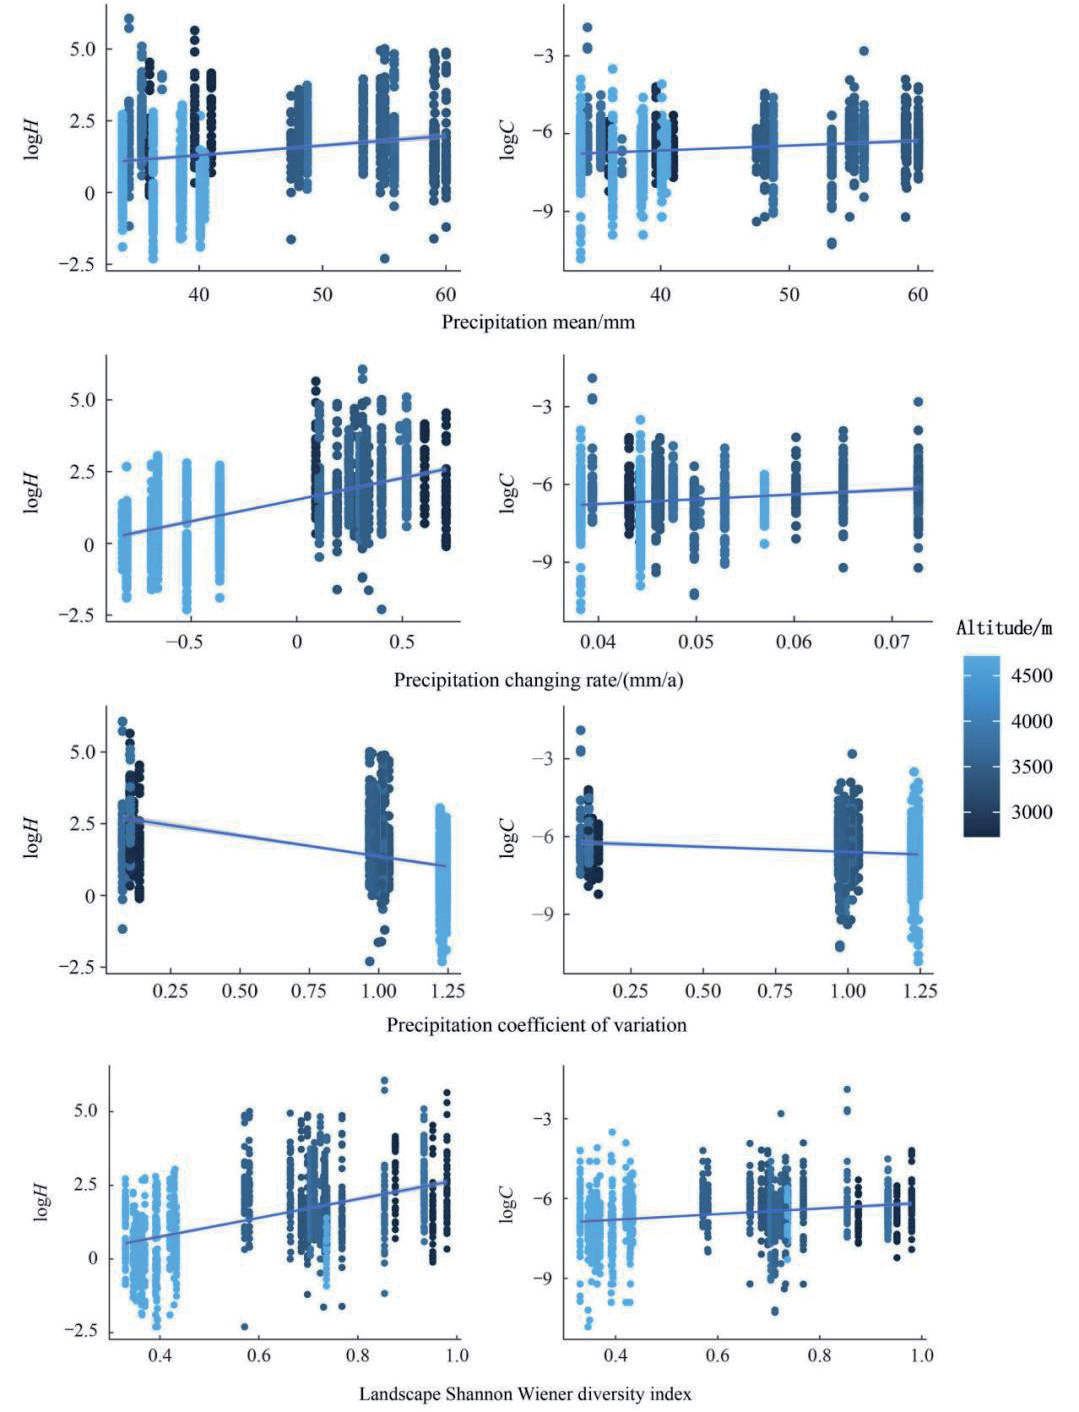
Average plant height and single-leaf cover were positively correlated with P_mean, T_rate, P_rate, and LSWD, with both increasing as the temperature and precipitation change rates, as well as the landscape diversity index, increased (Fig. 2 and Fig. 3). However, T_mean, T_CV, and P_CV had an inhibitory effect on plant height and leaf cover. Increased values of T_mean, T_CV, and P_CV were detrimental to plant growth (Fig. 3).
Leaf length-to-width ratio, the position of the widest leaf, and leaf margin morphology did not exhibit consistent patterns with long-term average temperature and precipitation. These traits were negatively correlated with the change rates of long-term average temperature and precipitation, following similar trends to the coefficients of variation of these factors. Additionally, they were negatively correlated with landscape diversity. The leaf length-to-width ratio showed a highly significant correlation with the monthly average values and change rates of temperature and precipitation (P<0.001) and a significant correlation with the precipitation coefficient of variation (P<0.05). The position of the widest leaf was highly significantly correlated with long-term average precipitation (P<0.001) and significantly correlated with the temperature change rate (P<0.05). Leaf margin morphology showed highly significant correlations with both long-term average precipitation and temperature change rate (P<0.001) and significant correlations with the precipitation change rate and landscape diversity index (P<0.05) (Fig. 4 and Fig. 5).
Climate Factors and Landscape Diversity in Relation to Grassland Diversity
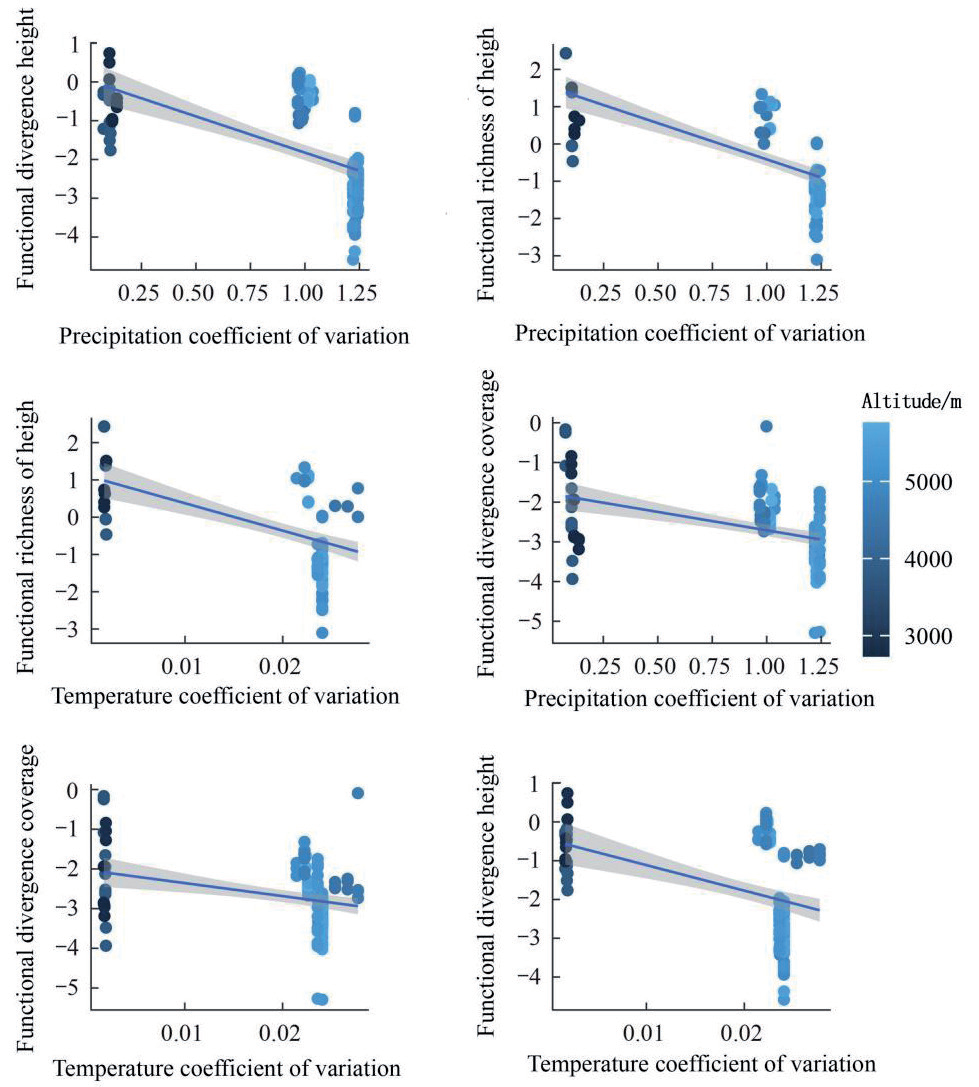
The results indicate that increased regional climate variability hinders the growth of community species diversity. Specifically, the coefficients of variation for precipitation (P) and temperature (T) were significantly negatively correlated with most functional diversity indices in alpine grassland plant communities (P<0.05). For example, P_CV showed strong negative correlations with FRICHht, FDIVht, and FDIVcov (P<0.001), with Pearson correlation coefficients of −0.64, −0.57, and −0.42, respectively. Similarly, T_ CV exhibited significant negative correlations with FRICHht, FDIVht, and FDIVcov, with Pearson correlation coefficients of −0.49, −0.41, and −0.30, respectively (Fig. 6).
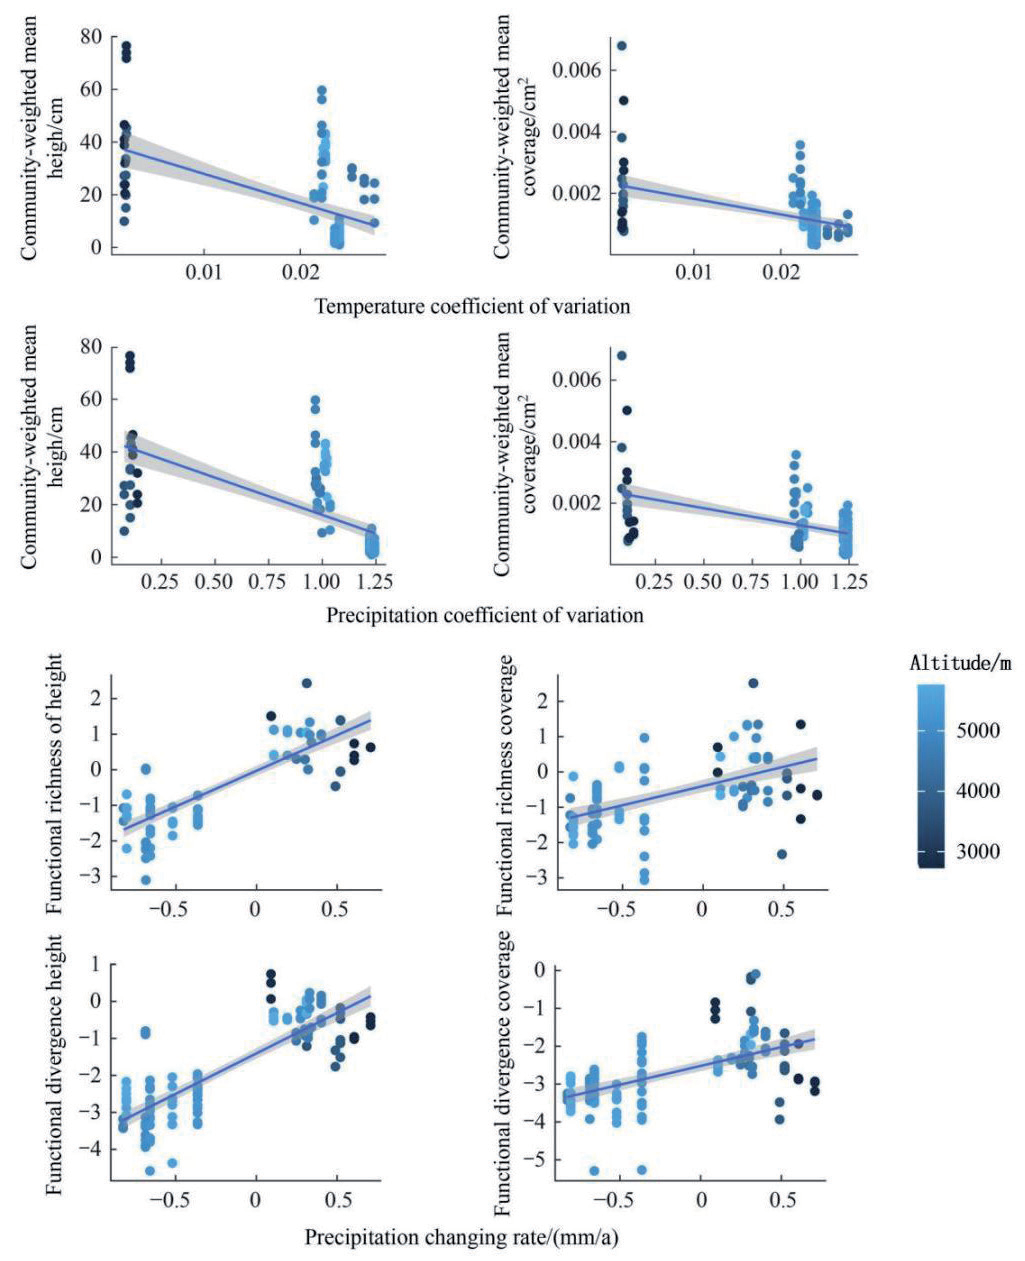
In contrast, regional climate variability did not significantly affect species diversity indices. No significant correlations were found between ISP, SWD, or EVE (P>0.05). Both temperature and precipitation variability were significantly negatively correlated with community CWMht and CWMcov (P<0.001). The Pearson correlation coefficients for P_CV with CWMht and CWMcov were −0.65 and −0.46, respectively, while those for T_CV were −0.48 and −0.43 (Fig. 7).
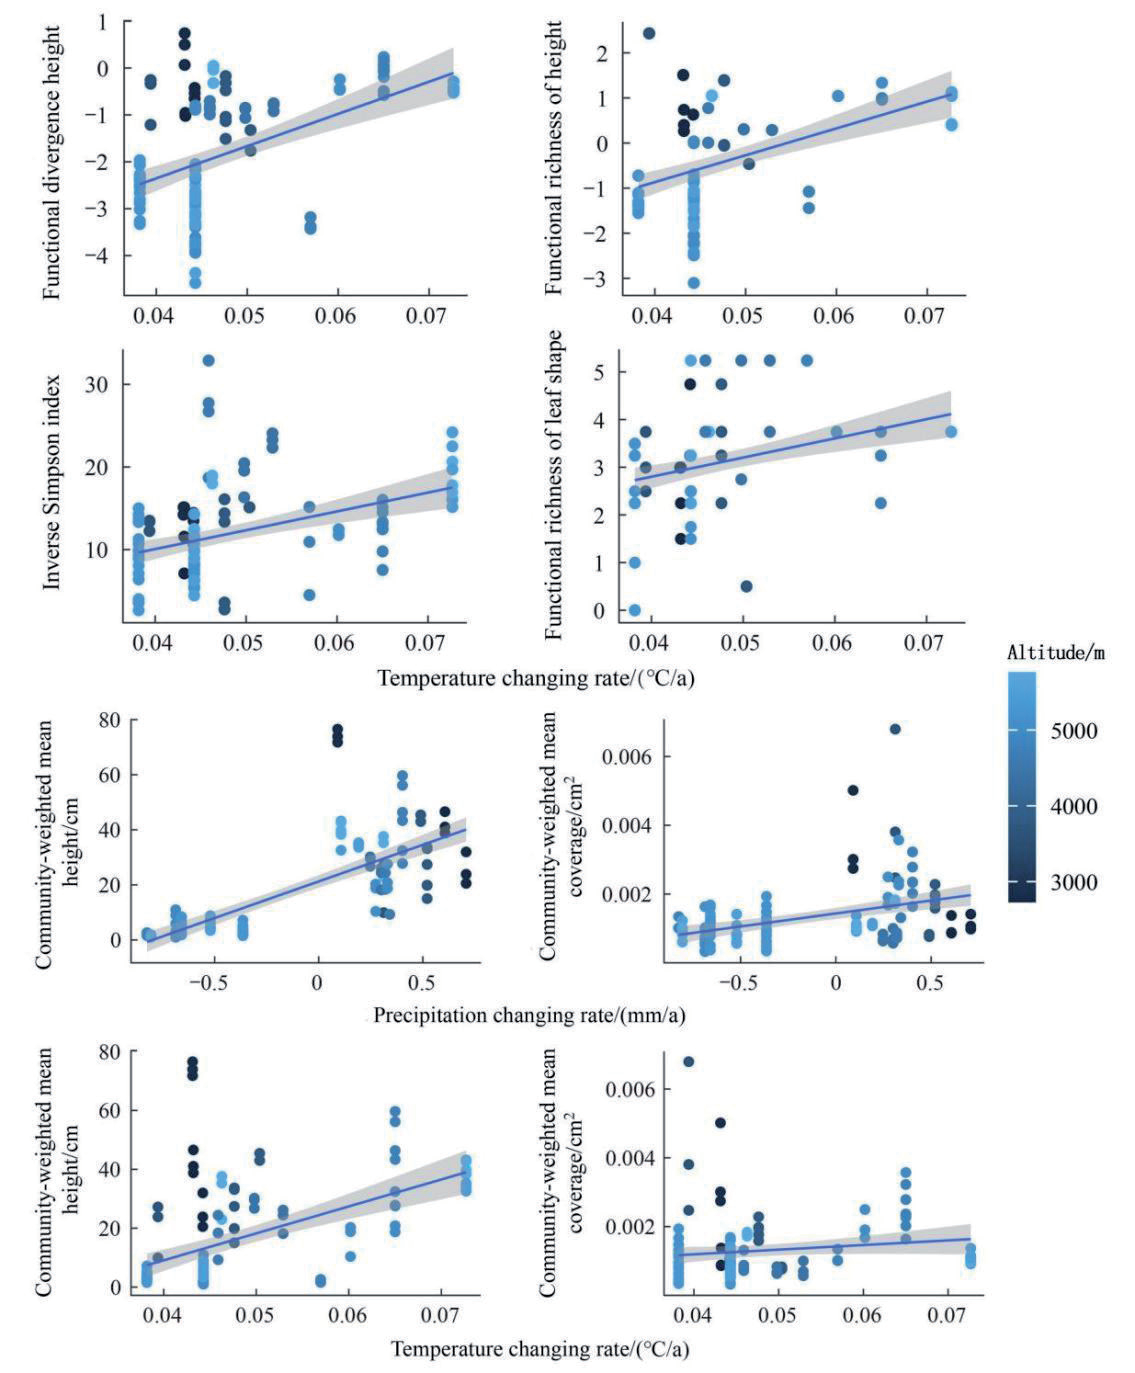
The relationships between T_rate, P_rate, and community species and functional diversity indices were generally positive. Except for FEVE, both T_rate and P_ rate showed significant positive correlations with most diversity indices (P<0.05). Regression analysis, based on higher fit values, revealed that P_rate was strongly positively correlated with FDIVht, FRICHht, FDIVcov, and FRICHcov, with Pearson correlation coefficients of 0.82, 0.81, 0.56, and 0.50, respectively (P<0.001) (Fig. 7). Similarly, T_rate exhibited significant positive correlations with FDIVht, FRICHht, ISP, and FRICHleaf, with Pearson correlation coefficients of 0.51, 0.47, 0.39, and 0.37, respectively (P<0.001) (Fig. 8).
Notably, a comparison of regression fits and Pearson correlation coefficients indicated that functional diversity indices are more sensitive to climate change rates than species diversity indices, with generally stronger correlations. Both T_rate and P_rate showed significant positive correlations with CWMht and CWMcov (P<0.001), suggesting that higher grassland climate change rates promote greater average plant height and leaf coverage. The Pearson correlation coefficients for P_rate-CWMht, P_rate-CWMcov, T_rate-CWMht, and T_rate-CWMcov were 0.86, 0.45, 0.53, and 0.23, respectively (Fig. 8).
Fig. 7.
The relationship between the variability of climatic factors (P_CV, T_CV) in grasslands of the Qilian Mountains National Park and community-weighted mean (CWMht, CWMcov) along the altitude gradient, and the relationship between the precipitation changing rate (P_rate) in grasslands of the Qilian Mountains National Park and functional diversity (FDIVht, FRICHht, FDIVcov, FRICHcov) along the altitude gradient.
Regression analysis of LSWD with diversity indices revealed that landscape diversity is positively correlated with species diversity and most functional diversity indices but negatively correlated with functional evenness. The Pearson correlation coefficients, arranged from positive to negative, were as follows: FRICHht (0.77), FDIVht (0.72), FDIVcov (0.50), ISP (0.46), FRIChcov (0.43), SWD (0.39), FRICHleaf (0.27), FEVEcov (−0.23), and FEVEht (−0.35) (Fig. 9). These results suggest that landscape diversity has a more pronounced effect on functional diversity than on species diversity.
Climate Factors and Landscape Diversity in Relation to Grassland Community Biomass
Landscape diversity index (LSWD) was strongly positively correlated with community biomass (P<0.001), with a Pearson correlation coefficient of 0.81. Both temperature coefficient of variation (T_CV, R² = 0.60) and precipitation coefficient of variation (P_ CV, R² = 0.72) are significantly negatively correlated with community biomass, with Pearson correlation coefficients of −0.77 and −0.85, respectively. T_mean shows a strong negative correlation with community biomass, while P_rate exhibits a significant positive correlation. The Pearson correlation coefficients between these pairs of variables are −0.52 and 0.70, respectively (Fig. 10).
Fig. 8.
The relationship between the temperature change rate (T_rate) in grasslands of the Qilian Mountains National Park and species diversity (ISP), functional diversity (FDIVht, FRICHht, FRICHleaf) along the altitude gradient, and the relationship between the climatic factors change rate (P_rate, T_rate) in grasslands of the Qilian Mountains National Park and community-weighted mean (CWMht, CWMcov) along the altitude gradient.
Diversity in Relation to Community Biomass
Our results reveal interspecific divergence in climate response strategies: while most species exhibit biomass reduction under high climate variability (T_CV/P_ CV), certain taxa may capitalize on stress-induced competitive release. For instance, the dominance of low-stature Kobresia pygmaea (CWMht decile >90%) in high-T_CV zones suggests thermal avoidance adaptations, whereas deep-rooted Stipa purpurea populations show unexpected biomass stability during precipitation fluctuations (FDIVcov >0.4). Future studies should employ trait-based demographic monitoring to disentangle whether these patterns reflect true adaptive advantages or simply differential mortality thresholds.
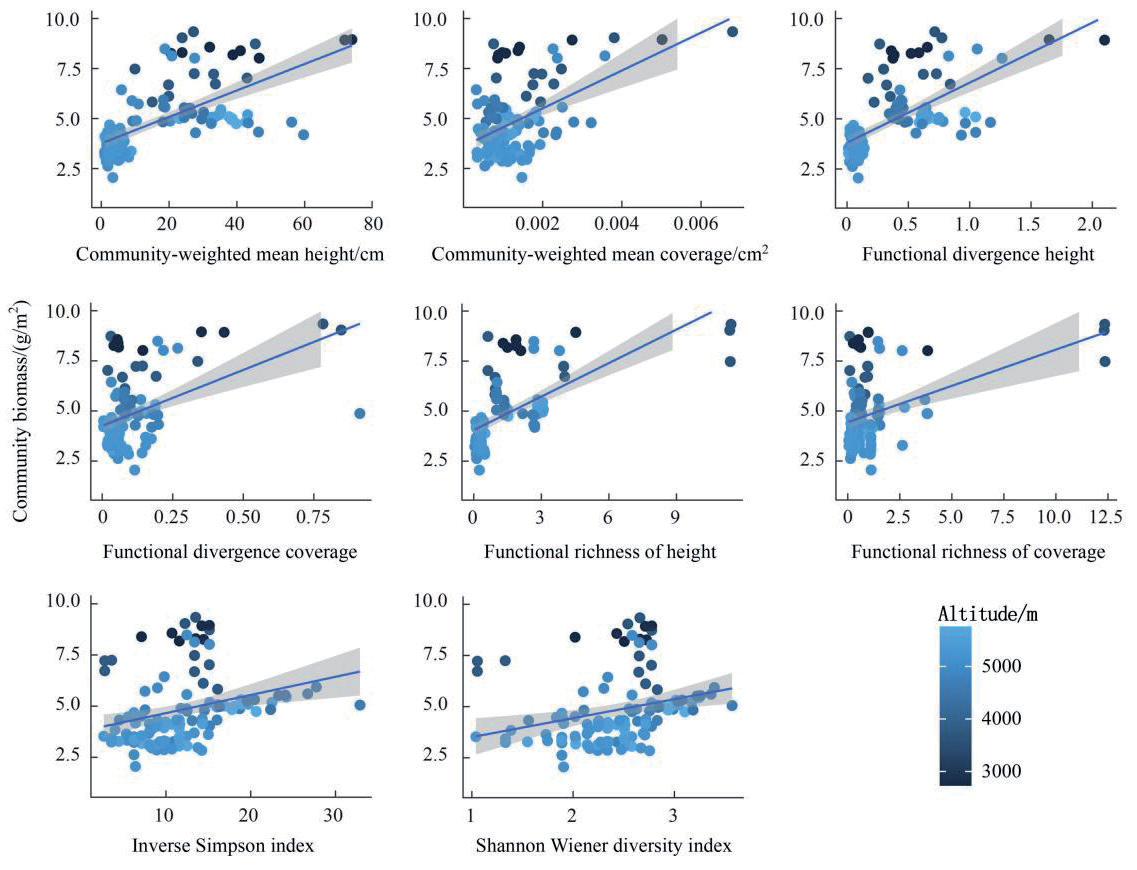
Statistical analysis confirmed the positive effect of grassland diversity on biomass. Four diversity indices did not yield significant results in the regression analysis. With the exception of FEVEht and FEVEcov, all other species and functional diversity indices showed significant or highly significant positive correlations with community biomass. The Pearson correlation coefficients for biomass with the following variables are provided in parentheses: CWMht (0.68), CWMcov (0.51), FDIVht (0.67), FDIVcov (0.46), FRICHht (0.65), FRICHcov (0.40), ISP (0.27), and SWD (0.26) (Fig. 11).
Fig. 9.
The relationship between the landscape diversity index (LSWD) and the species diversity (SWD, ISP), as well as functional diversity (FRICHht, FDIVht, FRICHleaf, FDIVcov, FRIChcov, FEVEcov, FEVEht).
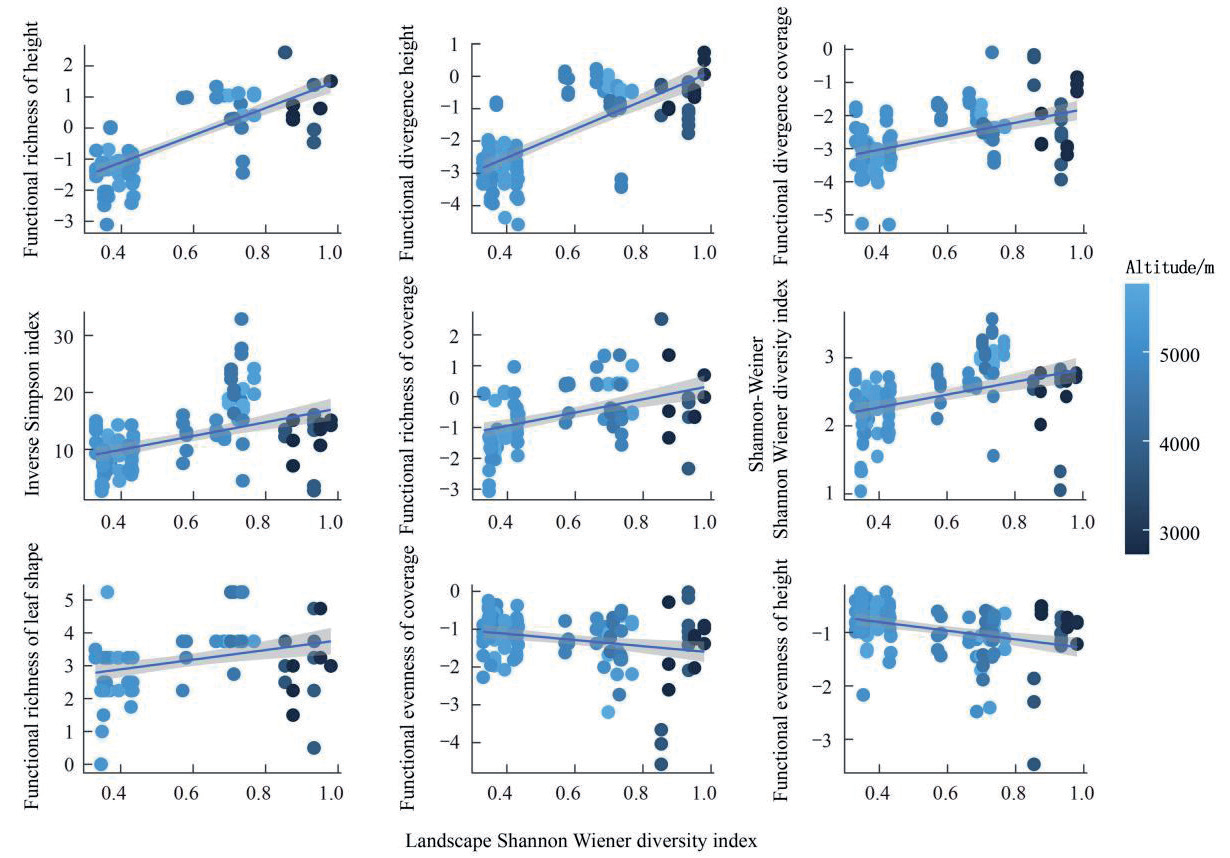
Fig. 10.
The relationship between climatic factors (T_CV, P_CV, T_mean, P_mean), landscape diversity (LSWD), and community productivity, represented by community biomass (Biomass), in grassland in the Qilian Mountains National Park.
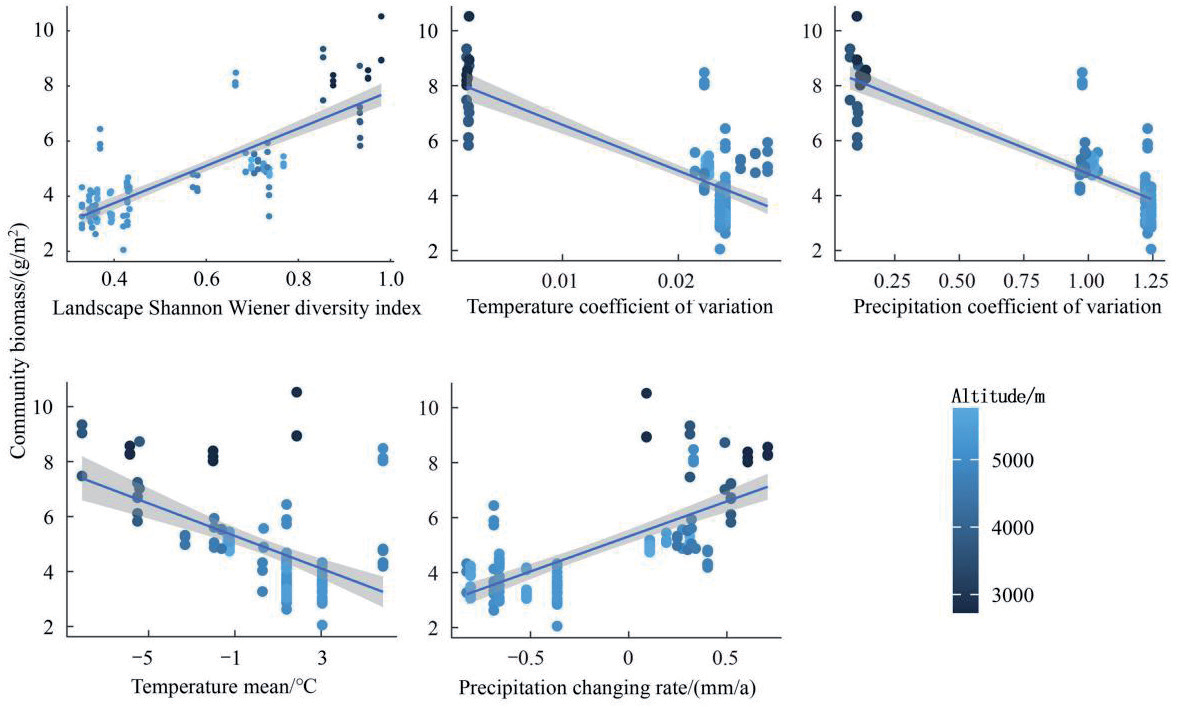
Fig. 11.
The relationships between species diversity (SWD, ISP), functional diversity (FDIVht, FDIVcov, FRICHht, FRICHcov), communityweighted mean (CWMht, CWMcov), and community productivity, represented by community biomass (Biomass), across an altitudinal gradient of grassland in the Qinghai-Qilian Mountains National Park.
Discussion
Under the Biodiversity-Ecosystem Functioning (BEF) framework, we conducted a comprehensive species survey across diverse grassland ecosystems in the eastern Qilian Mountains National Park. These ecosystems included alpine grasslands, alpine meadows, mountain meadows, shrub-grasslands, and marsh meadows, spanning elevations from 3000 m to 5000 m. Aboveground biomass was measured as a proxy for vegetation productivity. Regional climate data for the sampling sites were extracted, and landscape diversity indices were calculated to evaluate the diversity of surrounding ecosystems. We analyzed functional traits, including leaf morphology, plant height, and leaf size, to investigate patterns of species and functional diversity along environmental gradients and to identify key environmental drivers of these patterns.
Our results revealed that, with the exception of functional evenness (FEV), diversity indices were negatively correlated with the coefficient of variation of regional climate factors. This finding aligns with Liu et al. [29], who reported that extreme climatic events threaten plant diversity in the Qilian Mountains National Park, leading to species loss and reduced diversity. The increasing trends of warming and wetting in the region have significantly elevated the frequency of extreme climatic events, emphasizing the need for large-scale biodiversity monitoring and adaptive management strategies [30, 31]. Rapid climate change is driving significant environmental shifts, increasing community instability, and resulting in less predictable succession patterns [32]. Communities with higher biodiversity and more complex internal structures exhibit stronger negative feedback mechanisms, promoting greater stability and slowing the pace of community expansion. At the community level, this supports earlier conclusions that the rate of climate change in the Qilian Mountains National Park inversely correlates with macro-vegetation changes, consistent with conservation patterns observed in inorganic environments such as glaciers, deserts, and water bodies [33].
Regarding the relationship between landscape diversity and species diversity, Yang et al. [34] identified a strong correlation in the Giant Panda National Park on the southeastern edge of the plateau. Similarly, our findings demonstrate that landscape diversity is closely linked to species diversity. Heterogeneous and complex habitats provide favorable ecological conditions, supporting species variation and evolutionary processes within populations and communities. This promotes the development of adaptive functional traits and the emergence of higher-level biological communities [35, 36]. While this relationship was first observed in agricultural ecosystems and later confirmed in mountain ecosystems [37], our study extends its applicability to grassland ecosystems.
Additionally, we observed a significant positive correlation between landscape diversity and community biomass, suggesting that higher landscape diversity enhances plant biodiversity and promotes biomass accumulation. The large-scale, spatiotemporal results under the BEF framework suggest that species richness drives the diversification of ecosystem types [38]. Previous BEF research in grassland ecosystems has shown that high-diversity ecosystems not only achieve greater productivity but also experience an increasingly positive effect of biodiversity on productivity over time [39-41]. This phenomenon is attributed to both selection and complementarity mechanisms [42].
Despite these insights, the study has limitations due to the relatively narrow set of functional traits analyzed. Important plant traits, such as morphological, life-history, and physiological-biochemical characteristics, were not comprehensively assessed. While some functional diversity metrics based on leaf morphology showed correlations with environmental gradients, further data collection and integration of additional functional traits are needed. Incorporating broader datasets with environmental variables will improve understanding of the multiscale relationships between plant functional diversity, ecosystem processes, individual trait functions, and macro-vegetation dynamics.
Based on our empirical findings and global ecosystem management best practices, we propose an integrated management framework for Qilian Mountain National Park. First, climate-resilient adaptive management should be prioritized through establishing a climate monitoring and early warning system to track extreme weather events (e.g., droughts, heavy rainfall) associated with regional warming-wetting trends, coupled with restoring degraded grasslands in high-climate-variability zones using stress-tolerant native species (e.g., Kobresia pygmaea, Stipa purpurea) to enhance community stability, as demonstrated in alpine systems like the Swiss National Park [43]. Second, landscape heterogeneity conservation requires zoning policies to protect ecotones and habitat mosaics (e.g., shrub-grassland transitions) identified as biodiversity hotspots, alongside constructing ecological corridors connecting fragmented highland meadows using connectivity models from Yellowstone National Park [44] to facilitate climate-driven species migration. Third, biodiversity-productivity synergy can be achieved by adopting “biodiversity-sensitive grazing” that mimics natural herbivore patterns through seasonal livestock rotation ‒ validated in Mongolian steppe management [45] ‒ and piloting trait-based restoration with functional diversity metrics (e.g., leaf area, plant height) to design seed mixtures optimizing productivity and resilience, as implemented in South African grassland rehabilitation [46]. Fourth, a multiscale monitoring system should integrate satellite remote sensing (landscape diversity), UAV surveys (community structure), and ground sensor arrays (microclimate/traits), following Australia’s Great Eastern Ranges framework [47], while building a functional trait database aligned with global initiatives like the TRY Plant Trait Database [48] to address data gaps. Finally, transboundary collaborative governance necessitates establishing a co-management platform involving scientific institutions, pastoral communities, and Buddhist monasteries (local ecological knowledge custodians), replicating Three-River-Source National Park’s community stewardship model [49], and forming cross-border partnerships with adjacent reserves (e.g., Qomolangma National Nature Reserve) to address large-scale ecological processes, inspired by the European Green Belt collaboration [50]. These strategies synergize our findings on climate-diversity-stability relationships and landscape heterogeneity effects with globally validated approaches, emphasizing phased piloting, iterative adaptation guided by biodiversity-ecosystem function (BEF) theory, and leveraging the park’s UNESCO Global Geopark status for technical support.
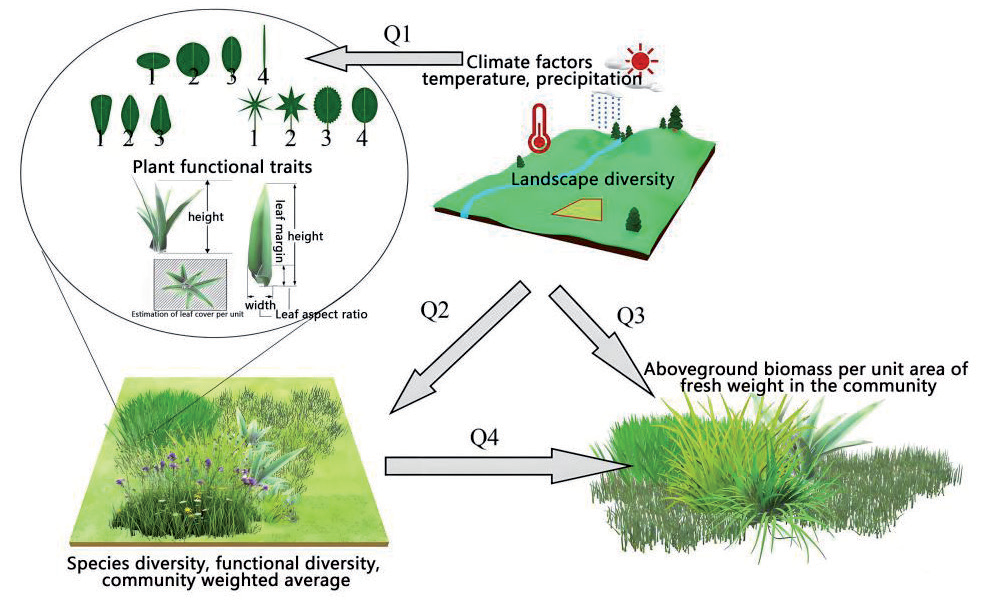
In conclusion, this study investigates the relationship between biodiversity and community productivity in alpine grasslands across large-scale environmental gradients, focusing on functional diversity (Fig. 12). The key scientific questions addressed include: (Q1) How do climate factors (e.g., temperature, precipitation) influence landscape diversity and plant functional traits? (Q2) How do environmental factors affect species diversity, functional diversity, and community-weighted means? (Q3) What is the impact of environmental factors on community aboveground biomass? (Q4) What is the relationship between biodiversity and biomass? These interconnected questions provide insights into how environmental factors shape community productivity through biodiversity and functional traits across varying altitudes and landscape heterogeneity. This study offers empirical evidence to advance understanding of the structural characteristics and biomass accumulation functions of grassland ecosystems in the context of environmental change.
Furthermore, while this study focused on structural traits (e.g., plant height, leaf morphology), it did not incorporate critical physiological and biochemical traits such as nutrient uptake efficiency, photosynthetic rates, or drought resistance. These omitted traits are fundamental mediators of plant-environment interactions, directly influencing carbon sequestration capacity, resource utilization strategies, and stress adaptation mechanisms. For instance, photosynthetic parameters determine energy conversion efficiency, while root exudate chemistry regulates nutrient cycling ‒ both processes ultimately shape ecosystem productivity. Future studies should adopt multidimensional trait frameworks integrating: (1) in situ measurements of leaf gas exchange using portable photosynthesis systems; (2) isotopic analyses (δ¹³C, δ¹⁵N) to quantify water/ nutrient use efficiency; (3) metabolomic profiling of stress-related compounds (e.g., proline, antioxidants). Combining these with remote sensing of physiological indicators (e.g., solar-induced chlorophyll fluorescence) could establish cross-scale linkages between plant functional strategies, community assembly, and ecosystem resilience under climate change. Such integration would address the current knowledge gap in understanding how biochemical plasticity mediates biodiversity-ecosystem functioning relationships across environmental gradients.
Conclusions
This study investigates the relationships between environmental factors ‒ including climate and landscape patterns ‒ and plant diversity and productivity in grassland ecosystems in the Qilian Mountains National Park. It highlights the distinct environmental characteristics of various grassland types across the Qilian Mountains National Park. For example, warm shrub-grasslands, alpine meadows, and marsh meadows in southern Qilian Mountains National Park exhibit trends of warming and drying. In eastern Qinghai Province, alpine grasslands display high temperature variability, while mountain meadows in the forest-grassland transition zone of the Qilian Mountains exhibit the highest landscape diversity.
Regression analyses of plant functional traits in relation to climatic and landscape diversity factors reveal that both plant height and mean leaf coverage per individual respond similarly to these factors, although plant height is statistically more sensitive. Both plant height and leaf coverage were negatively correlated with climate variability, while sites with higher landscape diversity displayed greater plant height and leaf coverage. Furthermore, water-use conservatism, as indicated by leaf morphology, is inversely correlated with precipitation availability.
Additional analyses indicated that regions with greater climate variability exhibited lower functional diversity and reduced community-weighted mean plant height and leaf coverage. These findings suggest that unstable climatic conditions suppress plant diversity. Consequently, future research should focus on evaluating the risks posed by extreme climatic events to grassland plant diversity in the Qilian Mountains National Park.
The results also show that higher rates of climate change are associated with increased functional diversity in plant communities. This indicates an adaptive response in which grassland communities enhance stability by diversifying functional traits under rapidly changing environmental conditions. Landscape diversity is consistently and positively correlated with both plant diversity and grassland biomass, emphasizing its critical role in fostering community-level diversity and productivity. Most diversity indices show a direct positive relationship with grassland biomass, underscoring the essential role of biodiversity in sustaining and enhancing ecosystem productivity.
This study provides empirical evidence to clarify biodiversity patterns in alpine grasslands across varying climatic and landscape gradients while identifying key environmental drivers. It offers quantitative insights into the relationships between multiscale biodiversity and ecosystem functions in alpine grasslands. The findings also provide foundational data for assessing the ecosystem service value of grassland plant diversity in response to environmental changes. Furthermore, they establish a theoretical and mechanistic framework to guide strategies for protecting biodiversity and maintaining productivity in this critical ecological barrier under future climate and landscape transformations.

