

Introduction
The ribosome, which has two (large and small) subunits, is essential for converting the information contained in mRNA into proteins [1]. In prokaryotes, the big 50S subunit comprises 36 proteins, 23S rRNA, and 5S rRNA, while the tiny 30S subunit comprises 16S rRNA and 21 proteins [2]. In both bacteria and archaea, 16S or 23S rRNA forms the structural core of the subunit particle. Although many ribosomal proteins are typically found on the surface of the subunit, some also have extensions that reach into the RNA core [3].
Low throughput techniques have also been used to use 16S sequences to separate strains sometimes referred to as subspecies based on gene polymorphisms [4]. When single nucleotide polymorphisms (SNPs) are securely connected to other regions of the bacterial haplotype, they can be utilized to predict phenotypic traits and track strains of therapeutic relevance [4, 5]. As a result, precise and comprehensive 16S sequences are quite useful in a variety of settings. Up until recently, high throughput sequencing technologies were unable to process precise, full-length 16S sequences [6].
The widespread use of DNA sequencing technologies in clinical, public health, and research settings has facilitated the development of swift and precise molecular diagnostic instruments. Compared to traditional methods, 16S rRNA sequence analysis can now identify bacterial isolates more quickly. Utilizing gene sequence analysis has enabled the identification of bacteria exhibiting distinctive phenotypic patterns, including those that were previously uncharacterized or unable to be cultured. Some of these bacteria are mistaken by automated clinical identification systems [7]. The second edition of Bergey’s Manual of Systematic Bacteriology supersedes the established standard for phenotypic characteristics, the laborious DNA-DNA hybridization methods, and phylogenetic categorization of bacteria with 16S rRNA sequence analysis [8] as the foundation for taxonomic classification. The rationale for this alteration is outlined in a section labeled “16S rRNA: the benchmark molecule for prokaryote systematics.”
We examined the microbial distribution and diversity in connection to the type of microhabitat in this work. Thereby advancing knowledge of the ecological functions played by microbial populations in the trophic networks of underground ecosystems.
Experimental
Study Areas
Isolates were collected from the coastal salty Sabkha marsh (a hot, humid area) soil in Rabigh City, Makkah region, Saudi Arabia. One of which was amended by some vegetables and chicken pieces as a source of protein and covered with the soil for about two weeks, and then samples were collected and had the (M) symbol; the other was amended by some vegetables only and covered with the soil surface for about two weeks, then samples were collected and had the (L) symbol. As a result of the previous research, which concluded that with increasing depth, the relative abundances of Actinobacteria, Verrucomicrobia, Planctomycetes, Alphaproteobacteria, and Gammaproteobacteria dropped [9], the specimens were gathered from a depth ranging between 5 and 20 cm and placed in sterile plastic containers.
Culture for Isolation of Bacteria
For bacterial isolation, nutrient agar was used. Three replicates of dilution of the soil sample were performed. The bacterial colonies were also observed under a microscope and then subjected to Gram staining. Subsequent identification of the bacterial isolates involved PCR amplification of the 16S rDNA genes, followed by sequencing.
DNA Extraction
As per the manufacturer’s guidelines, bacterial isolates underwent genomic DNA extraction utilizing the InstaGene TM Matrix Genomic DNA Kit (Bio-Rad Laboratories, Hercules, CA, USA).
PCR Amplification and Purification
The 16S rDNA region of bacterial isolates was amplified through PCR using the extracted genomic DNA as a template and universal primers 27F (5′-AGAGTTTGATCCTGGCTCAG-3′) and 1492R (5′-TACGGYTACCTTGTTACGACTT-3′). The amplification involved separate PCR reactions in a thermal cycler (Bibby Scientific, UK) with a reaction mixture (25 µl) containing 2 µl DNA, 1 µl of each primer, 12.5 µl master mix (2x), and 9.5 µl dH2O. The thermal cycle comprised an initial denaturation for 5 min at 94°C, followed by 35 cycles of denaturation for 1 min at 94°C, annealing for 1 min at 55°C, extension for 2 min at 72°C, and a final extension for 10 min at 72°C.
Following amplification, the PCR product was analyzed through 1.2% (w/v) agarose gel electrophoresis, purified, and then utilized for DNA sequencing. Subsequently, the DNA sequence was compared for similarity with sequences in the GenBank database (http://blast.ncbi.nlm.nih.gov/Blast.cgi).
Phylogenetic Analysis
The 16S rRNA genes’ full-lengths were sequenced. The CLUSTALW program was used to align several sequences (http://clustalw.ddbj.nig.ac.jp/top-j.html). The TreeView program was used to build and illustrate a neighbor-joining tree. We utilized the SEQMATCH service provided by the Ribosomal Database Project at http://rdp.cme.msu.edu/ with the filter setting “isolated type strains, with a length of about 1200 bp” to search the database for the 16S rRNA sequences’ closest relatives to further characterize them. The neighbor-joining tree was then built using the TREE BUILDER service. As an outgroup, the sequence of Deinococcus aquiradiocola was employed [10]. The closest relatives of the 16S rRNA genes found to be functional in Klebsiella aerogenes, Klebsiella pneumoniae, and Proteus mirabilis are displayed (as nomenclature). There are also several more pertinent strains displayed.
Ten nonredundant functional 16S rRNA sequences produced by PCR amplification were aligned, and the consensus sequences of these sequences were mapped into the E. coli secondary structure map. The Comparative RNA website provided a download link for the E. coli 16S rRNA map.
Bioinformatics Analysis
Sequence Analysis
The Finch TV program, version 1.4.0, was used to see and analyze the nucleotide sequence. To find out how similar a sequence was to another sequence that was placed in GenBank, researchers utilized the nucleotide Basic Local Alignment Search Tool (BLASTn; https:// blast.ncbi.nlm.nih.gov/) [11]. The 16S rRNA gene sequences have been submitted to the GenBank nucleotide database along with their respective accession numbers.
Molecular Phylogenetic Analysis
Utilizing Clustal W2 and BioEdit software [12, 13], highly similar sequences were obtained from the NCBI GenBank and subjected to multiple sequence alignment (MSA). To refine the alignment for phylogenetic analysis, divergent regions and poorly matched positions were eliminated using Gblocks [14, 15]. A Neighbor-Joining phylogenetic tree was constructed using our 16S rRNA sequences and those from the database. The bootstrap test indicated that the tree was replicated 1000 times, and the taxonomic associations were grouped. Evolutionary analysis was conducted using Molecular Evolutionary Genetics Analysis Version 7.0 (MEGA7) [16].
Results
Fig. 1 displays the evolutionary relationships of these useful 16S rRNA genes along with those of several pertinent bacteria. The ten isolates came from the Gammaproteobacteria lineage. There may be a different threshold for 16S rRNA functioning because no isolates from other Pseudomonadota classes or non-Pseudomonadota phyla were found. The bacterial strains were deposited in the GeneBank database and have accession numbers as follows: Klebsiella aerogenes L11 (PP277332), L16 (PP277333), M20 (PP277090), M9 (PP277334); Klebsiella pneumoniae L5 (PP277336), L9 (PP277093); Proteus mirabilis L21 (PP277091), L22 (PP277092), M10 (PP277486), M19 (PP277335).
Fig. 1.
Neighbor-joining phylogenetic tree of the 16S rRNA genes. 16S rRNA genes that were functional in Klebsiella aerogenes (L16, L11, M9, and M20), K. pneumoniae (L5 and L9), and Proteus mirabilis (L21, L22, M10, and M19) with their closest relatives (as nomenclature). The tree was rooted with Deinococcus aqulradiocola 16S rRNA genes (Mga 5).
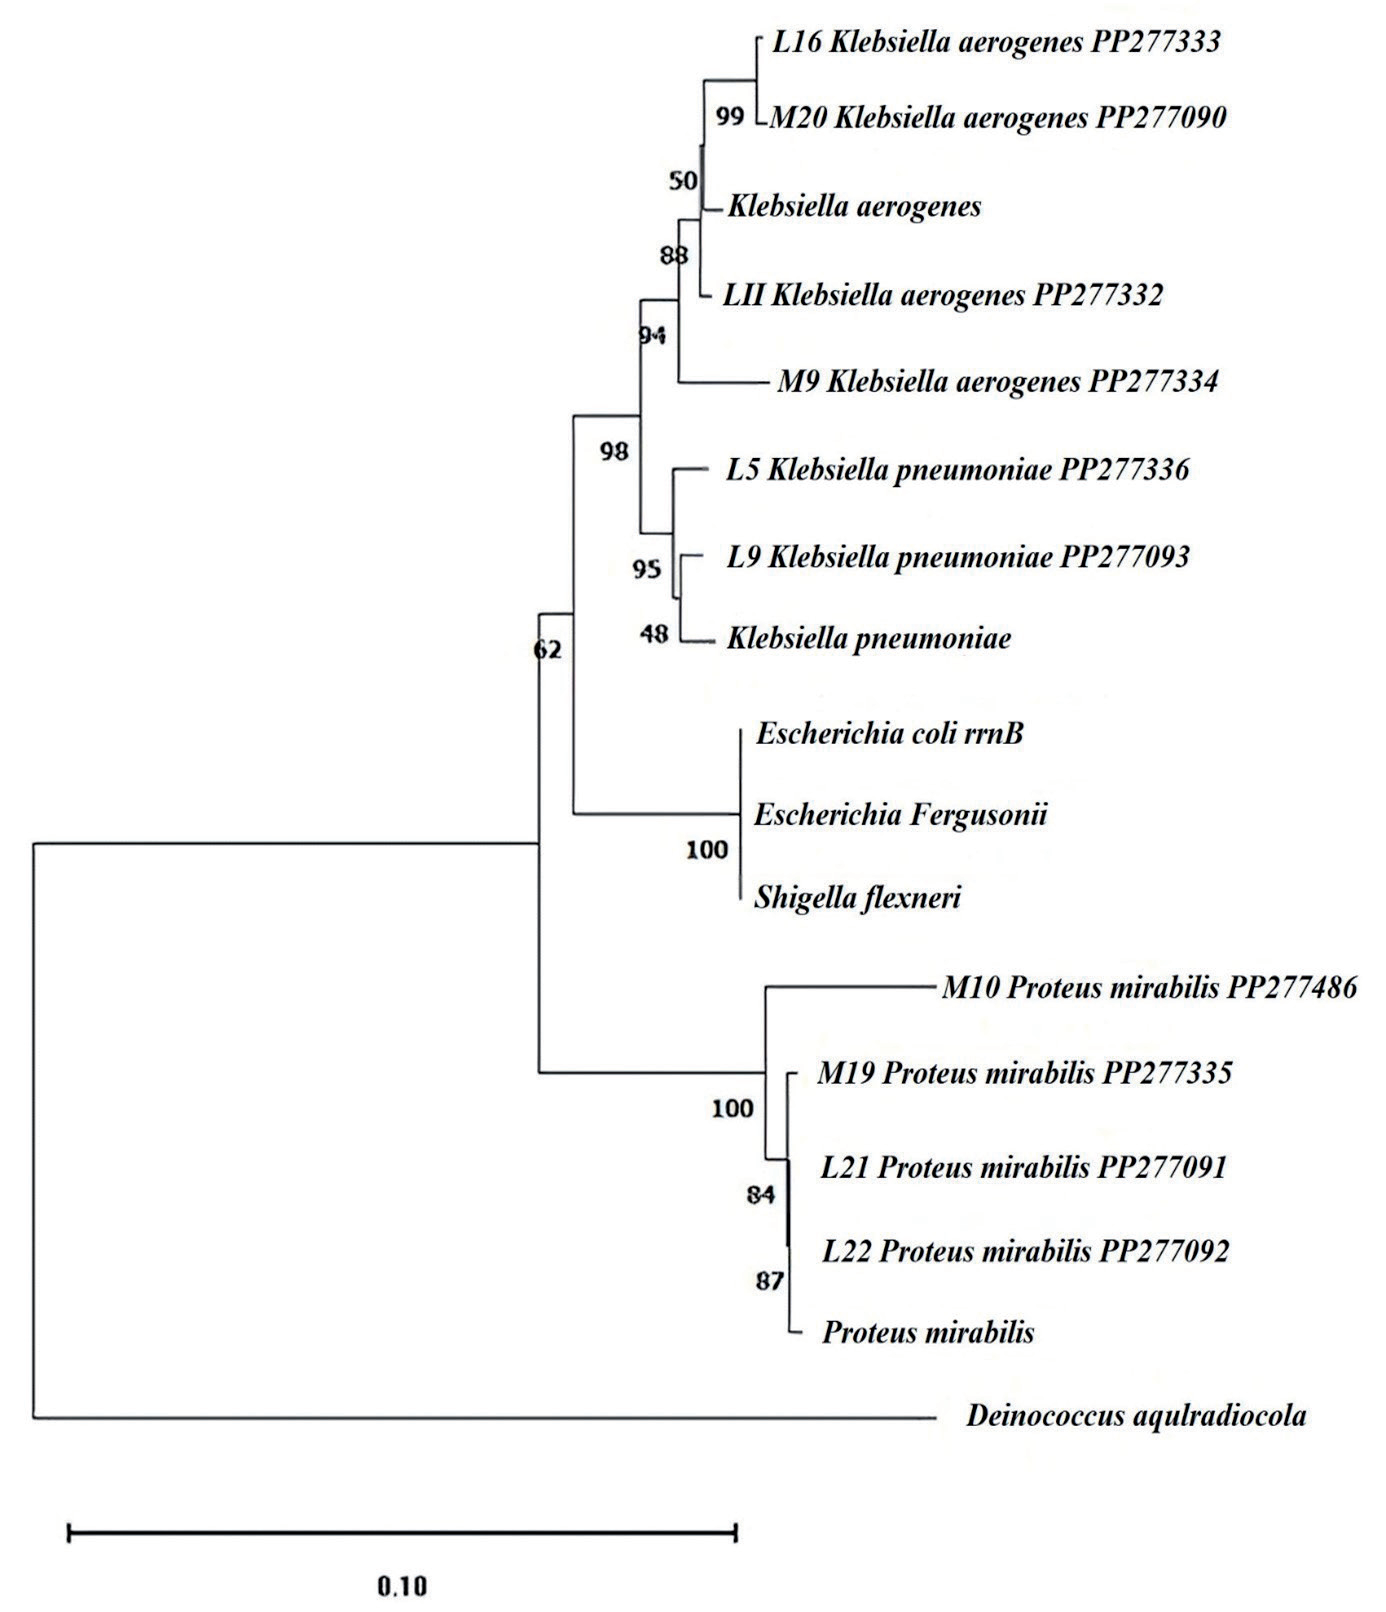
Table. 1.
Results from basecaller software and from base identification by visual inspection of electropherograms for Klebsiella aerogenes strains (L11, L16, M9 and M20) as query compared with Klebsiella aerogenes strain 2190 (NC 015663) as hit along with all 16S rRNA sequences.
Simultaneously, every functioning 16S rRNA, regardless of identity (80.9–99.7%), maintained its secondary structures; its consensus sequence was simply superimposed on the E. coli 16S rRNA secondary structure map [17] (Fig. 2). The sequence of helix (h) 21, for instance, varies between functional sequences (0-25.0%) (Fig. 3). Nevertheless, compensatory interactions between nucleotide pairs, encompassing both Watson–Crick and noncanonical base pairs, remain conserved to generate the identical secondary structure (refer to Fig. S1). The list of conservative nucleotides [18] was produced by screening mutations detrimental to the functionality of the 16S rRNA (Fig. 2). While our method checks directly for changeable nucleotides, it is complementary to theirs.
Following an analysis for mutations and conservative nature, ten 16S rRNA sequences from Saudi soil were examined. These sequences belonged to Klebsiella aerogenes (L11, L16, M9, and M20), K. pneumoniae (L5 and L9), and Proteus mirabilis (L21, L22, M10, and M19). The results showed variety with minimal differences.
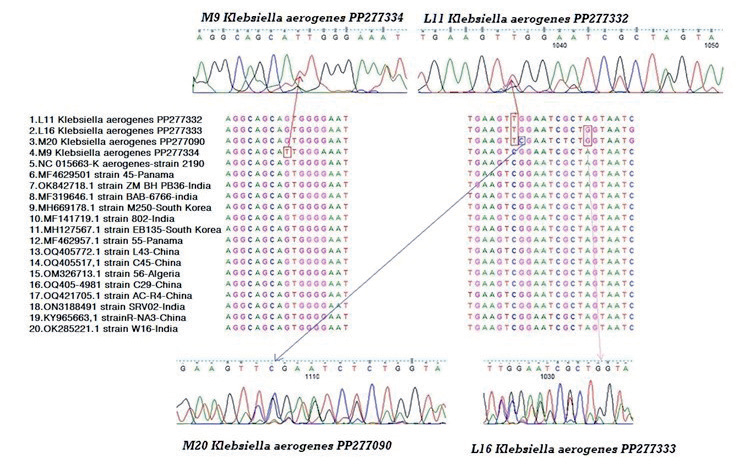
In relation to mutations, four nucleotide positions (29, 1035, 1037, and 1107) in K. aerogenes (L11, L16, M9, and M20) showed nucleotide changes. At position 1037, three strains (L11, L16, and M20) exhibited a novel transition C⟶T. However, one transition A⟶G, and one transversion G⟶C were seen in strain M20 at positions 1035 and 1103, respectively. One unique G⟶T transversion was present in strain M9, which was isolated from a warm, muggy place with some vegetables and chopped chicken added as a source of protein, at nucleotide position 29. Furthermore, one unique C⟶T transition was discovered in strain L11 at position 1037, which was isolated from a warm, muggy place with some vegetables added (Fig. 4).
In relation to mutations, five nucleotide positions (15, 21, 28, 1100, and 1106) in K. pneumoniae (L5 and L9) showed nucleotide changes. At positions 1100 and 1106, strain L5 exhibited two novel transversions A⟶C and C⟶G. However, two transitions T⟶C and A⟶G were seen in strain L9 at position 21 and 28, respectively. One unique T⟶G transversion was present in strain L9, which was isolated from a warm, muggy place with some vegetables added (Fig. 5).
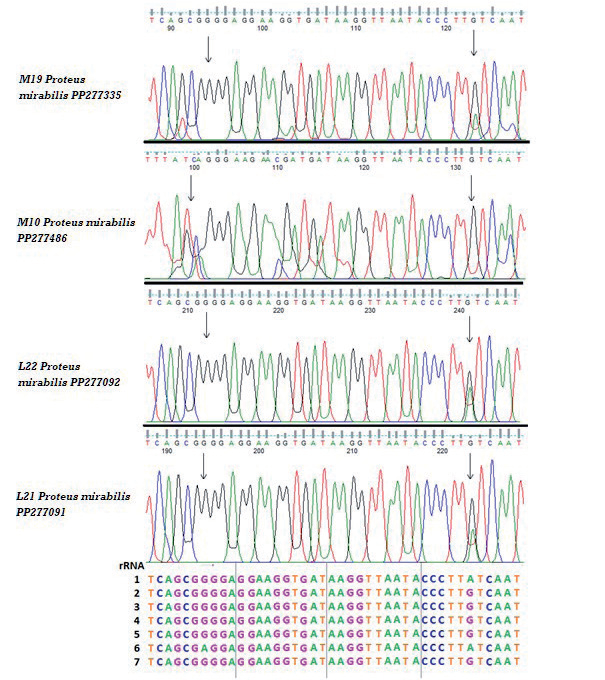
In relation to mutations, four nucleotide positions (5, 28, 38, and 328) in Proteus mirabilis (L21, L22, M10, and M19) showed nucleotide changes. At positions 21, strain L21 exhibited one novel transition, G⟶A. However, one unique transversion T⟶G was seen in strain L22 at positions 28. One unique C⟶A transversion was present in strain M10, while there is one transversion C⟶A in strain M19 at position 328 (Fig. 6).
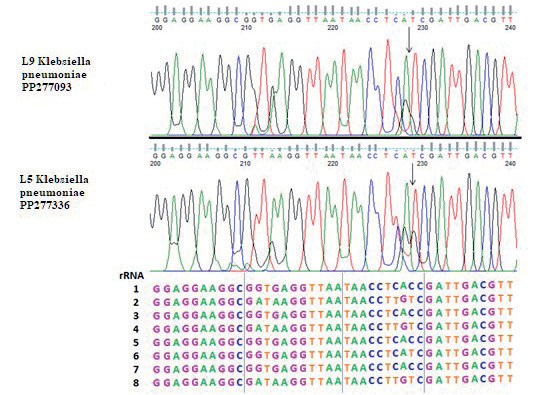
According to the sequences of the 16S rRNA gene, ten bacterial isolates were recognized: two isolates of K. pneumoniae, four isolates of Proteus mirabilis, and four isolates of Klebsiella aerogenes. The ability to discern patterns in electropherograms and computer-generated sequences was examined using basecaller software. Multiple peaks at single nucleotide positions were visible in the electropherograms produced by sequencing 16S rRNA gene PCR products, which are a mixture of amplicons from 16S rRNA genes encoded in a single genome. This suggested that at least one of the 16S rRNA genes carried an SNP. A link was seen between the height of each of the several peaks at a single nucleotide position containing the SNP and the number of gene copies in a comparison of the complete genome sequences of each 16S rRNA gene sequence. One strain containing eight 16S rRNA genes with an SNP at a certain nucleotide site, for example, produced a minor peak that was proportionately smaller than the peak corresponding to the base present in the other seven copies. Nucleotide sites 837 and 841 for strain L11, 825 and 829 for strain L16, and 787 for strain M9, and nucleotide positions 906 and 910 for strain M20, where only one copy of the 16S rRNA gene has T instead of C, are examples of K. aerogenes (L11, L16, M9, and M20) (Table 2, Fig. 7). Sometimes it was hard to tell a modest peak from background noise. However, when the SNP was present in multiple copies of the different genes, the resulting peak was easier to spot and more conspicuous. In particular, three copies of A and five copies of G were discovered at nucleotide positions 211 and 213 for K. pneumoniae (L5 and L9). On the other hand, three copies of A and five copies of G were discovered at nucleotide locations 228. Additionally, we found that, at nucleotide position 227, the gene had three copies of T and five copies of C; on the other hand, at nucleotide position 229, the gene had four copies of T and four copies of C (Table 3, Fig. 8). There was one copy of A and seven copies of G at nucleotide position 194 for Proteus mirabilis (L21, L22, M10, and M19), while there was one copy of A and seven copies of G at that same nucleotide site (Table 4, Fig. 9).
Fig. 2.
Variable 16S rRNA nucleotides in E. coli. Ten nonredundant functional 16S rRNA sequences that were obtained using PCR amplification were aligned, and their consensus sequences were superimposed onto the E. coli secondary structure map. The original E. coli 16S rRNA map was obtained from the Comparative RNA Web site (16). The 517 variable nucleotides are shown in red. The nucleotides in green are the binding sites of the PCR primers—that is, Bac8f at the 5′-end or UN1541r at the 3′-end (14, 18). The nucleotides circled in black are the invariable nucleotides reported by Mankin’s group (27). The number of RNA helices (h1–h45) is indicated in pink. Blue arrows indicate the secondary structure base pair. Red arrows indicate tertiary structure base pair. The orange arrow indicates tertiary: non-canonical base pairs. Green arrows indicate tertiary structure triples. Purple arrows indicate tertiary pseudoknots (non-nested base pairs). G-C / A-U: Canonical base pair. G.U: G-U base pair. G o A: G-A base pair/C. A: C-A base pair.
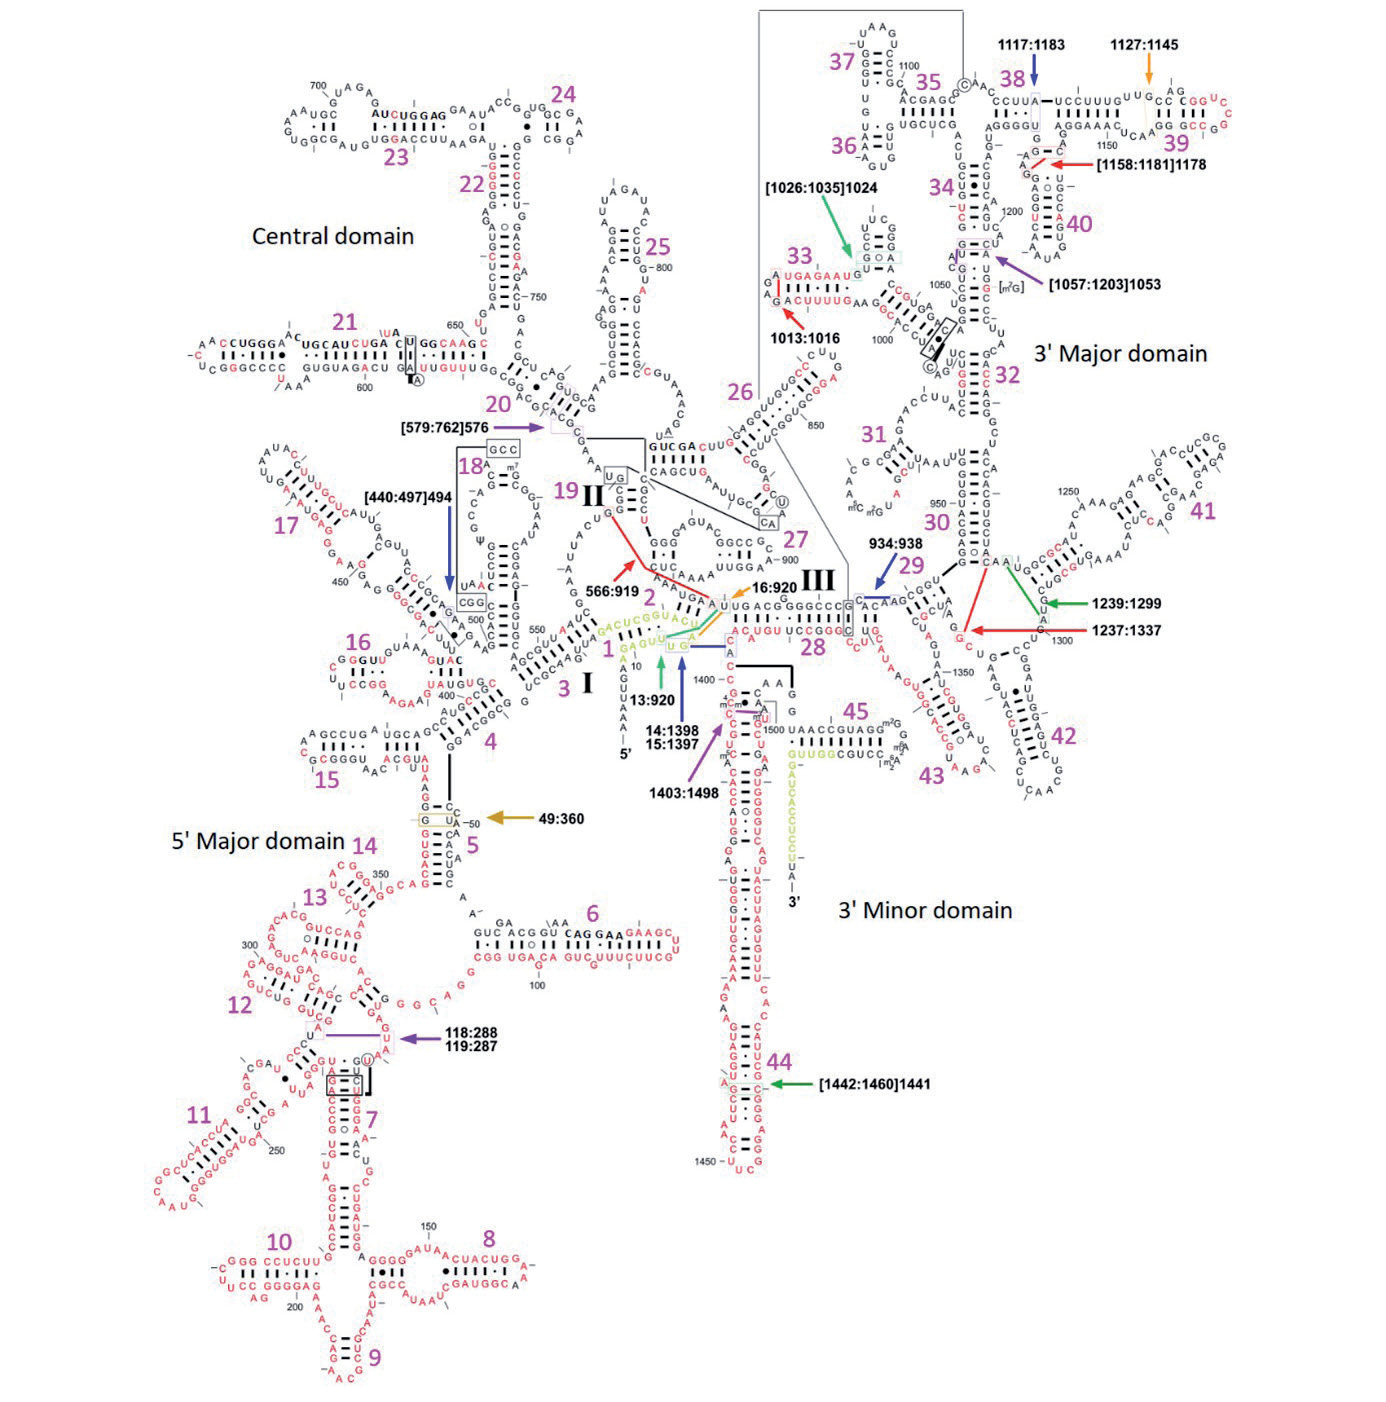
Fig. 3.
Multiple alignment of the h21 region (G588–C651) of the 16S rRNA genes obtained from the environmental metagenome. The residues conserved in all of the sequences are shaded in black, those conserved in 80% of the sequences are in dark gray, and those conserved in 60% are in light gray. The consensus sequence is shown in red at the bottom of the alignment.
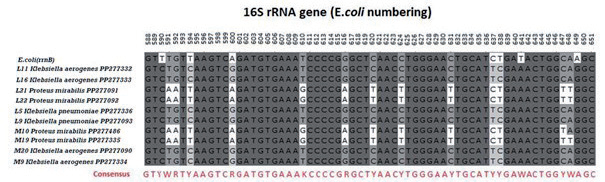
Fig. 4.
(a) and (c) sequencing results of chromatograms using Finch TV software show nucleotide variations in the 16S rRNA gene of Klebsiella aerogenes (L11, L16, M9, and M20) are illustrated by squares. (b) Multiple Sequence Alignment (MSA) of 16S rRNA sequences of four Saudi K. aerogenes strains compared with the rRNA gene of Klebsiella aerogenes strain 2190 (NC 015663) and other selected strains obtained from GenBank databases using Clustal W2.
Among a genome’s numerous copies of the 16S rRNA gene, indels were found in addition to SNPs (Figs. 7, 8, and 9). A genome’s DNA is altered when an indel appears in one or more of the 16S rRNA genes. The 16S rRNA gene sequences are no longer synchronized downstream of that electropherogram location. When compared to the separate rRNA gene sequences from K. aerogenes strains (L11, L16, M9, and M20) whole genome, positions 837, 825, 787, and 906, respectively (shown by the arrow in Fig. 7), were where the shift began. in relation to the strain’s 16S rRNA gene consensus sequence (Klebsiella aerogenes strain 2190 (NC 015663)). When compared to the separate rRNA gene sequences from Klebsiella pneumoniae strains (L5 and L9) whole genome, position 229 (shown by the arrow in Fig. 8) was where the shift began. in relation to the strain’s 16S rRNA gene consensus sequence (Klebsiella pneumoniae strain JCM1662 (NR112009)). When compared to the separate rRNA gene sequences from the Proteus mirabilis (L21, L22, M10, and M19) whole genome, positions 194 and 223 for L21, 212 and 241 for L22, 99 and 132 for M10, and 94 and 123 for M19 (shown by the arrows in Fig. 9) were where the shift began. in relation to the strain’s 16S rRNA gene consensus sequence (Proteus mirabilis strain H14320 (NC 010554)). Additionally, indels were detected in electropherograms produced for 10 strains.
Fig. 5.
(a) sequencing results of chromatograms using Finch TV software show nucleotide variations in the 16S rRNA gene of Klebsiella pneumoniae (L5 and L9) are illustrated by squares. (b) Multiple Sequence Alignment (MSA) of 16S rRNA sequences of four Saudi K. pneumoniae strains compared with the rRNA gene of Klebsiella pneumoniae strain JCM1662 (NR112009) and other selected strains obtained from GenBank databases using Clustal W2.
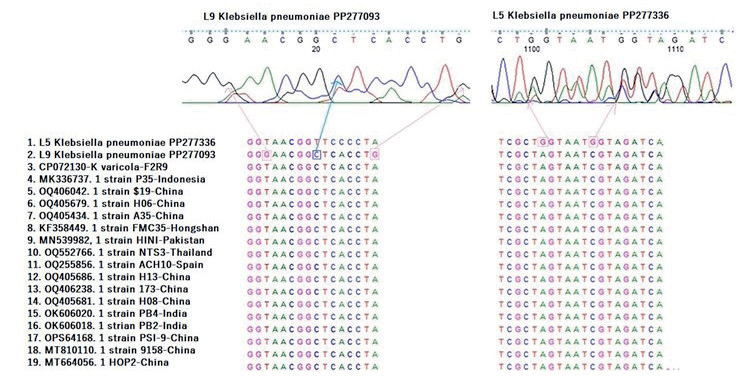
Fig. 6.
(a) and (c) sequencing results of chromatograms using Finch TV software show nucleotide variations in the 16S rRNA gene of Proteus mirabilis (L21, L22, M10, and M19) are illustrated by squares. (b) Multiple Sequence Alignment (MSA) of 16S rRNA sequences of four Saudi P. mirabilis strains compared with the rRNA gene of P. mirabilis strain H14320 (NC 010554) and other selected strains obtained from GenBank databases using Clustal W2.
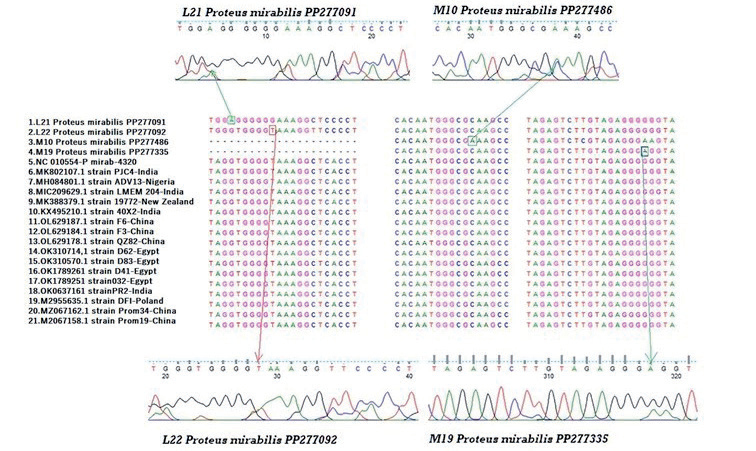
Table 2.
Results from basecaller software and from base identification by visual inspection of electropherograms for Klebsiella pneumoniae strains (L5 and L9) as query compared with Klebsiella pneumoniae strain JCM1662 (NR112009) as hit along with all 16S rRNA sequences
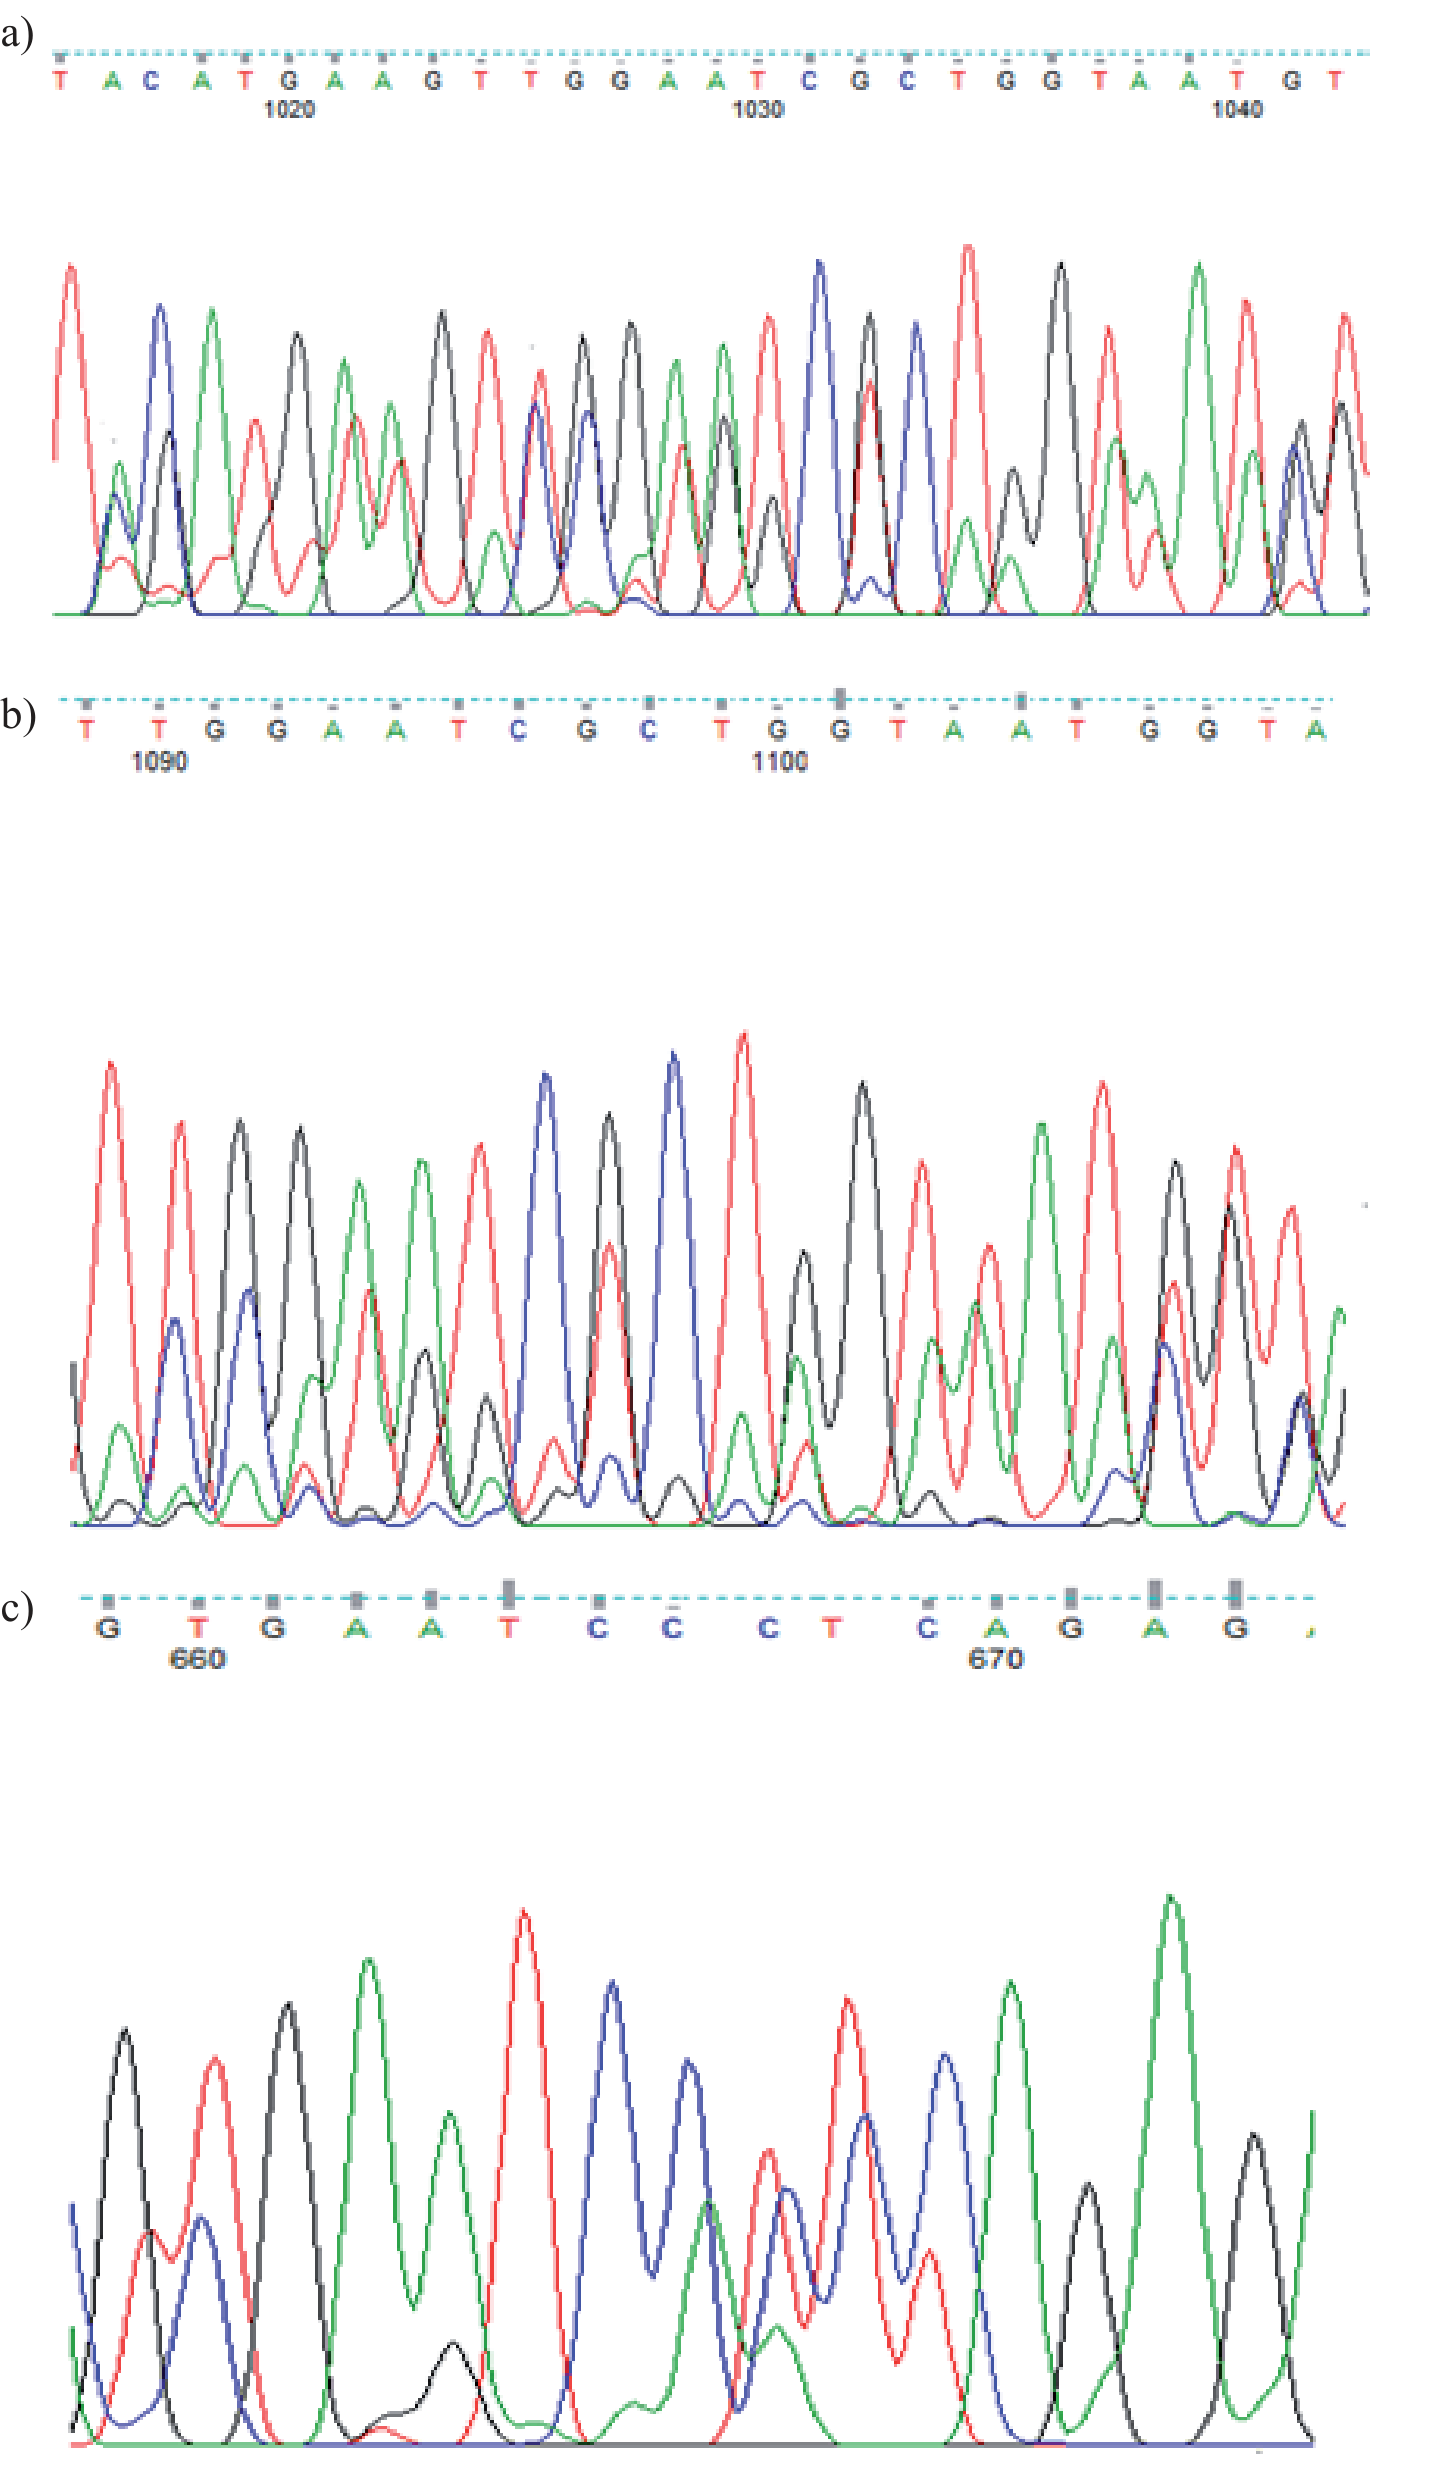
The K. aerogenes L16 triple peaks at positions 1016 and 1041 were an example of more than two peaks at a single nucleotide location; the different copies of the 16S rRNA gene carried A, G, or T, resulting in three overlapping peaks (Fig. 10A); K. pneumoniae L5 tetra peaks at locations 1090 and 1100; different copies of the 16S rRNA gene carried T, C, A, or G, resulting in four overlapping peaks; also triple peaks at position 1106; three overlapping peaks were produced by different copies of the 16S rRNA gene that included G, T, or C in K. pneumoniae L5 (Fig. 10B); and positions 667 triple peaks of P. mirabilis M10; T, C, or A were present in the different copies of the 16S rRNA gene, resulting in three overlapping peaks (Fig. 10C).
Software comparison for basecalling DNA sequences. A comparison was made between the 16S rRNA gene sequences created and displayed using Applied Biosystems DNA Sequence Analysis Software and DNAbase Caller v5.21.0 (https://www. dnabaser.com/download/DNA-Baser-sequence-assembler/auto-download.html), FinchTV v1.4 (https:// finchtv.software. informer.com/download/?ca7826), ChromasPro v 2.1.10.1 (https://www.technelysium. com.au/Chromas266Setup.exe), and Codoncode Aligner v11.0.1 (https://www.codoncode. com/aligner/ download/Aligner_Installer.exe) (Figs. S2-S11). The electropherograms shown by ChromasPro, Finch TV, and DNASTAR Caller all had a similar look. SNPs that showed several peaks at a single nucleotide location were typically prominent and easy to see. Small multiple peaks, however, could occasionally be hard to tell apart from background noise. With virtually no background noise, Codoncode Aligner produced peaks that were more sharply defined. However, the program also lowered the peak heights of the bases named, making it more challenging to visually identify several peaks at a single base position.
Discussion
Numerous complex ecosystems support diverse microbial communities, including the rhizosphere of plants, the human and other eukaryotic guts, and even situations that are typically considered inhospitable [19]. These microorganisms are essential to the planet’s biogeochemistry and the continuation of life on a worldwide scale [20, 21].
Following an analysis for mutations and conservative nature, ten 16S rRNA sequences from Saudi soil were examined. These sequences belonged to Klebsiella aerogenes (L11, L16, M9, and M20), K. pneumoniae (L5 and L9), and Proteus mirabilis (L21, L22, M10, and M19). The results showed variety with minimal differences.
Fig. 7.
Electropherogram illustrating the loss of synchronicity that occurs when there is a nucleotide deletion or insertion within one or more of the 16S rRNA genes among the multiple rRNA operons in the genome. Klebsiella aerogenes (L16, L11, M9, and M20) gene sequences are available from GenBank (GenBank accession no.). These sequence data were generated from a DNA template amplified with 16S rRNA universal primers. Arrow, the position of the indel.
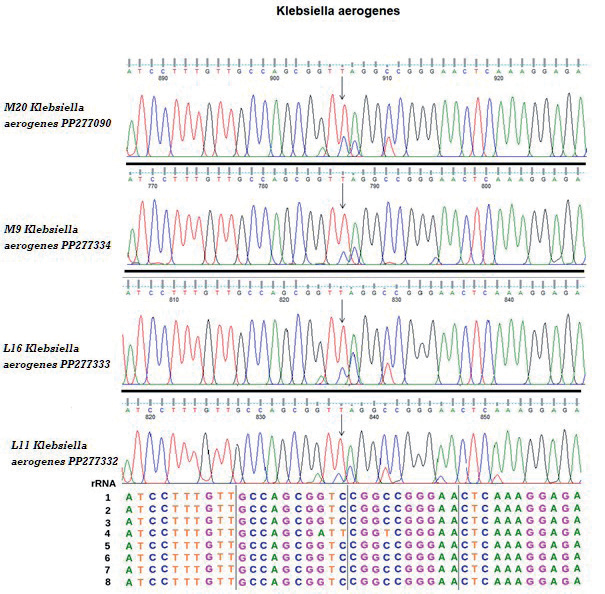
Table 3.
Results from basecaller software and from base identification by visual inspection of electropherograms for Proteus mirabilis strains (L21, L22, M10 and M19) as query compared with Proteus mirabilis strain H14320 (NC 010554) as hit along with all 16S rRNA sequences.
Amplification and sequencing of the 16S ribosomal RNA (16S rRNA) gene have been widely applied to the study of bacterial taxonomy and phylogeny, leading to the creation of sizable public-domain databases [22].
The genes encoding 16S rRNA in bacteria are situated within the rRNA operons, which also encompass genes for 23S rRNA, 5S rRNA, tRNA, and related intergenic spacer regions [23]. These operons are anticipated to be present on the chromosome, as rRNAs are crucial for the survival of the organism [24]. The taxonomic diversity of microbial communities, encompassing the uncultivated components, can be directly inferred from the sequences of the 16S rRNA gene [25].
Overall, the taxonomic makeup of the gut microbiota has been greatly revealed by 16S rRNA profiling research, which has made it easier to deduce general evolutionary trends. Species variety might be the tip of the iceberg regarding the intricacy of gut microbes. The gut microbiota is made up of many different strains of bacteria, as demonstrated by recent studies using techniques other than the standard 16S rRNA profiling approach. These strains are expected to have an impact on the gut microbiota’s function [26].
Furthermore, using computational techniques like phylogenetic community inquiry through the reconstruction of unobserved states, functional information might be anticipated from 16S rRNA gene amplicon-sequencing datasets PICRUSt [27, 28]. A more accurate picture of microbial diversity and metabolic potential could be obtained by combining these methods with community level physiological profiling (such as BIOLOG®EcoPlateTM) [27, 29]. Using only 16S rRNA genes for phylogenetic reconstructions produced unstable tree topologies with negligible bootstrap support. Different phenotypic features that show an adaptation to shared environmental variables across their evolutionary history may be associated with the identified clades [30, 31]. The bacteria that make up the Klebsiella pneumoniae complex are commonplace and can be found in soils, plants, or water. They are also opportunistic pathogens that affect humans. Inferred common and unique characteristics exist for both ambient and clinical K. pneumoniae. GenBank was used to obtain whole genome sequences of members of the K. pneumoniae complex, including K. variicola (n = 6), K. quasipneumoniae (n = 7), and members of the environmental (n = 61) and clinical (n = 78) origins from 21 different countries [32, 33].
Fig. 8.
Electropherogram illustrating the loss of synchronicity that occurs when there is a nucleotide deletion or insertion within one or more of the 16S rRNA genes among the multiple rRNA operons in the genome. Klebsiella pneumoniae (L5 and L9) gene sequences are available from GenBank (GenBank accession no.). These sequence data were generated from a DNA template amplified with 16S rRNA universal primers. Arrow, the position of the indel.
The 16S rRNA gene is a valuable target for phylogenetic and clinical identification because of several characteristics that make it the most ubiquitous housekeeping genetic marker and the “ultimate molecular chronometer.” [34].
The K. pneumoniae possesses a sizable plasmid and chromosomal gene locus auxiliary genome. This auxiliary genome distinguishes K. pneumoniae from two closely related species, K. variicola, and K. quasipneumoniae, and divides strains of the bacteria into groups that are hypervirulent, opportunistic, and resistant to many drugs [35].
For the most part, 16S rRNA has been essential for the identification of microbial organisms, and it still is. Even though 16S rRNA has undoubtedly been examined more than any other sequence in history, there is still considerable uncertainty around it today [30, 36].
The evolutionary relationships of these 16S rRNA genes along with those of several pertinent bacteria [37]. The ten isolates came from the Gammaproteobacteria lineage. More than 15 bacterial phyla are associated with marine sponges thus far, based on the study of 16S rRNA genes [36, 38].
Now, 16S ribosomal RNA is the most significant research target in bacterial ecology. However, sequence variation between closely related taxa or within a genome, as well as varying copy numbers in bacterial genomes, limit its utility for characterizing bacterial diversity [38]. Although low 16S rRNA copy numbers are found in various phyla, there is a significant variation in some taxa, such as the Gammaproteobacteria and Firmicutes [39, 40].
In unison, each operational 16S rRNA, irrespective of its similarity (80.9–99.7%), retained its secondary structures, with its collective sequence being overlaid on the E. coli 16S rRNA secondary structure map [17, 41]. Notably, the configuration of the helix (h) 21 may differ among operational sequences (0-25.0%). Nevertheless, compensatory interactions between nucleotide pairs, encompassing Watson–Crick and noncanonical base pairs, persist to uphold the identical secondary structure. The list of conservative nucleotides [18] was produced by screening mutations detrimental to the functionality of the 16S rRNA. While our method checks directly for changeable nucleotides, it is complementary to theirs [42]. Using model systems of bacteria like Escherichia coli has provided an intriguing insight into how to comprehend these intricate relationships in an ecological environment [43].
Fig. 9.
Electropherogram illustrating the loss of synchronicity that occurs when there is a nucleotide deletion or insertion within one or more of the 16S rRNA genes among the multiple rRNA operons in the genome. Proteus mirabilis (L21, L22, M10, and M19) gene sequences are available from GenBank (GenBank accession no.). These sequence data were generated from a DNA template amplified with 16S rRNA universal primers. Arrow, the position of the indel.
As seen for K. aerogenes strains at places 837 and 841 for strains L11, 825, and 829 for strain L16, 787 for strain M9, and strain M20 at sites 906 and 910, where only one of the 16S rRNA gene copies had T instead of C, the SNPs were present in one or more of the 16S rRNA genes. Concerning the K. pneumoniae strains in particular, three copies of A and five copies of G were discovered at positions 211 and 213. On the other hand, three copies of A and five copies of G were discovered at position 228. Additionally, we found that, at position 227, T was present in three copies of the gene and C in the remaining five copies; on the other hand, at position 229, T was present in four copies and C in the remaining four copies of the gene. For P. mirabilis strains, there was one copy of A and seven copies of G at position 194, whereas at that same nucleotide location, there was one copy of A and seven copies of G.
Fig. 10.
Representative electropherograms of 16S rRNA gene sequences with multiple peaks more than two at a single nucleotide position due to SNPs in one or more of the multiple 16S rRNA genes within the genome. (A) K. aerogenes (L16), (B) K. pneumoniae (L5) and (C) P. mirabilis (M10). The size of each peak at these positions is dependent on the number of operons with the SNP.
The selection of software tools for basecalling DNA sequences is based on the specific strengths and capabilities of each tool. The Applied Biosystems DNA Sequence Analysis Software is chosen for its accuracy and extensive features, while DNAse Caller v5.21.0 is selected for its robust basecalling algorithms and compatibility with various sequencing platforms. FinchTV v1.4 is chosen for its visualization capabilities and ease of use, ChromasPro v 2.1.10.1 for its advanced basecalling algorithms and efficient handling of large sequence datasets, and Codoncode Aligner v11.0.1 for its alignment and assembly functionalities. These selections contribute to the clarity and rigor of the study by aligning with the scientific standards for basecalling and visualization of DNA sequences, providing valuable insight into the considerations behind the choice of software tools.
A combination of shorter and longer reads from various platforms is necessary to assemble individual genes and detect any Single Nucleotide Polymorphisms (SNPs) present in different copies. The 16S rRNA gene is commonly sequenced using Sanger sequencing to quickly identify unknown isolates from clinical specimens and environmental materials and to validate variant sequence data produced by high throughput technologies. The criteria used for interpreting bacterial identification through 16S rRNA gene sequence analysis do not fully consider the intragenomic complexity of a species’ rRNA operons, nor do they emphasize the importance of visually assessing and interpreting gene sequence data provided by basecaller software [44]. Moreover, many of the 16S rRNA gene sequences in the databases cover only parts of the genes that are categorized as hypervariable regions. There are limitations to the use of incomplete 16S rRNA gene sequences for genus or species identification [35, 45].
Among the attributes of 16S rRNA are the following: First of all, it may be found in all bacteria and is frequently found in operons or multigene families, making it a universal target for bacterial identification [22]. Second, since 16S rRNA’s function has not altered over a significant amount of time, random sequence changes rather than chosen modifications that could modify the molecule’s function are more likely to indicate microbial evolutionary changes (phylogeny). Lastly, at 1,500 bp, the 16S rRNA gene is large enough for informatics applications [34].
Despite making up less than 3% of the planet’s land area, peatlands are home to soil organic matter known as peat, which is thought to hold 40% of all terrestrial organic carbon (C) [46, 47].
The electropherograms of the PCR products displayed several single nucleotide site peaks and occurrences of more than two peaks at a single nucleotide position. Within the various 16S rRNA gene copies, overlapping peaks of A, G, or T were observed at positions 1016 and 1041, resulting in triple peaks for K. aerogenes L16. Additionally, tetra peaks were visible at positions 1090 and 1100; the various gene copies contained T, C, A, or G producing four overlapping peaks; position 1106 triple peaks of K. pneumoniae L5; the various gene copies contained G, T, or C producing three overlapping peaks; and positions 667 triple peaks of P. mirabilis M10; the various gene copies contained T, C, or A producing three overlapping peaks.
The highest variance in 16S rRNA copies showed a minimum pairwise similarity of 99.42%, which had no bearing on the identification of the species. Therefore, PCR products from genomes with varying copies of the 16S rRNA gene can yield enough data to identify a species [48].
The electropherograms derived from sequencing the PCR products of the 16S rRNA gene revealed multiple peaks at individual nucleotide positions, indicating the presence of an SNP in one or more of the 16S rRNA genes. Upon comparison, a correlation was observed between the gene copy number and the peak height at specific nucleotide positions harboring the SNP. For instance, the minor peak produced by a single copy of a strain with eight 16S rRNA genes and an SNP at a particular nucleotide location was proportionally less than the peak corresponding to the base present in the other seven copies [48-50]
Conclusions
Overall, this research provides valuable insights into the genetic variations and relationships among these bacterial strains found in Saudi soil. Understanding the genetic diversity of these bacterial strains is crucial for comprehending their evolutionary relationships and potential differences in their phenotypic characteristics. The results of the study contribute to the growing body of knowledge about the genetic variation of bacteria in soil in Saudi Arabia, with potential implications for environmental microbiology, biotechnology, and public health.

