

Introduction
Energy plays an essential role in the sustainable economy, which demands potential alternative renewables to fulfill futuristic needs. Biodiesel (BD) is advantageous over petroleum diesel due to negligible sulfur contents, less particulate matter, low hydrocarbons, and more free oxygen, resulting in reduced emissions and complete combustion [1]. Algae (both macro-algae and micro-algae) are rapidly growing photosynthetic organisms possessing enough potential to transform 9-10% solar radiation into biomass with an approximate theoretical yield of 77g biomass/m2/day which is around 280 tons/ha/year [2]. Algal oil is a superior feedstock for biodiesel production than edible and non-edible oil sources due to a number of factors, including greater oil yield, less land requirement, and no food vs fuel debate. Soap formation and the wastage of catalyst in homogenous catalyzed transesterification limit its use in biodiesel production. Moreover, washing biodiesel is unfriendly to the ecosystem as plenty of water is wasted during the process. On the contrary, heterogeneous catalysis is more ecofriendly because of no soap formation and ease of separation of catalyst from the reaction mixture. Supported heteropoly acids, especially dodeca-molybdophosphoric acid (MPA) as a potential heterogeneous catalyst, are an emerging material for BD production with greater efficiency. Statistical analysis has always been an important, in fact integral, part of scientific research. Response surface methodology (RSM) has been applied for the optimization of process parameters. RSM is a statistical tool used to identify the relationship between different experimental variables along with analysis of variance to evaluate the accuracy of conducted experiments based on obtained responses. It helps to determine the best possible outcomes of conducted experiments through a selection of the most appropriate experimental design [3]. RSM is a bundle of mathematical and statistical operations for the modeling of research problems and for optimizing the response of interest which is influenced by the number of operating parameters [4].
Experimental Procedures
Production of Biomass and Oil Extraction
All chemicals used in the present study were of analytical grade. Basal media was used for the growth of C. vulgaris [5]. Ultra-violet/visible spectroscopy was used for the determination of cell concentration in the photobioreactor. After reaching the culture at the stationary phase, anhydrous aluminum sulfate was added as a flocculant to the culture at a concentration of 0.5 g/L to precipitate algal cells. The solution was manually shaken and then centrifuged to get algal paste. The dry algal biomass was obtained by lyophilization. The final concentration of C. vulgaris in the culture was calculated by Equation (S1):
Lipids were extracted by Soxhlet apparatus from algal dry biomass. The lipid content was calculated using Equation (S2).
Quality parameters were checked according to the standard methods. Saponification value, iodine value, cloud point, pour point, and flash point were assessed to check the quality of algal BD produced.
Preparation of Catalyst and Transesterification Process
Catalyst preparation was done by wet impregnation. Alumina was impregnated by an aqueous solution (30%) of MPA on constant stirring for 6 hours. Then, it was dried in an oven at 100℃ and calcined at 200℃ prior to use [6, 7]. The process was done in a round bottom flask connected with a condenser containing algal oil, methanol, and a supported catalyst while heating under reflux. The percentage yield of BD was calculated by Equation (S3).
RSM Design and Analysis
The simple and interactional effect of independent variables on the algal BD yield was studied by planning the experiments with the help of a statistical tool, response surface methodology (RSM), using Design Expert 11.0 software (Stat-Ease Inc.). RSM was applied under the mode central composite design to optimize the independent reaction parameters for maximum algal BD response. The CCD suggested thirty experiments for conversion reaction conditions and product yield, including six center points and twenty-four factorial points. The independent variables range was coded into lower (-2), low (-1), intermediate (0), high (+1), and higher (+2) levels (Table 1), with the six center points to avoid experimental error. To reduce the possible systematic error due to the trend in the variables, experiments were performed in a random manner. The experimental and predicted yield with varied reaction conditions are given in Table 2.
Table 1.
Coded levels of independent variables for transesterification.
| Factors | Unit | Level | ||||
|---|---|---|---|---|---|---|
| -2 | -1 | 0 | +1 | +2 | ||
| Catalyst conc. | w/w% of oil | 1 | 2 | 3 | 4 | 5 |
| Methanol:oil | Ratio | 10:1 | 15:1 | 20:1 | 25:1 | 30:1 |
| Reaction temperature | ℃ | 40 | 80 | 120 | 160 | 200 |
| Reaction time | Minutes | 60 | 120 | 180 | 240 | 300 |
Table 2.
Experimental design CCD matrix of four independent variables for the response using MPA/silica as catalyst.
BD Characterization
The fatty acid profile of algal BD was determined by GCMS analysis using Agilent GC (6890) and MS (5975) with inlet and auxiliary temperatures of 250°C and 280°C, respectively. About 20°C per minute increment up to 250°C and 50°C per minute up to 300°C were maintained. The FAME profile was also used to calculate the saponification value (SV) and iodine value (IV), which were further used to calculate the cetane number (CN) of the produced algal BD. The equations for these calculations are given below [8-10]:
Ai represents the component’s percentage; D represents the double bonds number; and MWi represents the component’s molecular mass.
Results and Discussion
Development of a Regression Model
The four models that RSM software used to characterize the response were linear, two-factor interaction, quadratic, and polynomial. Table 3 demonstrates that the quadratic model, which had the highest order polynomial and was not aliased, provided the greatest fit to the data. The model equation for the generation of BD was expressed in Equation (1) by coding A as MPA/alumina concentration, B as methanol/oil molar ratio, C as reaction temperature, and D as reaction time. The terms in the model equation have negative and positive signs, which suggest an antagonistic and a synergistic effect for enhanced BD yield, respectively [11]. In the model equation, the factors A, B, C, and D and the interaction terms BC, AB, and BD with positive coefficients have a direct relationship toward response, while the quadratic terms A2, B2, C2, and D2, along with the interaction terms AC, AD, and CD with negative coefficients, have an indirect relationship towards algal BD yield.
(1)
In order to assess the quadratic model’s significance and fitness and the impact of important individual and interaction terms on the responses, a statistical ANOVA was performed. The results are shown in Table 4. The included terms in the model indicate a 95% significance level of confidence, as indicated by the F-value of 63.88 with a p-value<0.0001. Each regression coefficient’s significance is examined using the p-value, which also shows the interaction effect. The greater the significance of the associated coefficient, the smaller the p-value [12]. In the case of model terms, p-value<0.05 meant that the specific model terms were statistically significant.
The main model terms indicated from the ANOVA results that the following factors had a significant impact on the algal BD yield response: catalyst concentration (A), methanol/oil molar ratio (B), reaction temperature (C), and reaction time (D). Additionally, it was discovered that the main factors (AD, AC, and CD) interacted with each other, and the significant quadratic terms were methanol/oil molar ratio (B2) and reaction time (D2). The p-value greater than 0.05 for the lack of fit test, which is insignificant, indicates the model satisfactorily fitted to experimental data. The ideal lack of fit is insignificant because a considerable lack of fit suggests that the model may not have taken into account all possible contributions to the factor-response relationship [13]. Analysis of variance (ANOVA) was used to determine the model’s sufficiency and fitness, as shown in Table 4. The equation accurately described the actual connection between the independent variables and dependent variables, according to the table. The F-value of 49.86 in the ANOVA result for the BD content indicated that the model was significant. The R2 was calculated to be 0.9831, indicating that more than 98% of experimental data were compatible and that the model could account for just 1.69% of the overall variation. The strong adj-R2 score (0.9634) supported the model’s high relevance. The low value of CV, 2.69, indicated that there were few differences between experimental and projected values. Using Design Expert 11.0, the model was then put through one more phase to produce response surface graphs (Stat-Ease Inc.).
Table 3.
Sequential sum of squares for different models toward response using MPA/alumina.
Table 4.
ANOVA table for algal BD production using MPA/Alumina.
Diagnostics
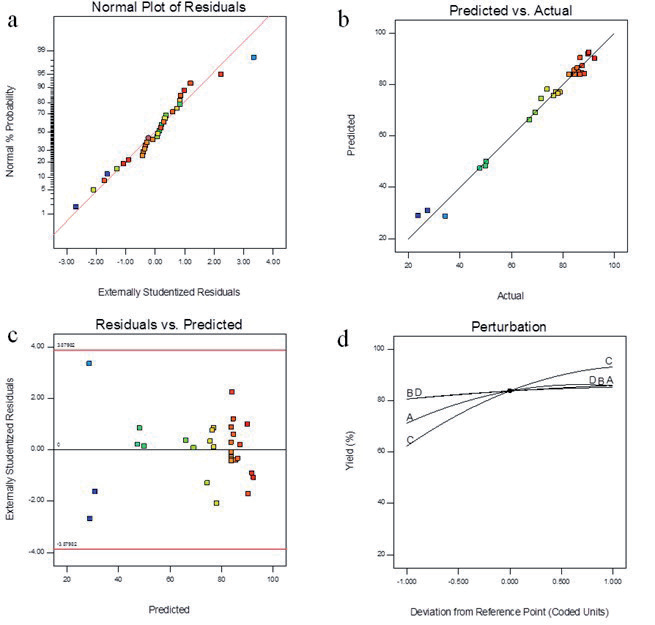
Residuals are the difference between the experimental and predicted yield, and the error’s normal distribution along the straight line is shown by the residual’s normal plot. The residual graph and the structure-less graph of predicted algal yield demonstrate how well the independent variables are captured by the model. As evidenced by the R2 value for the response predicting a straight line, which is nearly equal to unity, the graph of actual yield and predicted yield shows good agreement. The relevance of a particular variable on the response (algal BD yield) is described by a perturbation plot. If the height of the curve for a given variable changes in relation to the horizontal axis, the variable will be important for the outcome [14]. The height variations along the horizontal axis of all the variable curves in the perturbation graph indicate that the variable catalyst concentration and reaction temperature have a considerable impact on the algal BD production, while the other two have very little impact on the algal BD yield. Fig. 1 shows that all four main factors are significant in the model.
Interaction Effect of Catalyst Concentration and Oil-to-Methanol Ratio
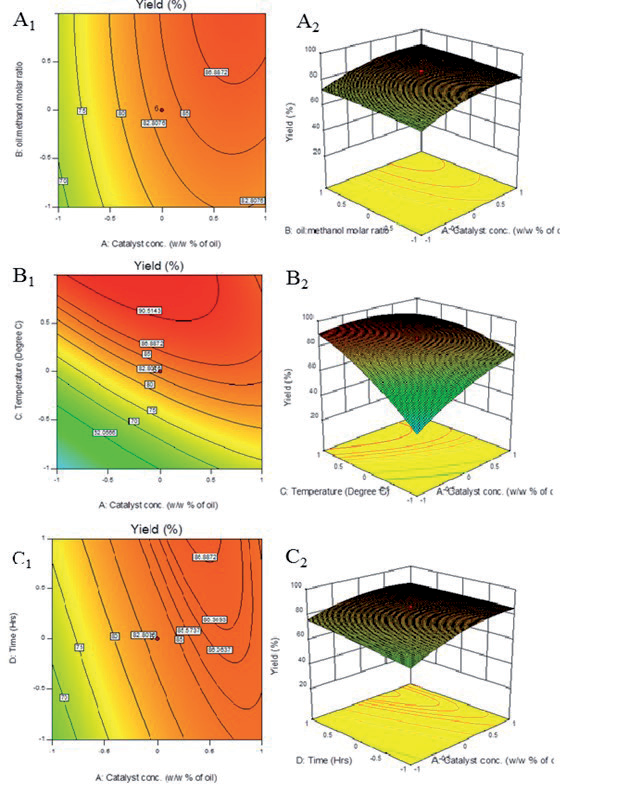
The interactional effect of catalyst concentration and algal oil to methanol ratio, at constant reaction time and temperature at their intermediate levels (180 minutes and 120°C), on algal BD yield is shown in Fig. 2. It is clear from the figure that at low levels of catalyst concentration, there is no appreciable increase in the response with an increase in the algal oil to methanol ratio due to insufficient catalytic surface for the conversion of algal oil to the respective methyl ester. However, with the increase in the oil to methanol ratio, an appreciable increase in algal BD yield from 82 to 90% was suggested by the response surface at high levels of catalyst concentration. The plot also reveals the fact that algal BD yield increases with an increase in catalyst amount due to an increase in active sites of catalyst, even at low levels of oil to methanol ratio. In a comparison of the two operating variables, it is favorable to increase the catalyst amount to provide sufficient surface area for the transesterification to occur rather than the use of a higher amount of methanol reactant for enhancing the algal BD yield because methanol requires an active site at the catalyst surface to react with algal oil.
Interaction Effect of Catalyst Concentration and Reaction Temperature
The interactional effect of catalyst concentration (A) and reaction temperature (D) on the algal BD yield at constant reaction time (180 minutes) and methanol/oil molar ratio (20:1) is shown in Fig. 2. It is clear from the graph that the increment in reaction temperature significantly increases the yield of BD at low catalyst concentrations due to an increase in the kinetic energy of the molecules, and more molecules become able to cross the energy barrier, but it has the opposite impact at high catalyst concentrations and temperatures. At low temperatures, however, the impact of the catalyst quantity is minimal due to the low surface area of the catalyst; yet, as the temperature rose, a linear effect was observed. The catalyst concentration-reaction temperature interaction effect had the greatest impact on the algal BD content among the interaction terms that affected the algal BD yield response. The combination of temperature and catalyst concentration may have had a detrimental impact on the algal BD yield, as evidenced by this interaction effect, which also predicts a decreased algal BD output. This might be a result of the high reaction temperature and high catalyst concentration favoring the triglyceride formation [2]. Soap formation in the reaction medium makes it difficult to separate the algal BD from the glycerol, which lowers the yield of BD. It is then proposed that the reaction took place under conditions where one of these variables had an initial increment at low levels for the second variable. This theory correlated with the contour plot’s pattern (Fig. 2), which demonstrated an increase in BD yield at high temperatures (180°C) with intermediate or low levels of catalyst quantity (2-3 w/w%).
Interaction Effect of Catalyst Concentration and Reaction Time
The interactional effect of catalyst concentration (A) and reaction time (D) on the algal BD yield at constant reaction temperature (120°C) and methanol/oil molar ratio (20:1) is shown in Fig. 2. The response surface graph demonstrated the increase in catalyst amount that led to a considerable rise in algal BD yield from 68 to 88% at a low level of reaction time due to an increase in the active sites of the catalyst for conversion. Although the increase in catalyst amount at a longer reaction time (100 minutes) had a minimal impact on the algal BD yield, it increased from 78 to 88%, which indicated that the reaction proceeded well at a lower reaction time. At a higher level of reaction time and catalyst concentration, the algal BD yield reached the maxima. This was due to the equilibrium point for transesterification, and further proceeding resulted in a reverse reaction, which in turn decreased the BD yield [15]. The three-phase system that makes up the reaction medium (oil, methanol, and catalyst) causes the slowdown of the reaction at higher catalyst concentrations [16]. More than 80% of the BD yield was produced at intermediate and higher levels of catalyst concentration and reaction time (Fig. 2). Conclusively, it is better to perform the process of transesterification at higher concentrations and lower reaction time.
Optimized Conditions
In order to find the ideal set of operating parameters that will produce the highest output of BD, the algal BD synthesis was optimized. To get the best response for the algal BD yield, the parameters were set in the specified range between low (-1) and high (+1) values (Table 5). Based on the model developed and input data, RSM provided solutions using these four variables for the required system response. The ideal conditions for optimized algal BD yield were applied to three separate replicates of MPA/alumina catalyzed transesterification to confirm the validity of the model prediction (Table 6). There is a strong agreement found in the predicted and experimental data with less than 2% error, indicating the validity of the suggested model by the ANOVA.
Table 5.
Optimization criteria for maximum algal FAME yield.
Table 6.
Optimum condition results for model validation.
Conclusions
The optimized set of conditions for average algal BD yield was 3.71% catalyst concentration, 21.67 methanol/ oil molar ratio, 218 minutes reaction time, and 115°C reaction temperature with 93.55% algal BD yield, while 95.55% was the predicted yield, which indicated good agreement between experimental and predicted values calculated by the model (less than 2% error). The predictability and accuracy of the applied model sufficiently backed the experimental BD yield under the reaction conditions used. It is concluded from this study that Chlorella vulgaris can be a superior source for the production of biodiesel, as oil yield per unit area is far better compared to edible and non-edible oil sources. Moreover, dodeca-molybdophosphoric acid supported on alumina can be a good addition in heterogenous catalyzed transesterification. Conclusively, C. vulgaris algal oil conversion to biodiesel using alumina supported dodeca-molybdophosphoric acid could be a better strategy in the future.

