


Introduction
Most Artisanal and Small-scale Gold Mining (ASGM) utilizes mercury (Hg) for the extraction of gold (Au) and is responsible for the largest anthropogenic source of emissions and releases of Hg to the environment [1]. While amalgamation is chosen for its speed, accessibility, and cost-effectiveness compared to other methods, it also results in significant environmental mercury emissions [2-4]. This practice poses significant environmental and public health risks and socioeconomic conditions. Mercury in ASGM operations has resulted in environmental degradation, overexploitation, health issues, and a decline in the socioeconomic well-being of nearby communities [5]. Multiple factors shape the effects of mercury from ASGM operations on the environment, health, and land deterioration. These include mercury emissions into the air, soil, and water and mercury exposure among individuals in this sector [6, 7].
Remediating land contaminated with mercury presents notable hurdles because of the considerable expenses linked with technologies like thermal desorption, solidification/stabilization, and activated carbon adsorption. These approaches are frequently costly and might not be financially feasible for numerous communities, especially those in developing areas where ASGM is widespread [8–10]. While mercury remains in the environment for extended periods, it can undergo chemical changes such as oxidation, dissolution, amalgamation, precipitation, adsorption, and biological processes, altering its chemical forms [11]. Recognizing the dangers posed by mercury use in ASGM, the Minamata Convention has prioritized sector reform to address specific practices of mercury use [12].
Technological interventions are increasingly crucial for reducing and eliminating mercury use in ASGM. Many investigations have examined the efficiency of different intervention methods to decrease worldwide mercury utilization and emissions from ASGM [13]. Cyanidation emerges as a notable technological intervention in ASGM, offering a safer alternative to mercury for gold processing. This method presents a promising avenue for mitigating mercury pollution in ASGM, a critical consideration given the substantial environmental mercury release linked to the amalgamation process [14, 15].
In recent years, cyanidation has extended its reach beyond the gold mining industry to smaller-scale mining operations [16]. Cyanidation techniques in ASGM in Indonesia have seen increasing adoption since the mid-2000s, when this technology was introduced from the Philippines and began operations in North Sulawesi around 2001, eventually spreading across the Sulawesi Sea [17]. Gold cyanidation has spread to several other ASGM areas in Indonesia, encompassing West Java, Banten, Central Kalimantan, South Kalimantan, West Nusa Tenggara, Aceh, and Maluku [16, 18, 19].
Cyanide is a highly toxic and dangerous pollutant, even at low concentrations [20]. The 96-hour LC50 (lethal concentration where 50% of the fish population is killed) for cyanide in trout varies from 0.05 to 0.18 mg/L, whereas for thiocyanate, it ranges from 50 to 500 mg/L. Cyanate’s toxicity LC50 is between 30 and 40 mg/L, contrasting with cyanide’s 0.05 mg/L [21]. Similarly, at certain levels, heavy metals such as arsenic, lead, cadmium, chromium, copper, nickel, and mercury have toxic and carcinogenic effects [22–24].
The use of cyanide in ASGM has been widely reported to significantly contribute to soil, water, and air pollution, resulting in considerable environmental damage [16, 25, 26]. Moreover, the use of cyanide in ASGM is linked to damage to Indonesia’s aquatic environment, including water pollution, disruption of irrigation systems, and harm to land and agriculture [27]. The absence of appropriate technology for treating cyanide waste in ASGM operations has been identified as a critical factor contributing to environmental pollution and posing risks to local communities [28].
Various techniques are used to remove cyanide species from gold tailings, including sulfur dioxide (SO2) oxidation and hydrogen peroxide (H2O2) oxidation [29–31], alkaline chlorination [32], titania sol, a type of titanium dioxide [33], calcium and sodium hypochlorite [34], corncob biochar (CB) and chlorine dioxide (ClO-) [31], biological processes [35-37], incineration, and medium-temperature roasting [38].
The treatment of cyanide waste poses challenges in ASGM due to limited knowledge, access to finance, and local resources. When researching cyanide waste destruction in ASGM, several considerations should be considered. These include ensuring that chemical sources and supporting materials are readily available, ensuring that the operation is simple and understandable for ASGM workers and supported by local resources, effective destruction of free cyanide present in both liquid and solid phases, precipitation of metals present in tailings, relatively short processing time, and cost-effectiveness. Considering these factors, research was undertaken to enhance cyanide waste treatment through the sulfur dioxide and air process, employing sodium metabisulfite (Na2S2O5) and copper (II) sulfate (CuSO4.5H2O) as catalysts.
Several statistical methods can be used to analyze the optimal values of some process parameters or variables. These statistical methods include the t-test, analysis of variance (ANOVA), and Response Surface Methodology (RSM). The t-test is usually used to compare the average of one sample of one size with the average of another sample of the same size. The results of the t-test are used to draw conclusions about how different the samples are from each other. This is probably one of the most frequently relied-on statistics in inferential research [39]. ANOVA assesses the significance of factors influencing response variables in experiments involving multiple parameters. This helps in determining whether there is a statistically significant difference between the mean of the different groups [40, 41]. RSM is specifically designed to optimize processes that depend on several variables. It uses statistical techniques to model and analyze the relationship between multiple independent variables and one or more response variables. RSM effectively determines optimal conditions for a process by adapting the polynomial model to the data and exploring the response surface to find the best settings for the parameters involved [39, 40, 42].
Previous research has successfully conducted statistical analysis with t-tests to understand the nutritional and pharmaceutical value of A. aspera seeds and leaves, which are rich in amino acids, fatty acids, vitamins, and minerals and have a wide scope for applications in the fish feed industry [43]. Another study with statistical analysis using one-way variance analysis (ANOVA) and the Duncan double-range test shows that macrophytes have an immense potential to be used as rich sources of minerals, as well as n-6 and n-3 PUFA for fish, poultry, and livestock [44]. Some examples of research results using the Response Surface Methodology (RSM) for the destruction of free cyanide waste are Treatment of Cyanide Contaminated Wastewater Using Layered Double Hydroxides [45], Optimization of Cyanide Removal Using Granular Activated Carbon [46], Chemical Oxidation of Cyanide with Hydrogen Peroxide [47], and Photocatalytic Degradation of Cyanide Using TiO2 [48].
In this study, the RSM approach has been used to optimize the cyanide waste destruction process. RSM is a factorial/experimental design for optimizing a solid bond between one or more target variables. Moreover, it is the key to gaining the finest results through various exclusive experiments. The second-degree polynomial model is usually used to achieve this. Even though RSM is a hypothetical model, scientists and researchers use it to make estimations [49].
The adoption of RSM in optimizing the cyanide waste destruction process is driven by efficiency in experimental design, modeling, predictive capabilities, robustness and flexibility, and a robust statistical framework. Compared to traditional optimization methods, RSM offers a more structured experimental approach. In comparison, methods such as grid search may involve testing a combination of parameters without systematic design. RSM allows for selecting more strategic experimental conditions based on previous results, making it the preferred choice in industrial applications [50, 51]. This can lead to faster convergence at optimal conditions for destroying cyanide waste using sulfur dioxide and air processes.
This research targets optimizing gold ore cyanidation waste processing from ASGM operations in Tatelu Village, North Minahasa Regency, North Sulawesi Province, Indonesia. Cyanide waste treatment is facilitated by a reactor equipped with an aeration system that supplies oxygen and serves as a stirrer. The equipment’s design prioritizes simplicity, leveraging local resources, and ensuring comprehension aligns with the knowledge level of ASGM miners.
The focus of waste treatment is on reducing and potentially eliminating free cyanide (CN-) from the waste to ensure compliance with environmental standards (< 0.5 mg/L), as stipulated in the Decree of the Minister of Environment of the Republic of Indonesia No. 202 of 2004, which sets out wastewater quality standards for business entities engaged in gold and/or copper ore mining activities [52].
Material and Methods
Materials and Equipment
The cyanide waste used in the research is tailings from the gold ore cyanidation process of ASGM in Tatelu Village, North Minahasa Regency, North Sulawesi Province, Indonesia. The cyanide waste has characteristics of solid particle size with 75% passing through 74 µm, slurry density of 35%, and measured CN- content at several gold processing sites between 54–238 mg/L. To facilitate the sample shipment process for the research, 50 kg of solid cyanide waste was extracted. This waste was then reconstituted into a slurry with a 35% solids density, and sodium cyanide (NaCN) was added to adjust the CN- content to approximately 200 mg/L.
The materials and reagents used consist of distilled water, Whatman filter paper with a diameter of 47 mm and pore size of 0.45 µm, sodium metabisulfite (Na2S2O5) pro-Merck analyst, copper (II) sulfate (CuSO4.5H2O) pro-Merck analyst, locally produced lime, and CyaniVer™ 3, 4, and 5 Cyanide Reagent Powder Pillows, 10 mL, as reagents for CN- analysis.
This research utilizes measurement and analysis equipment, including the HANNA Instruments HI-98196 Multiparameter pH/ORP/DO/Pressure/Temperature Waterproof Meter, manufactured in Japan, for measuring pH, dissolved oxygen (DO), and temperature; sample preparation tools, including centrifuges, filtration equipment, and glassware; and the HACH DR/2010 Spectrophotometer, manufactured in the USA, for CN- analysis.
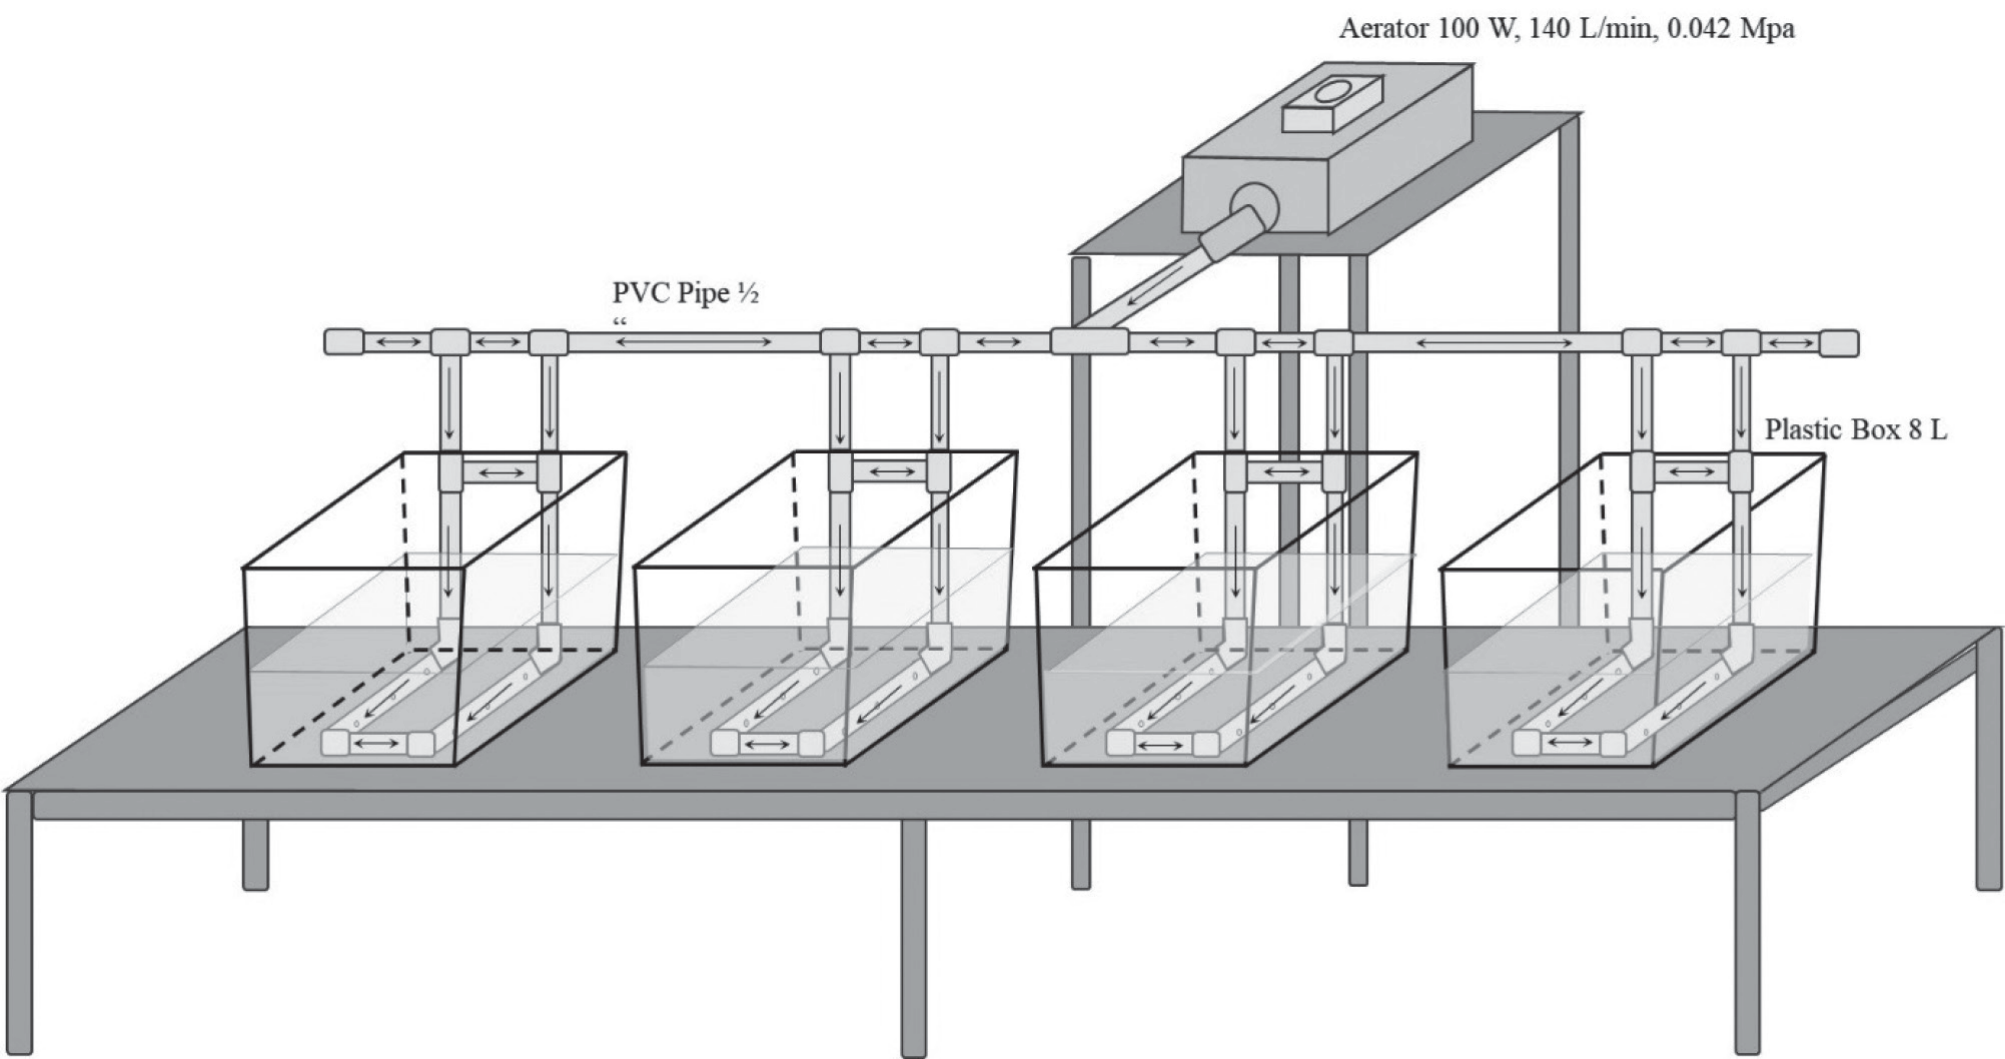
The reactor utilized in the cyanide waste treatment process is a custom-made laboratory-scale prototype with a capacity of 5 L per batch. Engineered for tailings treatment, this reactor incorporates an aeration system, eliminating the necessity for separate agitators as stirrers. Alongside its primary function of oxygen supply, the aeration system also serves as a stirring mechanism. The materials and equipment employed are readily accessible and do not necessitate specialized skills or fabrication equipment. This design prioritizes adaptability and reproducibility for ASGM, facilitating ease of scale.
The materials and equipment employed in manufacturing the laboratory-scale waste treatment reactors are as follows: The cyanide waste treatment reactor comprises plastic containers with a volume of 8 L; an air distribution system from the aerator utilizing 1/2 inch PVC pipe, 1/2 inch hose, and 1/2 inch hose nipple; the aerator employs a Resun LP 100 air pump, manufactured in China, with a voltage of 220–240 V, frequency of 50/60 Hz, power rating of 100 watts, air output of 140 L/min, and pressure of 0.042 Mpa. The prototype of the laboratory-scale cyanide waste treatment reactor is depicted in Fig. 1.
Sulfur Dioxide and Air Process for Cyanide Waste Treatment
INCO Limited pioneered the sulfur dioxide (SO2) and air method in the 1980s, which is now operational globally at more than thirty mine locations. This process involves using SO2 and air under alkaline conditions with a soluble copper catalyst to convert cyanide into the less harmful cyanate compound [53].
Theoretically, 2.46 grams of SO2 per gram of CN- oxidized are anticipated in the process, but practically, the actual usage typically ranges between 3.5 and 5.0 grams of SO2 per gram of CN- oxidized. The necessary SO2 can be provided either as compressed liquid sulfur dioxide or through a reduced-sulfur compound like Na2S2O5, sodium sulfite (Na2SO3), or ammonium bisulfite (NH4HSO3). Oxygen (O2) is also essential for the reaction and is commonly introduced by aerating atmospheric air into the stirred reaction vessel. The reaction typically occurs at a pH level ranging from approximately 8.0 to 10.0 in one or multiple stirred tanks, with lime added to neutralize the acidity generated during the reaction. Lime usage generally exceeds 3.0 to 5.0 grams per gram of CN- oxidized. Copper (II) (Cu2+) acts as a catalyst and is usually introduced as a copper (II) sulfate (CuSO4·5H2O) solution to achieve a copper concentration between approximately 10 to 50 mg/L, contingent upon the initial cyanide level [53].
In this research, SO2 was sourced from Na2S2O5 and Cu2+ as catalysts using copper (II) sulfate (CuSO4·5H2O). Several studies show that with a weight ratio of SO2/ CN- 7, Cu2+ 75 mg/L can reduce CN- from 95.8 mg/L to 0.25 mg/L at process pH 9 within 4 hours [54]; the best conditions for cyanide destruction from leachate tailings (30.66 mg/L) first treated in 0.5 g/L Na2S2O5 (SO2/CN- weight ratio 11), CuSO4 0.2 g/L (Cu2+ 50 mg/L) at pH 10 for 3 hours, and then 2 mL/L H2O2 added to tailings at pH 9 for 4 hours, can meet the backfilling requirements (0.05 mg/L) [29]; with a weight ratio of Na2S2O5/CN- 75 (SO2/CN- 25), Cu2+ 50 mg/L can reduce CN- from 95 mg/L to 0.006 mg/L at process pH 9 within 5 hours [30]. The results of this research are considered when determining process parameters in research conducted using the RSM approach, both for fixed and independent variables.
Optimization of Cyanide Waste Destruction by RSM Approach
RSM comprises mathematical and statistical tools used to model and analyze situations where multiple variables impact a desired response to optimize this response. In most RSM scenarios, the specific relationship between the response and the variables affecting it is not initially understood. Therefore, the primary task in RSM involves identifying an appropriate estimate for the functional connection between the response (y) and the array of independent variables. Typically, a low-level polynomial within a defined range of independent variables is utilized. If the response can be adequately represented by a linear combination of the independent variables, then the approximation becomes a first-order model [55].
Y is the response, X is the independent variable, βo is the intercept, βi is the linear coefficient, and ε is the error.
The relationship between the independent variable and the response is curve-shaped, so the model of order 2 is a model that corresponds to the following equation [46].
Y is the response, Xi and Xj are independent variables, βo is the intercept, βi is the linear coefficient, and ε is the error.
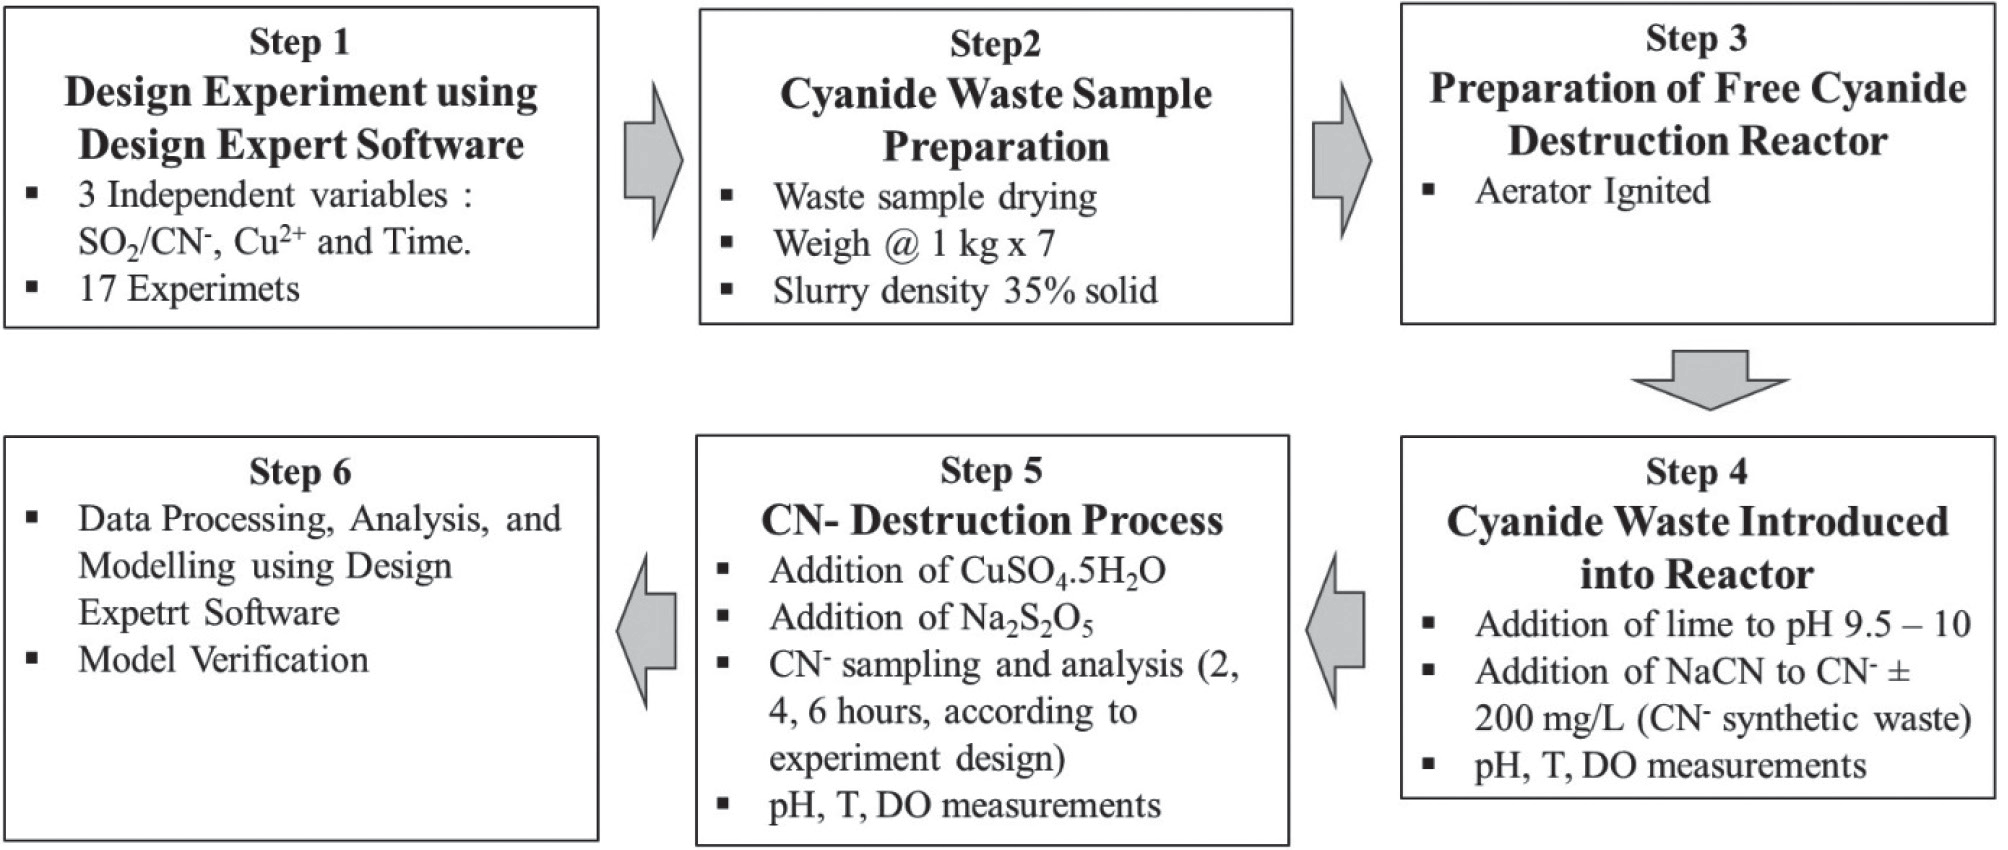
Fig. 2 summarizes the research procedure for optimizing cyanide waste destruction. The research procedure refers to free cyanide destruction by sulfur dioxide and an air process catalyzed by Cu2+ [53], with the experimental design of the RSM Box Behnken method conducted through Design Expert Software [56].
Step 1. The response design was performed using Design Expert® software, version 23 [56], with the Box-Behnken method. Some of the variables used are fixed variables and independent variables. Fixed variables are cyanide leaching tailing with a solid particle size of 75% – 75 µm, synthetic-free cyanide concentration±200 mg/L according to the measured value in ASGM gold processing waste in Tatelu, initial pH 9.5–10, room temperature, and dissolved oxygen (DO) by injection from free air using an aerator. The independent variable can be seen in Table 1.
The optimum response variable is a destruction in the concentration of CN- in the waste close to even less than 0.5 mg/L according to cyanide waste quality standards. Then, RSM will provide data on conditions that must be run in the laboratory to see the model’s suitability. Based on Table 2., 17 experiments must be conducted.
Step 2. Based on the experimental design, solid cyanide waste was dried in an oven for 24 hours at 105°C, then weighed 1 kg × 17. Each solid cyanide waste is made into a slurry by adding water with a sludge density of 35% solids.
Step 3. Laboratory-scale waste destruction equipment is prepared, and aerators are ignited.
Step 4. Cyanide waste is fed into the equipment. Lime is added until the initial pH reaches approximately 9.5. DO is obtained by pumping room air from the aerator, and the temperature is maintained at room temperature. NaCN is added to adjust the CN- concentration to 200 mg/L in the waste.
Step 5. CuSO4.5H2O and Na2S2O5 were used according to the concentration set in the experimental design. Periodic pH, DO, temperature measurements, sampling, and CN- content analysis were performed, with sampling time as designed every 2, 4, and 6 hours. The total number of experiments was 17 trials.
Table 2.
Design of cyanide-free destruction experiment with three independent variables.
| Run | Factor 1 | Factor 2 | Factor 3 | Response |
|---|---|---|---|---|
| A:SO2/CN- | B: Cu2+ | C: Time | CN- Destruction* | |
| - | mg/L | Hours | % | |
| 1 | 7 | 50 | 2 | |
| 2 | 10 | 75 | 6 | |
| 3 | 10 | 50 | 4 | |
| 4 | 10 | 75 | 2 | |
| 5 | 10 | 25 | 6 | |
| 6 | 10 | 50 | 4 | |
| 7 | 10 | 50 | 4 | |
| 8 | 13 | 50 | 2 | |
| 9 | 10 | 25 | 2 | |
| 10 | 13 | 50 | 6 | |
| 11 | 7 | 50 | 6 | |
| 12 | 7 | 75 | 4 | |
| 13 | 13 | 75 | 4 | |
| 14 | 10 | 50 | 4 | |
| 15 | 10 | 50 | 4 | |
| 16 | 7 | 25 | 4 | |
| 17 | 13 | 25 | 4 |
Step 6. After the CN- waste destruction experiment, CN- destruction data were obtained from 17 experiments. Data analysis and response models were done using Design-Expert® software. The analysis includes statistical tests of prospective models, analysis of variance, formulation of mathematical equations, and analysis of independent variable interactions on the presentation of CN- destruction.
Results and Discussion
Process Parameters and CN- Destruction Experiment
Results using Sulfur Dioxide and Air Process
Based on 17 experimental runs, the average initial pH was 9.48±0.065 during the CN- destruction process. Within the first hour, the pH decreased to an average of 7.94±0.28. During the CN- destruction process, the reaction’s pH was upheld at ≥ 8 by introducing lime if it declined below this threshold. At pH levels below 8, soluble cyanide becomes volatile (Adams, 2013). The decrease in pH observed in the CN- destruction process from gold cyanidation waste is a result of the decomposition of CN- by SO2 and air. This decomposition process involves the oxidation of hydrogen cyanide (HCN) and CN- to carbon dioxide and nitrogen, respectively. SO2 acts as an oxidizing agent to facilitate this reaction. The pH decrease is primarily due to the formation of acidic by-products, such as sulfuric acid (H2SO4) and carbonic acid (H2CO3), during the decomposition process [38].
DO obtained from outside air injected through an aerator averaged 4.21±0.73 mg/L. The effect of DO in the destruction of CN- is critical to the effectiveness of the treatment. This process requires a minimum of 3 ppm DO to facilitate the reaction [57].
The process temperature was maintained at room temperature, with an average of 28.82±0.89°C. CN- could volatilize at temperatures slightly above ambient levels, as its boiling point is 25.6° C [58]. This implies that temperatures exceeding 25.6° C might enhance the destruction of CN-. The results of the CN- destruction experiment using a SO2 and air process are summarized in Table 3.
The data in Table 3. will be analyzed using Design Expert Software to formulate a mathematical equation describing variables influencing the percentage destruction of CN-. If deemed suitable and statistically valid, this equation can serve as a model for the CN- destruction experiment. Subsequently, the model will be used to predict responses under desired conditions. Developing a mathematical model from experimental design data involves conducting statistical tests to assess the suitability and accuracy of the proposed model.
Table 3.
Data from CN- -destruction experiment using SO2 and air process.
Table 4.
Summary of statistical analysis results for CN- destruction model selection.
Statistical Analysis of Model Conformity in RSM
The selection of statistical models for CN- destruction is determined through various analyses, including sequential model sum of squares, lack-of-fit tests, model summary statistics, and Whitcomb score analysis. Table 4 summarizes the results of statistical analyses.
Table 4. displays the quadratic model with the highest F-value of 219.44, indicating its effectiveness in explaining data variations, alongside the smallest p-value of <0.0001. The Sequential Model Sum of Squares has a p-value below 0.05 (p < 5%), suggesting an error rate of less than 5%. Furthermore, the p-value serves to signify the statistical significance and consistency of results upon repetition.
The lack-of-fit test for CN- destruction yielded a quadratic model with a p-value of 0.1266 (12.66%), indicating no lack of fit and thus recommending its adoption. Quadratic models exhibit an R² value of 0.9967, an adjusted R² of 0.9924, and a predicted R² of 0.96, superior to linear and 2FI models with lower Predicted Residual Sum of Squares (PRESS) values, making them favorable for CN- destruction.
Despite the cubic model boasting higher R² and adjusted R² values, its undefined predicted R² and PRESS render it aliased. Based on Whitcomb Score analysis, the quadratic model emerges as the optimal choice due to its consistent results and highest Score 1 and Score 2.
Table 5.
Results of variance analysis for CN- destruction quadratic model.
The Analysis of Variance (ANOVA) for the CN⁻ Destruction Quadratic Model
The quadratic model, selected as the preferred model, is then analyzed using ANOVA, as shown in Table 5.
According to the ANOVA results (Table 5), the significant F-Model value of 233.51 indicates the significance of the model. With such a high F value, there is only a 0.01% chance of it occurring due to noise. P-values less than 0.0500 suggest significance for model terms. In this case, terms A, B, C, AB, A², and C² are deemed significant. Conversely, values greater than 0.1000 indicate insignificance. If there are numerous insignificant model terms (excluding those necessary for hierarchy), model destruction may enhance performance. The Lack of Fit F-value of 3.54 suggests insignificance relative to pure error, with a 12.66% chance of such a value occurring due to noise. Insignificant discrepancies are favorable, indicating the model’s appropriateness.
CN- Destruction Response
Based on the test results, a quadratic model for CN- destruction can be established as a response surface model incorporating the weight ratio of SO2/CN-, Cu2+ catalyst concentration, and processing time. The coefficients of the equation representing the CN- destruction factor code are provided in Table 6.
The resulting model is expressed as a mathematical equation as follows:
Y: CN- destruction (%)
A: SO2/CN- Weight ratio
B: Cu2+ concentration (mg/L)
C: Time (Hours)
Based on the coefficients of the equation in Table 6, the predicted value will be calculated to determine the difference in error from the experiment. The model is validated with experimental data to guarantee that the predicted model matches the estimates or estimates of the experimental data. Table 7. shows the results of calculating the edition value of the equation entered by each coding value (A, B, and C), and then comparing the experimental value and the predicted value to calculate the difference in error.
Table 7.
Experimental and predicted CN- CN-destruction research data.
The model’s accuracy is illustrated in Fig. 3., which compares actual and predicted values. The distribution of actual values, represented by boxes, and predicted values, depicted as linear lines, is displayed in the Figure. The actual research data is scattered around the line, with many values closely aligned. This distribution yields a standard deviation value of 0.4744 and an R2 value of 0.9967. A higher R2 value, approaching 1, indicates a better-fitting model, with actual values closely distributed around the predicted values.
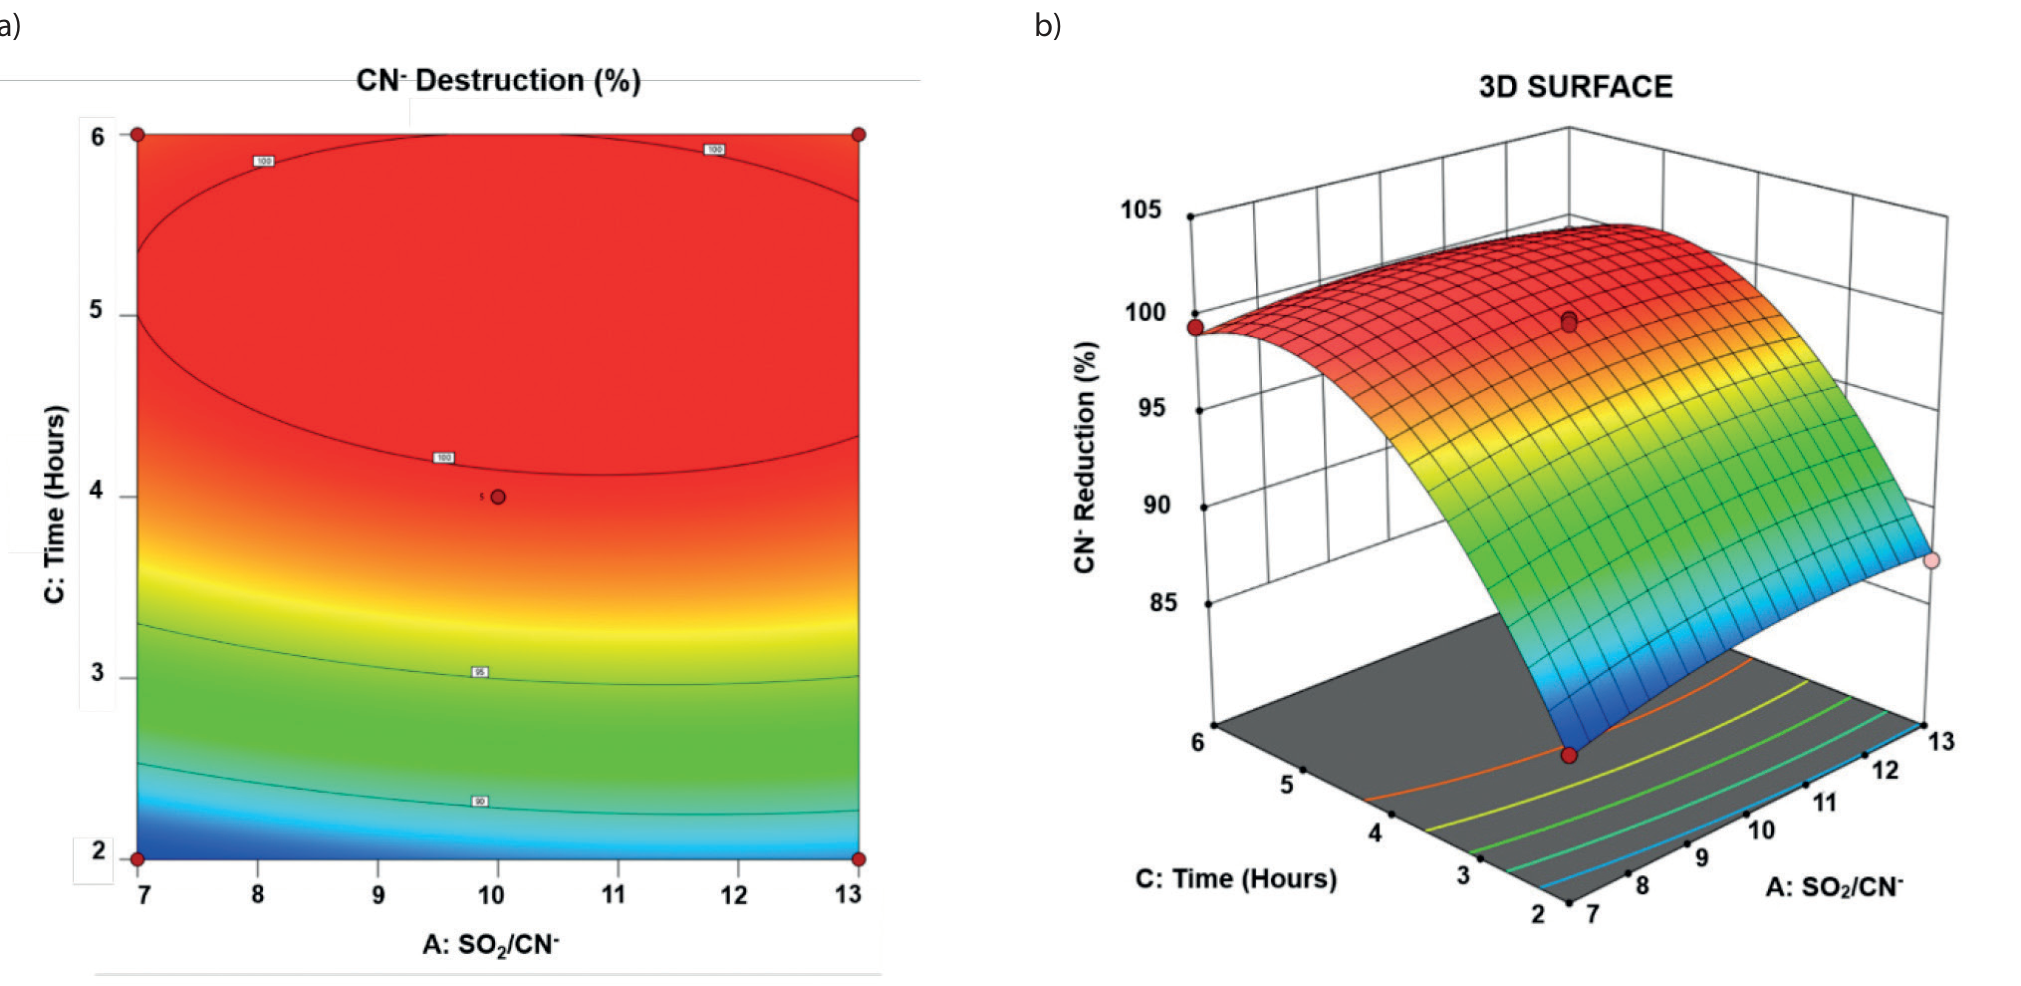
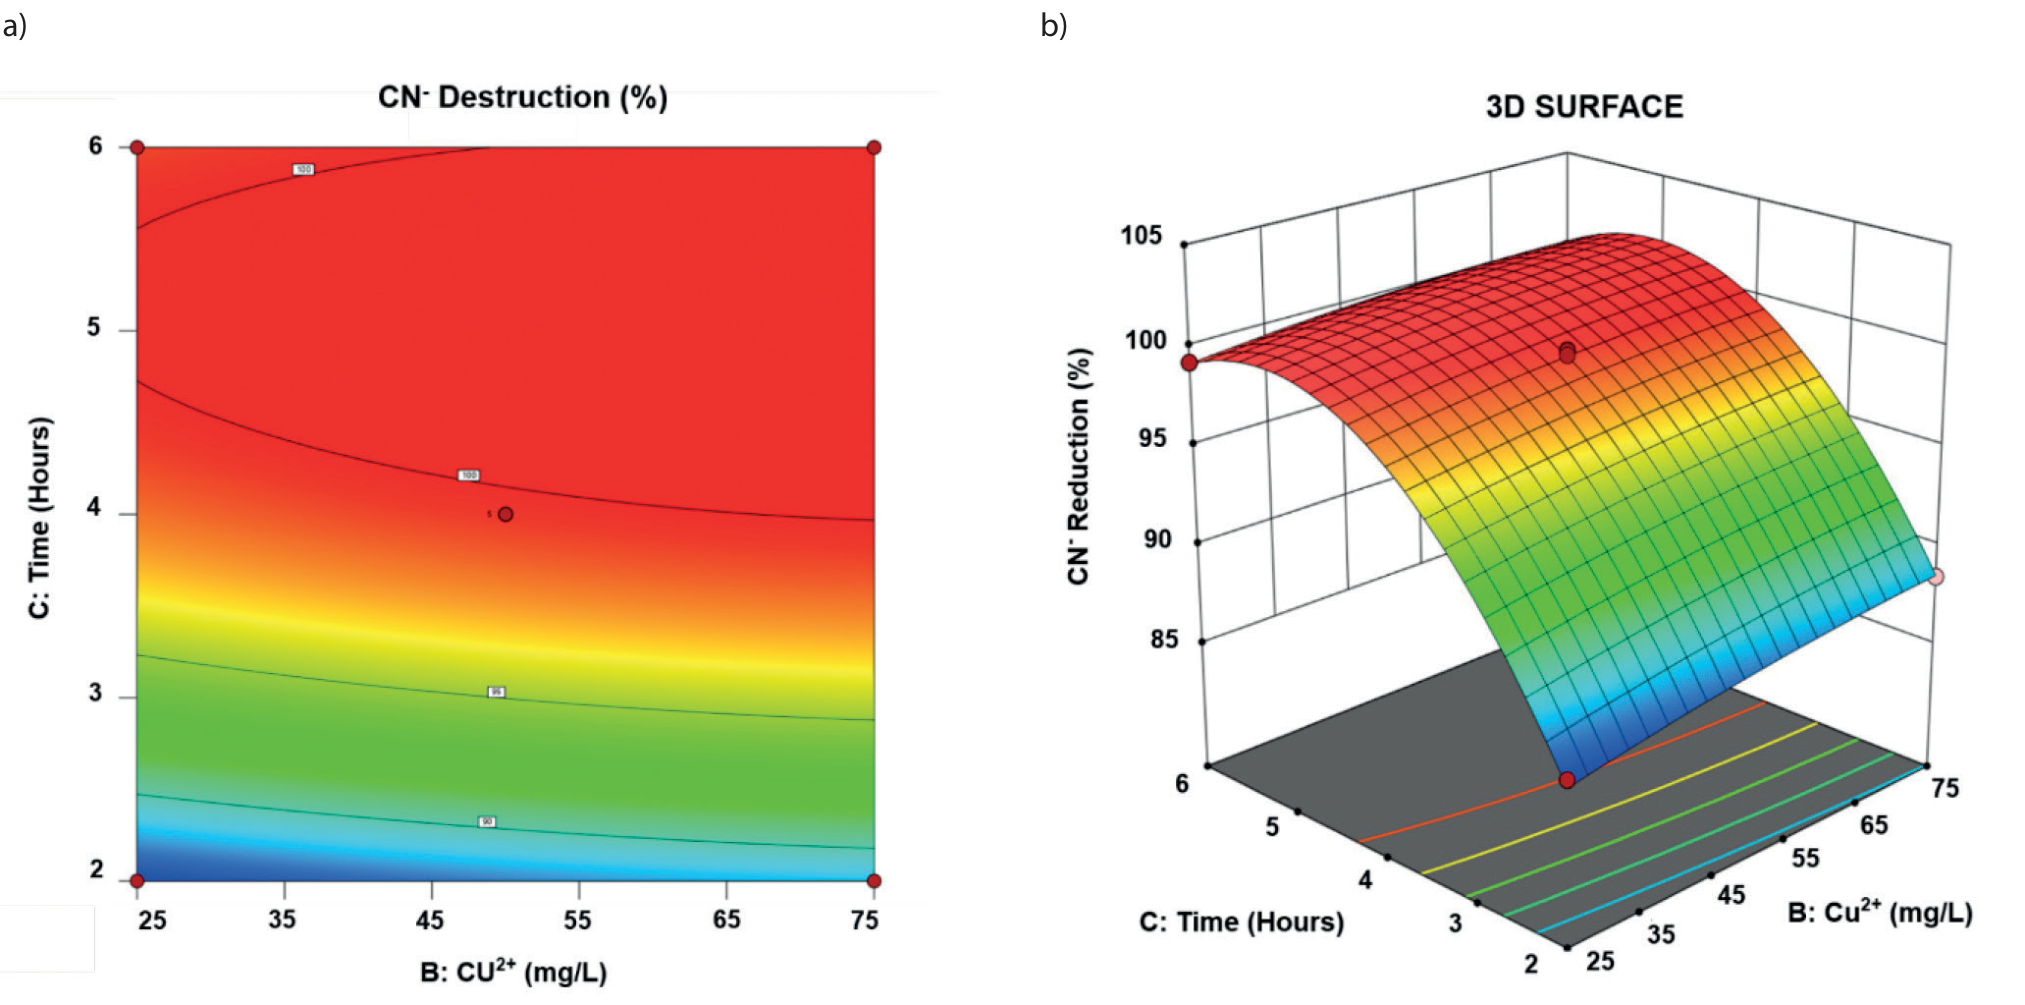
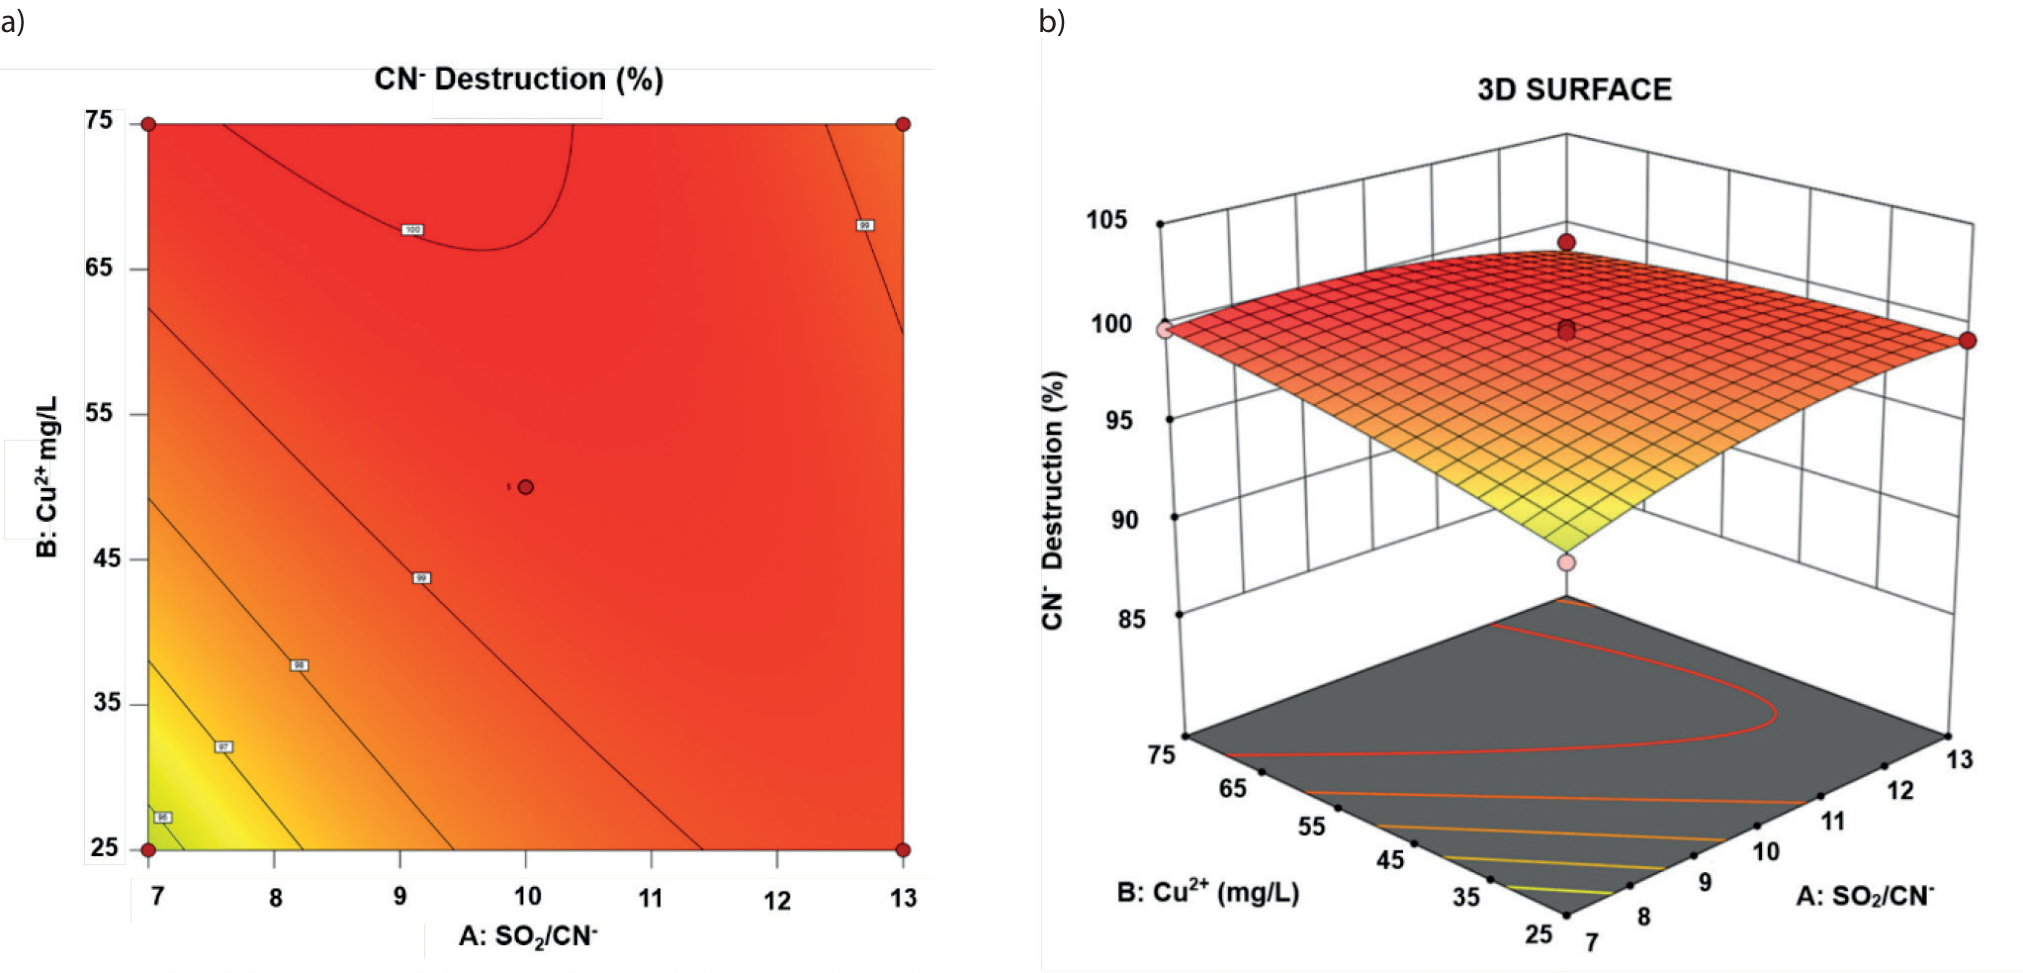
The model obtained will be depicted in surface contour graphs and three-dimensional surfaces, illustrating interactions between variables. The Figure represents the surface response of the percentage yield of CN- destruction, reflecting the impact of the SO2/CN- weight ratio and Cu2+ catalyst concentration on the time required for CN- destruction.
Interaction of Process Time
and SO2/CN- Weight Ratio on CN- Destruction
Fig. 4. shows that with a weight ratio of SO2/CN- between 7 and 13, the CN- destruction percentage value increases with longer processing times. During CN- waste destruction treatment lasting between 2 and 4 hours, with a weight ratio of SO2/CN- between 7 and 13, the percentage of CN- destruction gradually increases from less than 90% to close to 100% over 4 hours, after which it stabilizes. The optimum point for CN- destruction occurs at a SO2/CN- weight ratio of 10, with a processing time of 4 hours.
Interaction of Process Time and Cu2+ Concentration on CN- Destruction
Fig. 5. shows that the CN- destruction percentage value increases with a Cu2+ catalyst concentration between 25 and 75 mg/L with longer processing times. During CN- destruction treatment lasting between 2 and 4 hours, with a Cu2+ concentration of 25 to 75 mg/L, the percentage of CN- destruction gradually increases from less than 90% to close to 100% at 4 hours, after which it stabilizes. The optimum point for CN- destruction with Cu2+ concentration is at 50 mg/L, with a processing time of 4 hours.
Interaction of the SO2/CN- Weight Ratio
and Cu2+ Concentrations on CN- Destruction
Fig. 6 demonstrates that as the weight ratio of SO2/ CN- and the concentration of Cu2+ catalyst increase, there is a corresponding increase in the percentage of CN- destruction. For instance, at a weight ratio of SO2/ CN- between 7 and 10 and a Cu2+ catalyst concentration of 25 to 50 mg/L, the CN- destruction percentage gradually rises from 96% to over 99%. However, at a weight ratio of SO2/CN- of 13 and a Cu2+ catalyst concentration of 75 mg/L, the CN- destruction percentage decreases to less than 99%. The optimal destruction point for CN- is achieved at a weight ratio of SO2/CN- of 10 and a Cu2+ catalyst concentration of 50 mg/L.
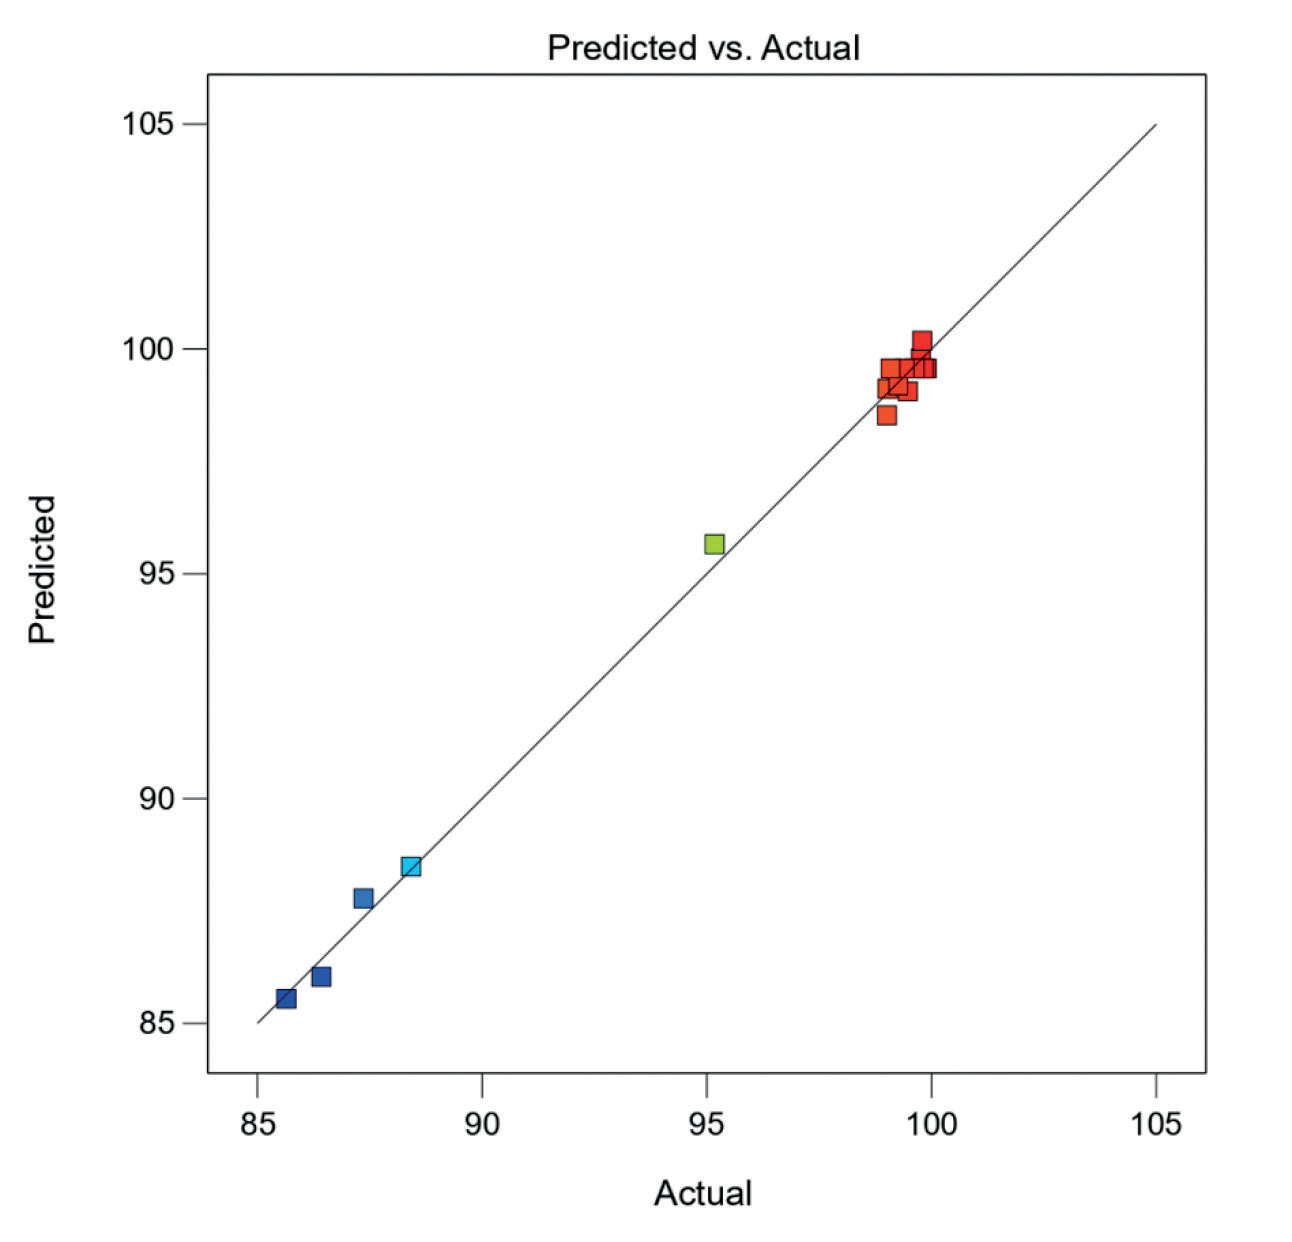
Fig. 4.
Interaction of process time and SO2/CN– weight ratio on CN– destruction : a) 2D surface contour plot, b) 3D surface contour plot.
Model Verification
After undergoing a series of analysis processes, the design expert software offers optimization recommendations based on the design. These recommendations, aimed at CN- destruction, involve a weight ratio of SO2/CN- 10, a catalyst concentration of Cu2+ at 50 mg/L, and a processing time of 4 hours. These parameters are projected to yield maximum values for CN- destruction, with a predicted destruction rate of CN- 99.568%. Subsequently, the model undergoes verification through laboratory testing to assess the alignment of experimental results with the model’s predictions. During model verification, tests were conducted not only on cyanide waste with an initial concentration of CN- 200 mg/L but also for initial concentrations ranging from CN- 300 mg/L to CN- 100 mg/L in intervals of 50 mg/L. Each test was repeated three times; the results are detailed in Table 8.
Table 8. illustrates model verification results through CN- destruction retesting. Average results exceed the predicted value of 99.568% for initial CN- concentrations of 250, 200, 150, and 100 mg/L, with tolerance ranging between 0.095% and 0.197%. Conversely, at an initial CN- concentration of 300 mg/L, the average percentage falls below the predicted value by 0.010%.
Table 8.
Model verification results for CN-destruction at various initial concentrations (mg/L) with SO2/CN- weight ratio 10, Cu2+ catalyst concentration 50 mg/L, and 4 hours processing time.
Based on the concentration criteria CN- ≤ 200 mg/L, a SO2/CN- weight ratio of 10, Cu2+ catalyst concentration of 50 mg/L, and 4 hours processing time, achieve CN- destruction to < 0.5 mg/L, meeting environmental standards per the Decree of the Minister of Environment of the Republic of Indonesia No. 202 of 2004, which stipulates wastewater quality standards for gold and/or copper ore mining entities.
Though CN- concentrations of 250 mg/L and 300 mg/L slightly exceed environmental standards post-destruction, they significantly decrease toxicity compared to initial concentrations. In settled ponds, UV light naturally reduces cyanide concentrations. Studies indicate that UV light initiates the photochemical degradation of free cyanide [59-61], a process further enhanced by photocatalysts like titanium dioxide (TiO2), achieving complete degradation after 5 hours of illumination [60].
In the process of cyanide waste destruction using SO2 and air process, Na2S2O5 must be weighed for SO2 gas production and CuSO4. 5H2O is used as a Cu2+ catalyst. To simplify application in ASGM, the weight ratio SO2/ CN- can be replaced with Na2S2O5/CN-. The calculation of Na2S2O5 requires an approach based on the dissolving reaction of Na2S2O5 when dissolved in water [54]:
Referring to reactions (2) and (3), 1 mole of Na2S2O5 yields 2 moles of SO2 gas. The required amount of Na2S2O5 can be calculated based on its purity using the equation:
(4)
After optimization with RSM, the optimal concentration for the SO2/CN- weight ratio is 10. Subsequently, equation (4) is modified to:
The following equation calculates the amount of CuSO4.5H2) required for the experiment, with a purity level of 99%.
(6)
M: Molarity
Mr: Relative molecule mass
Ar: Relative atomic mass
After optimization with RSM, the optimal concentration for Cu2+ as a catalyst is 50 mg/L. Consequently, equation (6) is modified to:
Based on the optimization results of CN- destruction using SO2 and air processes with the RSM approach, equations (5) and (7) can be utilized to determine the optimal requirements for Na2S2O5 and CuSO4.5H2O as catalysts in the CN- destruction process, targeting a concentration of ≤ 200 mg/L from cyanide waste in ASGM operations in Tatelu Village.
In Tatelu village and other ASGM areas, there is a lack of sufficient knowledge regarding the chemical process and calculation of Na2S2O5 and CuSO4.5H2O requirements for CN- destruction. To address this, Na2S2O5 and CuSO4.5H2O needs for operations can be summarized in a reference table based on the gold processing unit capacities with cyanidation available in the ASGM area, as shown in Table 9.
Table 9.
The need for sodium metabisulfite and copper sulfate catalyst for the destruction of cyanide waste, with a concentration of CN- ≤ 200 mg/L.
Conclusions
This research employed a response surface methodology (RSM) approach to optimize the destruction of free cyanide from gold cyanidation waste using the sulfur dioxide and air processes catalyzed by copper. The optimized process parameters were determined to be an SO₂/CN⁻ weight ratio of 10, a copper (II) catalyst concentration of 50 mg/L, and a treatment time of 4 hours. Under these conditions, the free cyanide concentration was effectively reduced from 200 mg/L to less than 0.5 mg/L, meeting the strict environmental standards set by the Indonesian Government.
The developed cyanide destruction process utilizes readily available materials and equipment, making it suitable for implementation in artisanal and small-scale gold mining (ASGM) operations. This provides a practical solution for addressing the environmental and health risks posed by cyanide waste from the transition from mercury-based gold extraction to cyanidation in ASGM. The successful optimization of the cyanide destruction process demonstrates the feasibility of a sustainable approach to gold processing in ASGM, helping to mitigate the negative environmental impacts while supporting the economic benefits this sector provides to local communities. Further research and dissemination of this technology can contribute to the broader goal of responsible mineral resource development in Indonesia and other regions where ASGM is prevalent.

