

Introduction
Currently, man-made countries account for almost 3% of land areas, and this share will increase due to the growing urban population, which is expected to reach 66% of the world’s population by 2050 [1]. According to a report by Eurostat, the statistical office of the European Union, the Czech Republic, together with the Romanian countries, experienced the most significant increases in the area of motorways between 2010 and 2019. The main reason is considered to be the lack of infrastructure in these countries before 2000. In the Czech Republic, by 2020, roads and motorways covered an area of 55,768 km2, but motorways accounted for only 1,276 km2. The largest motorway is the D1 motorway, with a length of 366 km2, which connects Prague (the capital) and Brno (the Moravian metropolis) and continues around Olomouc and Ostrava to the Polish border (report by the Directorate of Roads and Motorways). The construction of motorways in the Czech Republic is often accompanied by the occupation of agricultural land, and the lanes around the motorways are usually sown with greenery or farmed [2].
Urban soil around motorways, like other soils, is formed by 6 soil-forming factors, i.e. climate, relief, parent material, vegetation, time, and human intervention, while the latter urban soil dominates and, to varying degrees, can indirectly affect other factors [3].
Some heavy metals (HMs), such as copper (Cu) and zinc (Zn), are essential for living organisms, including plants [4]. However, these metals and those that are considered insignificant, namely cadmium (Cd) and lead (Pb), may pose a risk if their bioavailability in soil is high [5]. Their toxicity can have negative effects on plants, such as root damage and growth retardation, leaf chlorosis and leaf brown discoloration, or deformation of young leaves [4]. This is another reason for intensive research into soil toxicity and ways to determine it. Some authors emphasize that bio-assays are a good complement to chemical analysis in soil toxicity assessment procedures [6].
Therefore, the main objective of the study was to find out the extent of contamination of the soil around highroad areas. The specific objectives were:
1) to determine the content of Hg, Cu, and Pb in the soil samples; 2) to identify the spatial distribution of these elements; 3) to calculate the indices assessing the level of contamination and health risks; and 4) to compare the obtained values to the ones published in other research studies. The main novelty of the present work is connected with using phytotoxicity testing to supplement the research on contamination in soil around roads.
Study Area
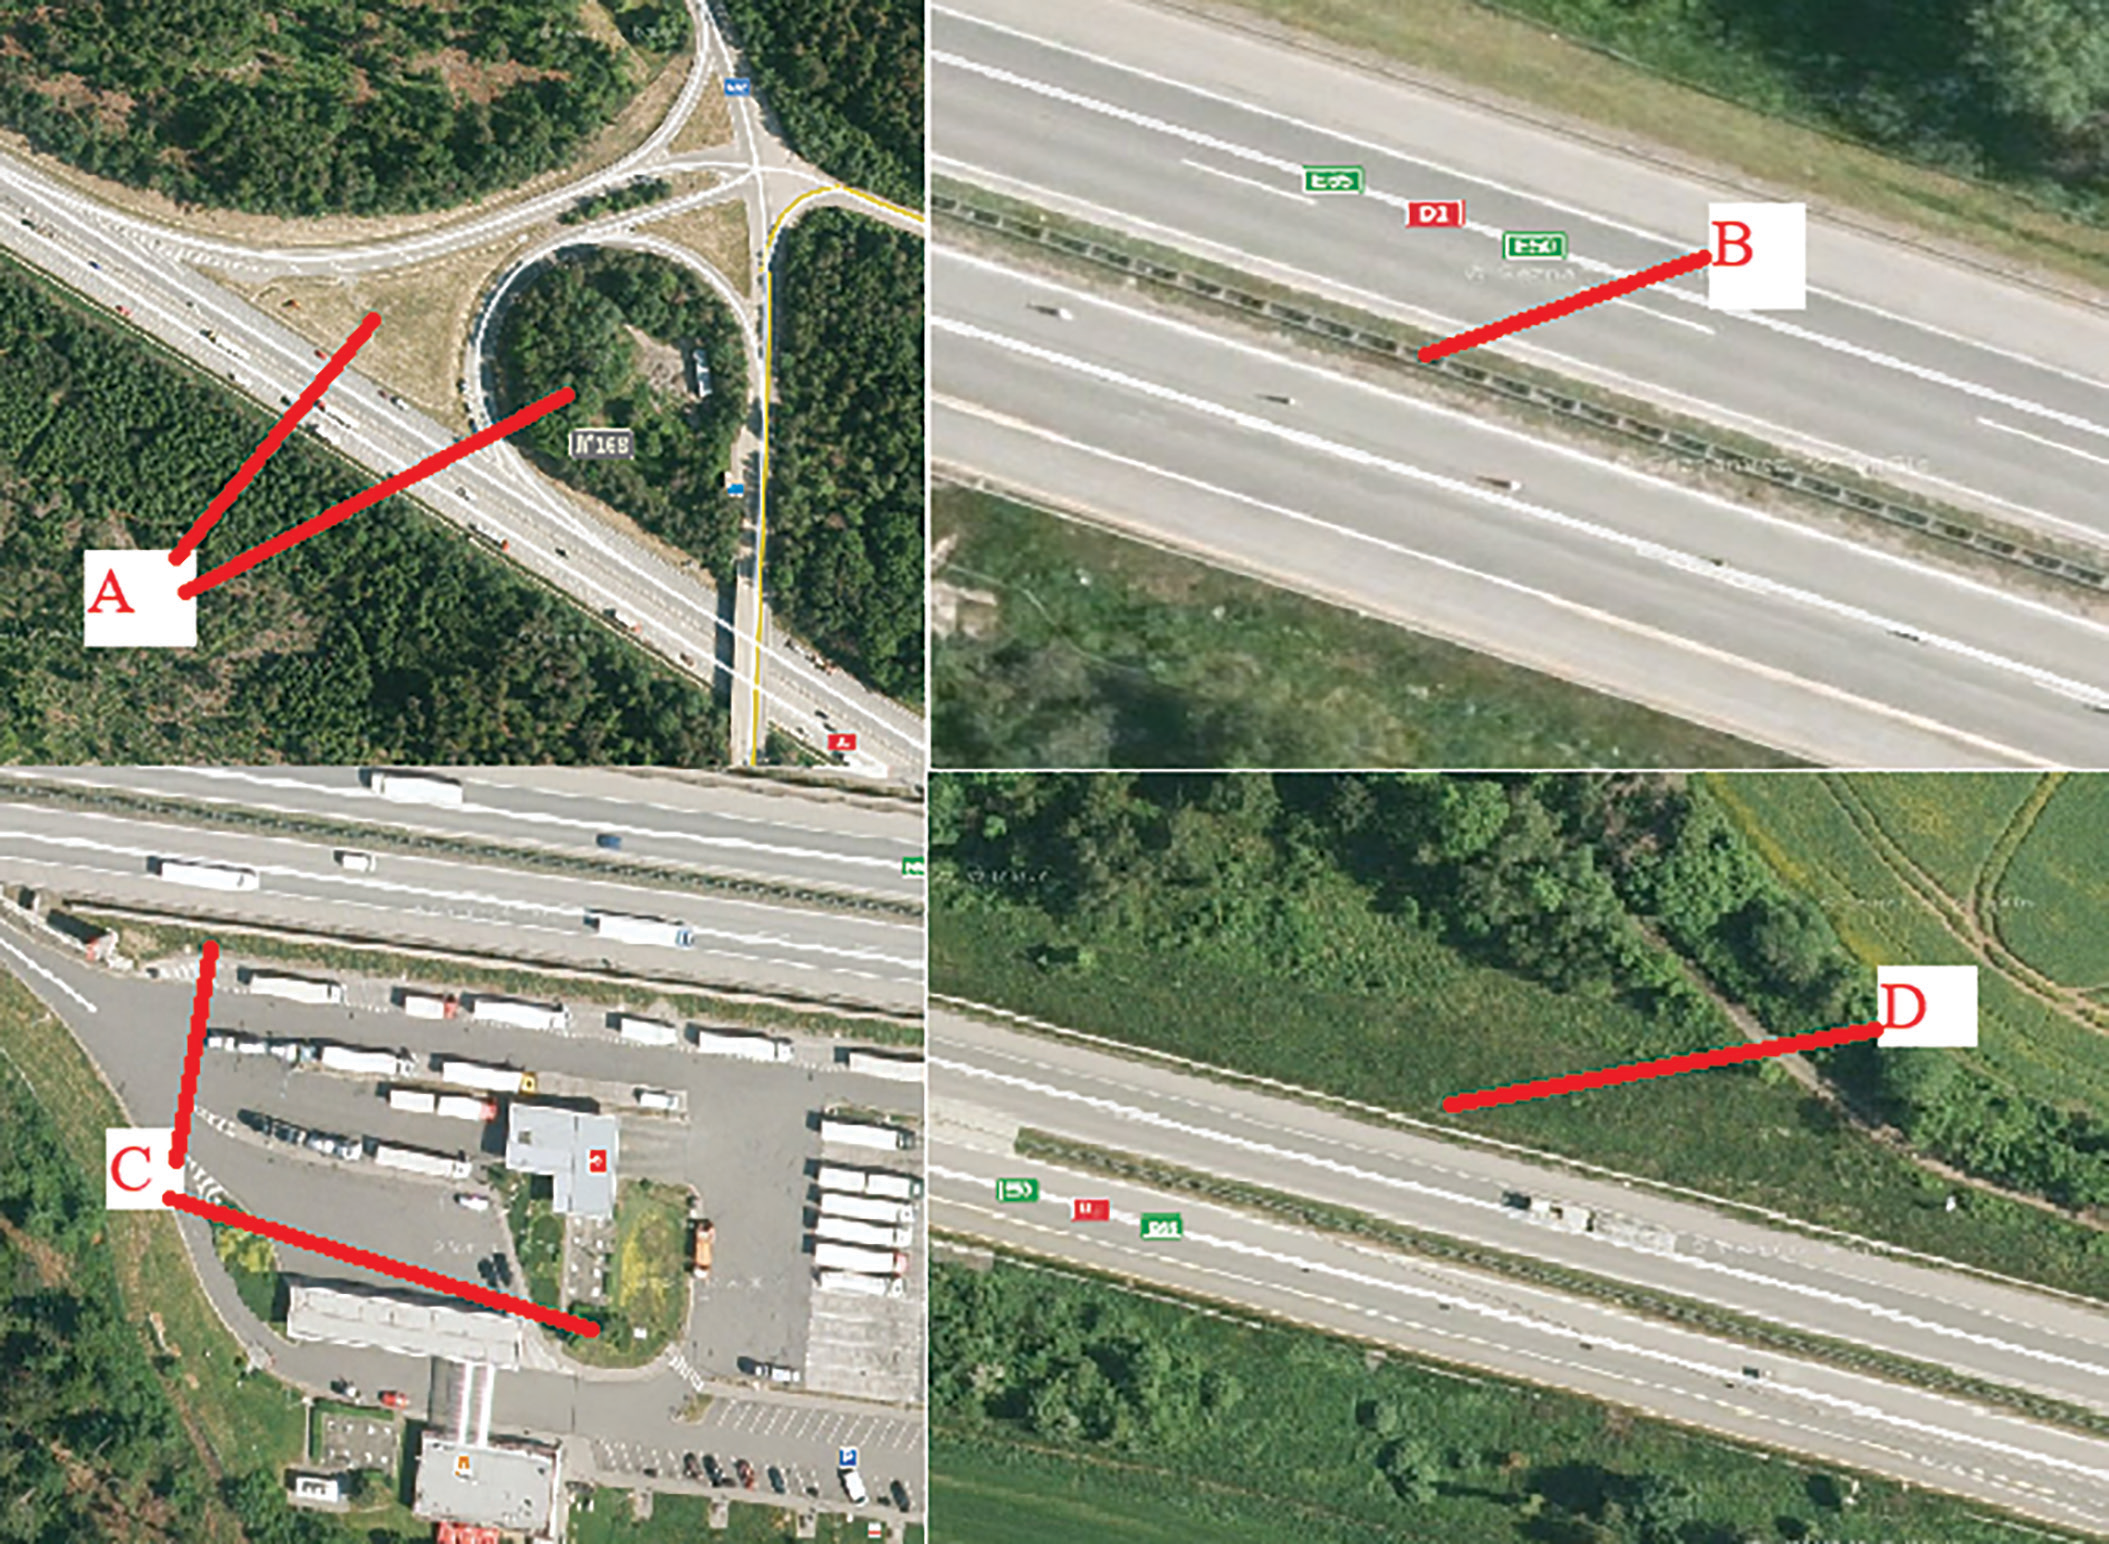
Our study was performed in the Czech Republic. Samples were taken near the D1 motorway. Samples were taken along the freeway from exit 12 to exit 230, a length of 225 km. Samples were taken in various unused areas, such as places between highway intersections, median strips, and similar. Values from the literature were used as comparative values. Samples were collected from a total of four types of sites (Fig. 1.). The average annual temperature in the Czech Republic is 7.3ºC, regional differences range from 0.4ºC. In the Czech Republic, there are significant differences in annual precipitation totals due to the highly fragmented relief. The average total precipitation in the Czech Republic is 686 mm per year. Soils whose properties and functions are controlled and influenced by human activity are classified as Technosols (IUSS Working Group WRB 2015), so no probes were dug to determine the soil type. As a rule, the sampling areas were only grassed and regularly mown without further agricultural use.
Sampling
Soil sampling was performed during 2018-2019, and soil samples were taken using a gouge auger. Sampling was performed at a depth of 0-15 cm. In each site, a squared area of 30 × 30 m was defined, and soil was taken in 5 subsamples at the center and corners of the area. A pooled sample for analysis was created from these samples. For heavy metal analysis, samples were ground with a soil mill.
Samples were taken to the laboratory, air dried, and passed through a 2 mm sieve. Then the following properties were analyzed: soil organic carbon (SOC), determined using a calcination method [7]; texture, determined using a diffraction laser [8]; pH (potassium chloride - KCl), determined using ISO methodology 10390:2005 (ISO 10390:2005). The amounts of Pb and Cu were measured by flameless atomic absorption spectroscopy (detection limits for Pb = 0,5 mg/g and for Cu = 0,1 mg/kg), and Hg was measured by flame atomic absorption spectroscopy (detection limits for Hg = 0,1 mg/kg). A sample treatment for the analysis of risk elements was:
Fig. 1.
Types of sites sampled: A) Green spaces between highway constructions; B) green center stripe; C) Green spaces in parking lots and gas stations; D) Highway slopes.
Weigh 0.12-0.13 g sediment samples, respectively, place in a 30 mL polytetra-fluoroethylene (PTFE) beaker and add a little water for wetting samples. Then add 5 mL hydrochloric acid (HCl), cover the lid, and place in temperature controlled heating board. Heat for about 30 mins, then add 2.5 mL nitric acid (HNO3), and heat to boiling until nitric acid (HNO3) totally breaks down. Add 7 mL hydrofluoric acid (HF) and 0.5 mL perchlorate (ClO4-), cover it, and heat until the solution becomes clear, heat at 140ºC so that the perchlorate completely volatilizes (ClO4-). Cool it and add 1.7 mL hydrochloric acid (HCl), and a small amount of water, heat to dissolve, transfer to a 25 mL colorimetric tube three times, fix the volume and prepare to measure the content of the risk elements. The reagents for analysis and determination were analytically pure, and the water was secondary deionized water.
Data Treatment
Mean differences between the different plots were determined using an independent sample t-test (p≤0.05). Correlation was determined by the calculation of Pearson’s linear correlation coefficient (r). All analyses were performed using STATISTICA version 12 for Windows.
Ecological Indexes
The Contamination Factor (Cfi)
(Cfi) = Cmetal/Cbackground [9].
Defines the ratio of the mean content of metal in soil from all sampling sites to the preindustrial concentration of individual metals [9]. In our work, we applied the concentration of elements in the Earth’s crust as a reference value, similar to Yaroshevsky [10]. The average content of copper, lead, and mercury in the Earth’s crust is, respectively, in mg/kg: 16.00 (Pb), 47.00 (Cu), 0.08 (Hg), and the (Cfi) is the concentration of the given element. The evaluation of the (Cfi) is shown in Table 1 and was carried out according to Holtra and Zamorska-Wojdyla [11].
Potential Ecological Risk Index Efi
Efi = Cfi x Tfi [9].
Where Cfi is the concentration of the given element and Tfi is the response coefficient for the toxicity of the single risk element. The formula reveals the hazards of risk elements on human and aquatic ecosystems and reflects the level of risk element toxicity and ecological sensitivity to heavy metal pollution. The standardized response coefficient for the toxicity of risk elements, which was made by Hakanson [9], was adopted as an evaluation criterion. Respectively, the corresponding coefficients based on its toxicity were Hg = 40 and Cu = Pb = 5 [12]. The evaluation of Efi is shown in Table 2 and was carried out according to Guo et al. [13].
Potential Toxicity Response Index (RI)
RI = ΣEfi [9].
The potential ecological risk index (RI) is a method for assessing risks to the environment from soil. It is a comprehensive assessment of a contaminated site to assess the possible ecological risk of Hakanson [9]. The evaluation of the RI is shown in Table 3 and was carried out according to Guo et al. [13].
Table 1.
Evaluation of contamination factor. (Holtra and Zamorska-Wojdyla, 2020).
| Value | Soil quality |
|---|---|
| Cfi<1 | Low contamination |
| 1<Cfi<3 | Moderate contamination |
| 3<Cfi<6 | Considerable contamination |
| 6<Cfi | Very high contamination |
Results
Descriptive Analysis
A descriptive analysis was performed for all measured quantities. This analysis is shown in Table 4.
The average Pb content is 34.32 mg/kg (±12.19), the minimum is 12.70 mg/kg, and the maximum is 67.90 mg/kg. The average Cu content is 15.48 mg/kg (±6.14), the minimum is 4.50 mg/kg, and the maximum is 38.90 mg/kg. The average Hg content is 0.18 mg/kg (±0.21), the minimum is 0.00 mg/kg, and the maximum is 0.80 mg/kg. The average pH is 5.61 (±0.52), the minimum is 4.20, and the maximum is 6.70. The average content of organic carbon is 12.02 % (±5.89), the minimum is 2.90 %, and the maximum is 32.48 %. The average bulk density is 1.64 g. cm-3 (0.20), the minimum is 1.13 g. cm-3, and the maximum is 1.99 g. cm-3. The amount of skeleton (particles larger than 2 mm) is 13.02 % (±4.46), the minimum is 5.50 %, and the maximum is 27.30 %.
Soil Properties
Samples were taken in a wide range throughout the Czech Republic. The soil characteristics corresponded to this, which varied greatly along the entire length of the transect. The average soil reaction (pH/KCl) is 5.61, so on average, these are weakly acidic soils. However, the soil reaction ranged from strongly acidic (4.20) to neutral (6.70). The organic carbon content was on average high (12.02). This is mainly due to the fact that, in many cases, these were areas where organic matter was not removed and thus enriched the soil. The grain size classification of the soil ranged from clay to silt loam. Of the soil types, they were represented as Cambisol and Technosol.
Pollution Indices
Contamination factor (C_f^i)
Descriptive statistics for the Contamination factor (C_f^i) are given in Table 5. In the case of Pb, the contamination factor is on average 2.14 (±0.76), minimum 0.79, and maximum 4.24. Thus, the average contamination factor for Pb is moderate.
Table 4.
Results.
Table 5.
Description analysis for Contamination factor (Cf i).
Table 6.
Potencial ecological risk (Ef i).
In the case of Cu, the contamination factor is on average 0.33 (±0.13), minimum 0.10, and maximum 0.83. Thus, the average contamination factor for Cu is low.
In the case of Hg, the contamination factor is on average 2.23 (±02.59), minimum 0.00, and maximum 10.00. Thus, the average contamination factor for Hg is moderate.
Potential ecological risk (Efi)
Descriptive statistics for the Potential ecological risk (Efi) are given in Table 6. In the case of Pb, the Potential ecological risk is on average 10.72 (±3.78), minimum 3.97, and maximum 21.22. Thus, the average Potential ecological risk for Pb is low.
In the case of Cu, the Potential ecological risk is on average 1.65 (±0.65), minimum 0.48, and maximum 4.14. Thus, the average Potential ecological risk for Cu is low.
In the case of Hg, the Potential ecological risk is on average 89.04 (±103.78), minimum 0.00, and maximum 400.00. Thus, the average Potential ecological risk for Hg is higher.
Potential toxicity index (RI)
Descriptive statistics for the Potential toxicity index (RI) is given in Table 7. The average Potential toxicity index is 101.41 (±103.87), minimum 8.14, and maximum 410.07. The average Potential toxicity index is low.
Discussion of Results
Lands around roads and highways are considered highly risky [14, 15]. The risk lies mainly in the accumulation of contaminants in the soil and their subsequent spread to the wider environment, for example, through contamination of groundwater [14, 16]. Moreover, highways are often located near sources of multiple pollutant emissions, such as busy roads, rail yards, marine ports, and industries, which can lead to the accumulation of pollutants in the surrounding air [17, 18].
Table 7.
Potential toxicity index (RI).
| RI | |
|---|---|
| Average | 101.41 |
| Median | 63.49 |
| Modal value | not avaliable |
| Standard deviation | 103.87 |
| Variance | 10788.89 |
| Min | 8.14 |
| Max | 410.07 |
| Number | 74.00 |
Heavy metals are commonly found in road dust around the world, including areas with heavy traffic [19, 20]. Road traffic is considered a significant source of heavy metal pollution, with common metals found including Zn, Cu, Pb, Cr, Cd, Ni, and polycyclic aromatic hydrocarbons (PAHs) [21-23].
However, there has been a lot of research in this area that questions this risk. For example, Wang et al. [20] addressed the ecological and health risks that road traffic contaminants can cause in urban parks that are located close to these important traffic arteries. The authors found here that the content of risk elements in the soil (Cu, Pb, and Zn) is highly dependent on the distance from the traffic artery. The longer the distance, the lower the content of the risk element in the soil [13]. As reported by Radziemska and Fronczyk [21], risk elements bind to PM10 particles, most of which sink to the ground within 0.5 m of the source. The largest concentrations of risk elements are thus found within 0.5 m of the edge of the road. A similar opinion is shared by the authors Miazgowicz [22], Badamash [23], and Abderrahmane [24]. Hjortenkrans et al. [25], who add, however, that the highest concentrations of lead were observed up to 0.5 m from the edge of the road and up to 0.1 m soil depth.
Lead is a very dangerous element that is toxic to humans. Automobile transport is the most important anthropogenic source of this element, which is much more important than other anthropogenic sources [19]. Automobile transport releases Pb into its surroundings mainly as a result of fuel combustion [20]. Copper enters the environment from automobile traffic, mainly as a result of the wear of metal parts of vehicles and from diesel and engine oils [26]. Zinc is mainly released during car driving from pneumatic brakes and the engine [3, 27, 28].
Motorways then represent the most used traffic arteries. Very often, however, these highways lead through open countryside, where the land in the immediate vicinity is used for agricultural purposes. Specifically, this land is used for the cultivation of crops intended for human or farm animal nutrition. There is a risk that risky elements will enter the food chain.
However, it has not been proven that automobile transport poses a significant risk for soil contamination or endangering the quality and health of the soil that is used for agricultural purposes. Such a study was carried out, for example, by Tedoldi et al. [14]. The authors found that although some hazardous elements are released into the vicinity of the road, these elements have not reached a concentration in the soil that represents a risk. Moreover, the highest concentration of risk elements was within 1 m of the edge of the road. The same opinion is expressed by Ćwiąkała et al. [29], who state that the most significant concentration of risk elements is 3 to 5 meters from the edge of the road.
Contamination factor (Cf) was used, for example, by the authors Mngongo et al. [30]. Based on this factor, the authors evaluate the degree of contamination of agricultural land and determine whether this land will be healthy enough to provide sustenance for an ever-increasing population. This factor is widely used and serves to compare how much the given soil is contaminated with risk elements compared to pre-industrial times [31]. This indicator thus gives a clear answer as to whether soil contamination has occurred or not. In our case, Pb and Hg were found to be at a moderate level. Thus, the soil is moderately contaminated with these elements, while in the case of Cu, there is a low contamination.
Therefore, the elements Pb and Hg can be considered risky, the contamination factor (Cfi) value of which increased moderately compared to the pre-industrial period [32, 33]. Similar conclusions were reached in a study conducted by Negahban and Mokarram [31], who found that around roads there is an increase in (Cfi) especially for Pb. Cu values were not significantly increased. The authors cite as a reason that Pb was released into the air and into the soil by automobile technology much more than all other elements due to the fuel used (mainly leaded gasoline). O’Shea et al. [34] also agree with this assertion. However, today, leaded gasoline is no longer used, and contamination rates are not increasing.
Another index used to assess the level of contamination is the Potential ecological risk index Efi. This index evaluates the level of danger of a specific element for the soil ecosystem. The higher the values the greater the risk, so the given concentration of the given element represents [9]. In the case of the elements Pb and Cu, this index was low. It means that these elements do not represent a significant problem for the soil ecosystem in the given concentration that was found. However, in the case of Hg, this index was found to correspond to a higher category. This is because Hg poses an environmental risk I in smaller concentrations. Potential ecological risk was also used by the authors of Xu et al. [35] for the assessment of soil contamination in the vicinity of roads. The authors also concluded that Hg has a greater potential to damage the environment than Pb and Cu [36].
The last index used in this work is the Potential toxicity index (RI), which evaluates the total toxicity of all contaminants together [9]. In the case of this judge, this index was found to be low. The cumulative effect of Pb, Hg, and Cu therefore does not represent a significant risk for the environment. Especially considering that Pb contamination has been significantly slowed by the shift away from the use of leaded gasoline. This index is widely used for evaluating accumulated rates of contamination and has a good indicative value of the overall hazard resulting from contamination by given elements [26].
The results that were measured testify to the fact that the contamination of the soil in the immediate vicinity of the busiest road in the Czech Republic is not too great, and the contents of risky particles do not represent a risk for nature or humans. The values measured by us were compared with the average values for the entire European value and with legislative values given for the Czech Republic (Table 4). From the mentioned comparison, it follows that the measured values are below the average of the values of risk elements contained on average in agricultural land in the European Union and far below the amount indicating the risk content according to Czech legislation.
Conclusions
Our study looked at the risk to the health and quality of the soil from car traffic around the busiest road in the Czech Republic – the D1 highway. Our attention was mainly focused on the green areas that are located inside or in the immediate vicinity of this highway. These were mainly unused areas between exits and entrances to the highway, areas near service stations, or rest areas. These areas can represent a potential threat, as they are, for example, also used for agricultural production, or contaminated dust can be released from them.
Three indices were used to assess the level of risk. These are the Contamination factor (Cf), the Potential ecological risk index, and the Potential toxicity index (RI). It was found that contamination with the elements Hg, Cu, and Pb does not pose a significant risk, and the most risky element is Hg. This is because Hg is an element that can significantly damage the environment and contaminate soil, even in very small amounts.
However, it is necessary to continue to monitor the state of soil contamination around highways and to propose such a management of these soils that will lead to the least risks associated with a higher occurrence of contaminants in these soils.

