

Introduction
Many freshwater ecosystems are facing heavy metal (loid) pollution mainly caused by rapid industrialization, urbanization, and agriculture, and currently, agriculture has become the biggest source of water pollution in many countries [1]. The rates of mobilization and transport of heavy metal (loid)s in freshwater ecosystems have significantly increased in the last few decades as a result of an increasing human population and high demand for goods and services [2]. Heavy metal (loid) pollution is not only affecting the quality of water and sediment, but it is also causing a decline in the abundance and richness of species [3]. Heavy metal (loid)s are said to be persistent, toxic, less degradable, and resistant to metabolism [4].
In freshwater ecosystems, the proportion of heavy metal (loid)s present as dissolved ions in the water is low because most of them are deposited in the sediments [5, 6]. It is estimated that about 85% of heavy metal (loid)s in aquatic systems are deposited in the sediments [7, 8], through precipitation and flocculation, and therefore sediments serve as heavy metal (loid) repositories [9, 10]. Heavy metal (loid)s in the sediment may be released into the overlying water column when there are changes in conditions such as redox potential, pH, dissolved oxygen, electrical conductivity, and temperature, causing secondary pollution in the aquatic ecosystem [8, 11] and posing a potential risk to aquatic biota and even humans through the food chain [12- 14]. Heavy metal (loid)s in river sediments are used as important long term monitoring indicators of metal (loid) pollution in aquatic ecosystems [15, 16].
The Mohlapitsi River is an important source of water, as it serves as a source of drinking water for some communities in the river catchment. The increasing human activities such as agriculture, sand mining, and human settlements along the river are causing deterioration of the water quality in certain parts of the river [17]. Assessment of heavy metal (loid) concentrations in river sediments is necessary to better understand the impact of human activities on river ecosystems and to design effective management strategies to improve the ecological status of affected rivers [18]. The aim of this study was to evaluate the heavy metal (loid) concentrations in the water and sediments of the river.
Materials and Methods
Study Area
The Mohlapitse River is an important tributary of the Olifants River. It supplies the latter with water of good quality. The river takes its source in the protected Wolkberg Wilderness area. From its source, the Mohlapitsi River passes through various agricultural fields and human settlements before joining the Olifants River. The communities in the area depend on the river for domestic use, irrigation, and livestock. The Mohlapitsi River basin is within the summer rainfall region of South Africa and receives rain between October and April. The mean annual rainfall in the uplands of the Mohlapitsi catchment exceeds 1000 mm, while the long-term average annual rainfall over the wetland is reported to be 511 mm [19].
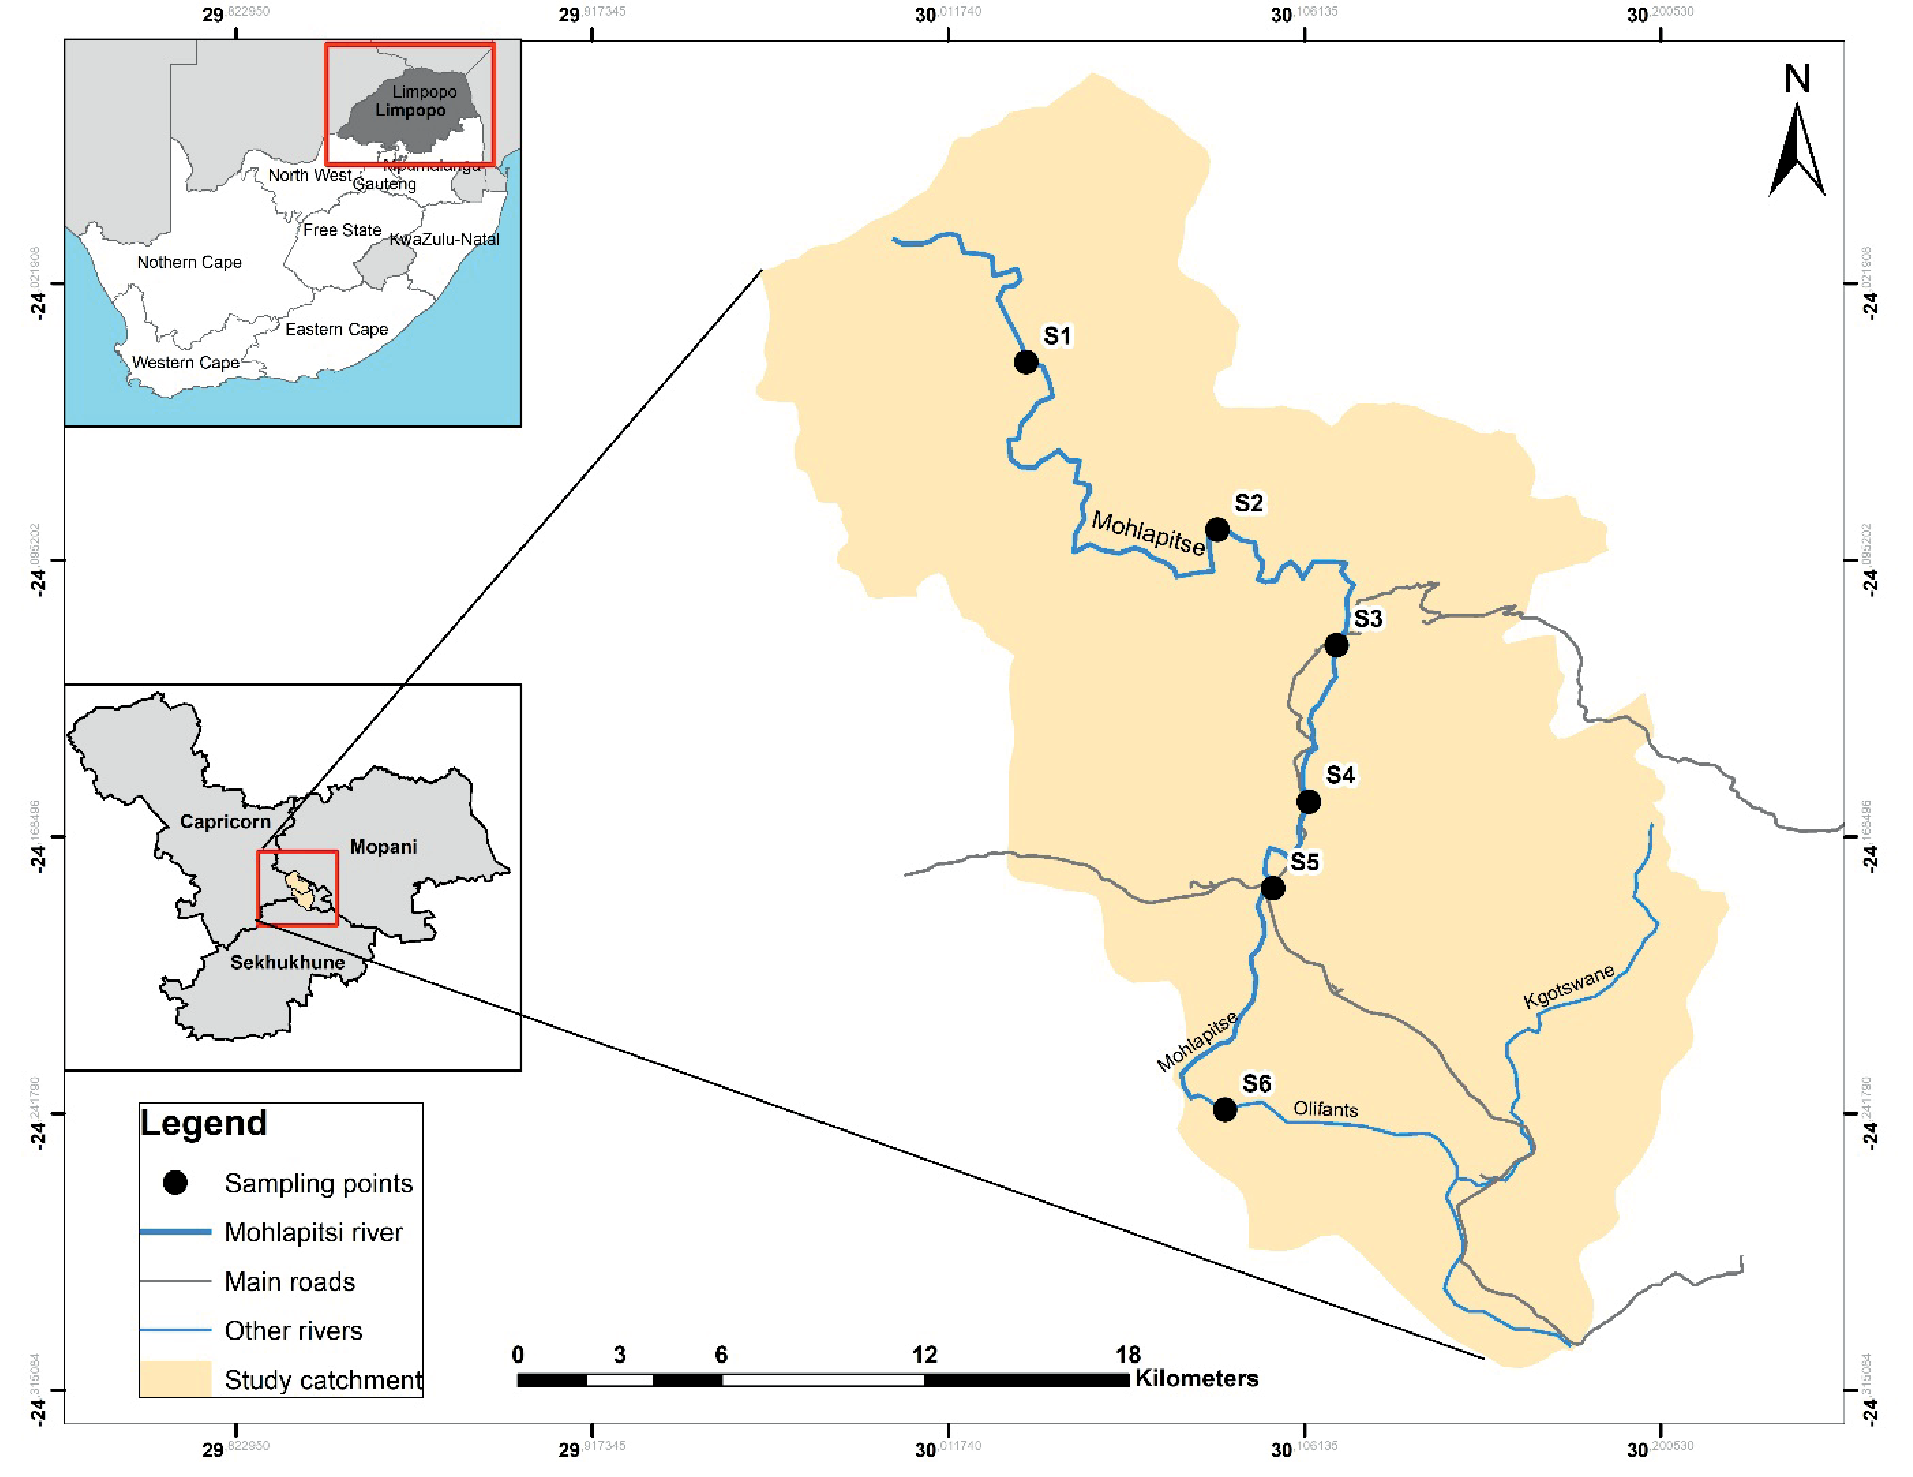
Six sampling sites were selected along the river (Fig. 1); Site S1 (24.1650044S; 30.1043448E) was in the Wolkberg Wilderness area; it is surrounded by vegetation, comprising trees, shrubs, and ferns, with little bank erosion, and it is near a cattle grazing area. Site S2 (24.1738869S; 30.1027902E) was adjacent to a small human settlement, and there are big trees that provide shade to a greater part of the site. Site S3 (24.1806804S; 30.0975124E) was below a weir, with less vegetation around, though there are reeds and shrubs, with a few fig trees adjacent to the river. Site S4 (24.2367189S; 30.0778399E) was adjacent to a settlement (Ga Mafefe village), and the site is used for sand mining and washing clothes. It also serves as a source of drinking water for some communities and their livestock. Site S5 (24.2370664S; 30.0785938E) was near a cattle grazing area and surrounded by trees, especially wild fig trees, which provide shade to a greater part of this section of the river. Site S6 (24.2371333S; 30.0781493E) was at the confluence of the Mohlapitsi River and the Olifants River. The area is mostly surrounded by shrubs and grasses. The sites were selected to cover upstream (S1 and S2), midstream (S3 and S4), and downstream (S5 and S6) (Fig. 1).
Water and Sediment Sampling and Analyses
Water samples were collected in acid pretreated plastic containers during low flow (September and November 2019) and high flow (January and March 2020) at each site and were then transported on ice to the laboratory. The water was stored at 4ºC prior to chemical analysis. A subsample (20 ml) of the collected water was filtered through 0.45 μm pore-spaced filters, and heavy metal (loid) concentrations were determined using an inductively coupled plasma-optical emission spectrophotometer (ICP-OES, Perkin Elmer, Optima 2100 DV). For sediment, five sub-samples were mixed together, forming a composite sample at each site [20]. The samples were placed in acid pretreated plastic containers, transported on ice to the laboratory, and then frozen prior to chemical analysis at an accredited (ISO 17025) laboratory in Pretoria. The sediment samples were stored in acid-washed polypropylene pre-weighed vials and dried at 60ºC for 24 h. The samples were then sieved through a 2-mm nylon sieve to remove any stones and coarse debris. 0.1 g of each sediment sample was digested with 8 ml of 68% nitric acid (HNO3) and 3 ml of 40% hydrochloric acid (HCl). The digested sample was then passed through a membrane filter and the concentrations of the elements were analyzed using inductively coupled plasma optical emission spectrometry (ICP-OES) (Perkin Elmer, Optima 2100 DV). Analytical accuracy was determined using certified standards (De Bruyn Spectroscopic Solutions 500 MUL20-50STD2) and recoveries were within 10% of certified values.
Statistical Analysis
The mean and standard deviations of the heavy metal (loid)s in the water and sediments were determined. Analysis of variance (ANOVA) was done to determine differences in mean metal (loid) concentrations among sites and seasons (high flow and low flow), using Statistica (Version 10). Pollution indices, enrichment factor (EF) and geo-accumulation index (Igeo) were used to determine the anthropogenic contribution to heavy metal (loid) pollution in the sediments of the Mohlapitsi River.
Enrichment Factor (EF)
EF was used to assess the presence and level of pollution in the sediment [21, 22]. EF is calculated as:
where Cx Cx is the metal (loid) concentration [23, 24]. The average shale values of metal (loid)s by Turekian and Wedepohl [25] were used as background values for the metal (loid)s. The concentration of Fe was used as a reference value to account for natural metal (loid) concentrations. Iron (Fe) has been successfully used to normalize metal (loid) contaminants [26, 27]. EF values were used to assess the pollution of bottom sediment samples into the following classes: (EF<2) deficiency to minimal enrichment; (2<EF<5) moderate enrichment; (5<EF<20) significant enrichment; (20< EF<40) very high enrichment; and (EF>40) extremely high enrichment [21].
Geo-Accumulation Index (Igeo)
To evaluate the degree of metal (loid) contamination in the river sediments, the Igeo index was assessed. The Igeo has been globally used for examining metal (loid) contamination in the soil and sediment fractions [28,29]. It considers both natural geological processes and the impact of human activities on metal (loid) pollution [30].
The value of the geo-accumulation index is calculated by the following equation:
Where Cx is the concentration of the examined metal (loid) in the sediment, Bn is the geochemical background value of a given metal (loid) in the shale [25], and the factor 1.5 is used to account for the possible variations in the background values. There are seven classes of geoaccumulation index [30]. The classes range from Class 0 (unpolluted) to Class 6 (extremely polluted); 0 (Igeo≤0) uncontaminated, class 1 (0<Igeo<1) uncontaminated to moderately contaminated, class 2 (1<Igeo<2) moderately contaminated, class 3 (2<Igeo<3) moderately to heavily contaminated, class 4 (3<Igeo<4) highly contaminated, class 5 (4<Igeo<5) heavily to extremely contaminated, class 6 (Igeo≥5) extremely contaminated [21].
Results and Discussion
Heavy Metal (Loid)s in Water
The results of the heavy metal (loid) concentrations detected in the water samples are presented in Table 1. There were no significant differences among the sites for Fe, Mn and Zn (F = 0.86, p>0.05; F = 1.16, p>0.05; and F = 0.13, p>0.05 respectively). The mean concentrations of Fe and Zn were below the recommended guideline values at all sites; however, the mean concentration of Mn was above the recommended guideline value of 5.0 mg/l at S1 and S2 [31, 32]. The other five metal (loid)s (As, Cr, Cu, Ni, and Pb) were below detection levels. Despite the low concentrations in the water, they can still have an adverse effect on aquatic organisms. It has been found that even low concentrations of metal (loid)s in water, along with nutrient enrichment can have detrimental effects on aquatic biota [27].
Seasonally, the mean concentration of Fe during both high flow and low flow was 0.07 mg/l, and the mean concentrations of Zn during high and low flows were 0.09 mg/l and 0.13 mg/l, respectively. Both Fe and Zn mean concentrations were below the guideline values. The mean concentrations of Mn during high flow and low flow were 0.17 mg/l and 0.14 mg/l, respectively, but there was no significant difference between the two seasons (p>0.05). The high and low flow Mn concentrations were higher than the standard level of 0.01 mg/l [31, 32].
Heavy Metal (loid)s in Sediments
The mean concentrations of metal (loid)s in the sediment samples varied among sites and were detected in considerable amounts, including those that were not detected in the water (Table 2). Many studies have reported the concentration of metal (loid)s in the sediments being many times higher than that of the overlying water [8, 33]. This is supported by the fact that most of the heavy metal (loid)s in aquatic systems eventually end up in the bottom sediments. The highest mean concentrations of As, Cu, and Mn (9.4 mg/kg, 30.4 mg/kg and 2727 mg/kg) were at S2, the highest mean concentrations of Cr, Pb, and Zn (446 mg/kg, 13.5 mg/kg and 59 mg/kg) were at S5, the highest mean concentration of Fe (74665 mg/kg) was recorded at S4, while the highest mean concentration of Ni was at S6 (Fig. 2). Thus, the metal (loid)s did not show any general trend in their concentrations among the sites. There were no significant differences in the concentrations of the metal (loid)s among the sites (p>0.05), except for Fe (F = 6.00, p<0.002).
Table 1.
Heavy metal (loid) concentrations (mg/l) in the water measured at different sites of the Mohlapitsi River.
Table 2.
Mean concentrations of the metal (loid)s (in sediments) measured at the sampling sites of the Mohlapitsi River.
Fig. 2.
Box and Whisker plots for the metal concentrations in the sediments at different sites of the Mohlapitsi River.
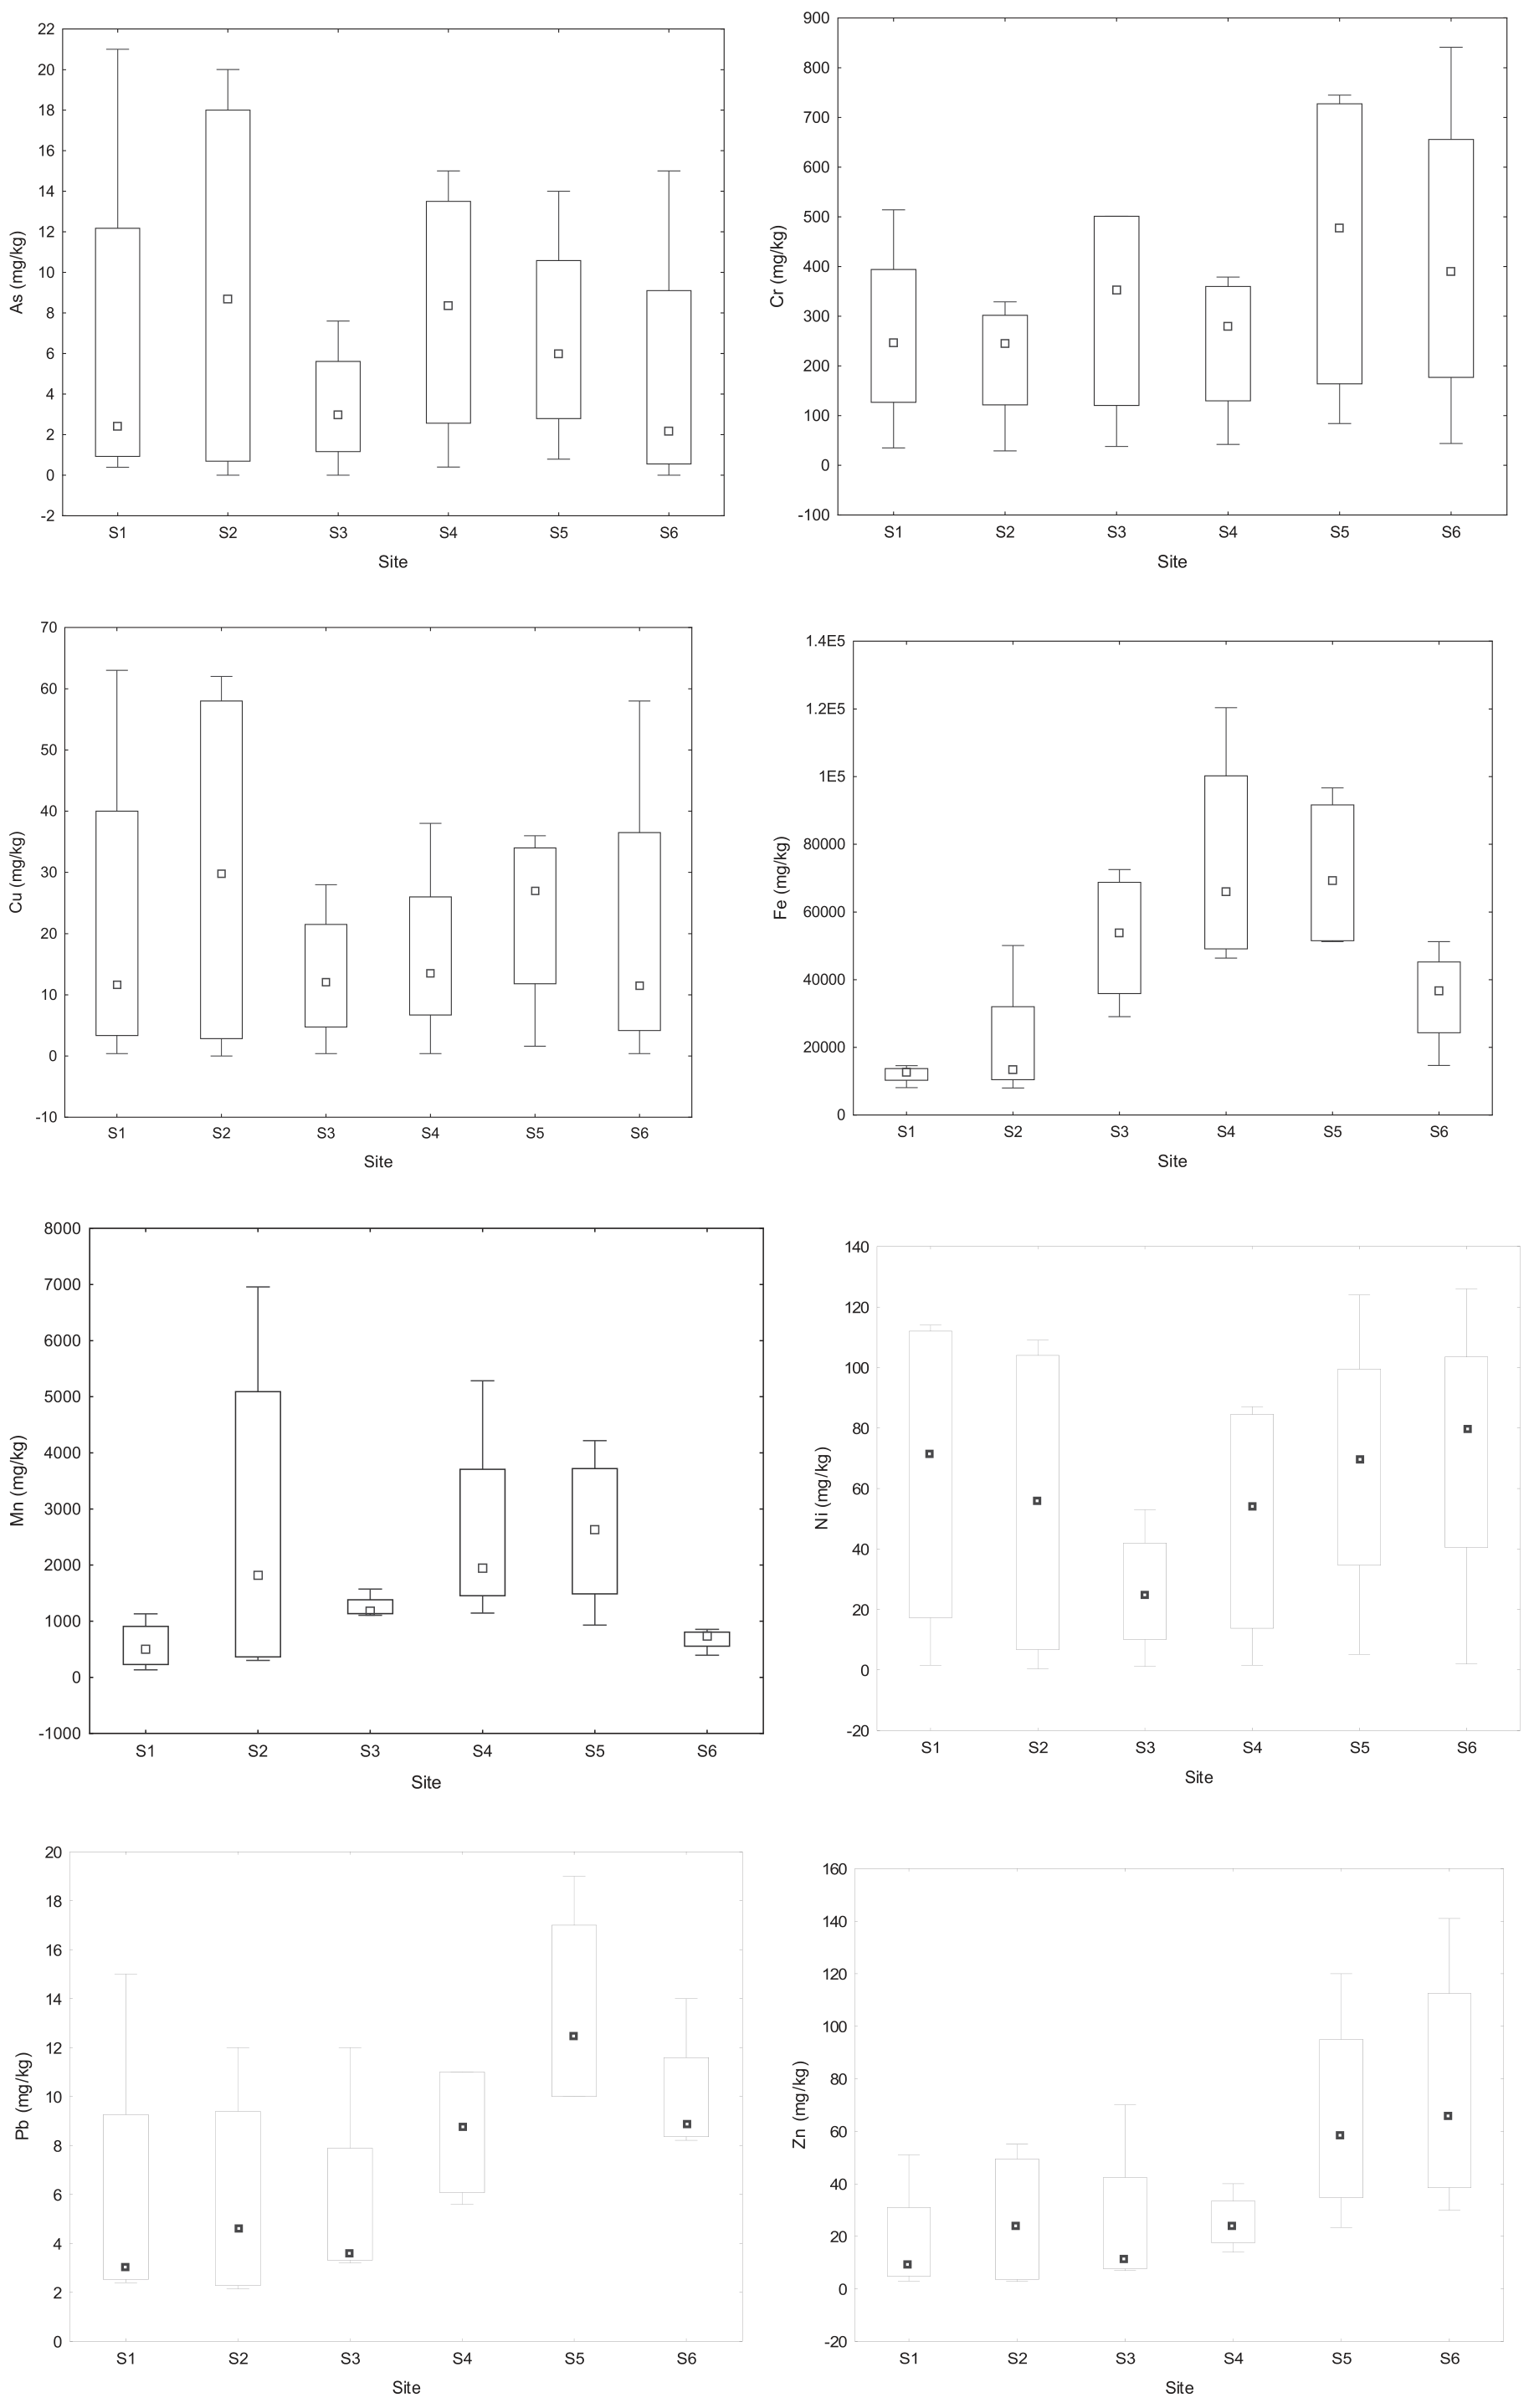
The mean concentration of As exceeded the guideline value of 5.9 mg/kg at sites S1, S2, S4, and S5, but the concentration was below the average shale value at all the sites. The mean concentration of Cr exceeded the guideline value of 37.3 mg kg-1 and the average shale value of 90 mg/kg at all the sites. The mean Fe concentrations exceeded the average shale value of 47200 mg/kg at S4, S2, and S5. The mean concentration of Mn exceeded the average shale value of 850 mg/kg at all the sites, except at S1 and S6. The mean concentration of Pb was below the guideline value of 35 mg kg-1 and the average shale value of 20 mg/kg at all the sites, and the mean concentration of Zn was also below the guideline value of 123 mg kg-1 and the average shale value of 95 mg/kg at all the sites. The highest concentrations of Cr, Ni, Pb, and Zn were in the downstream (S5 and S6), the highest mean concentrations of As, Cu, and Mn were in the upstream (S2), and the highest mean concentration of Fe was at S4, indicating that contamination of some of the metal (loid)s is localized.
Seasonally, the concentrations of As, Cr, Cu, Ni, and Zn were significantly higher during the high flow than the low flow (p<0.05), and the concentrations of Mn and Pb were also higher during the high flow than the low flow, but there were no significant differences between the two seasons (p>0.05). However, the mean Fe concentration was insignificantly higher during low flow than high flow (Table 3). Human activities in the area have led to increasing heavy metal (loid) pollution, and the primary cause of pollution is the leaching of metal (loid)s from different sources such as waste dumps, livestock and chicken manure, and runoff from agricultural fields. High flow is also the hot season, when there is depletion of dissolved oxygen and therefore an anaerobic condition prevails that leads to the release of heavy metal (loid)s from the bottom sediment to the overlying water column [34], which can cause a variation in metal (loid) concentration in water and sediment. Though some studies have reported low concentrations of metal (loid)s during the rainy season due to the dilution effect of water [29, 35].
Correlation of the Metal (loid)s
The pattern of the correlation coefficient shows strong associations between the following metal (loid)s in the sediments: As-Cr, As-Cu, As-Mn, As-Pb, As-Zn, Cr-Cu, Cr-Ni, Cr-Zn, Cu-Mn, Cu-Ni, Cu-Pb, Cu-Zn, Fe-Mn, Fe-Pb, Mn-Pb, Ni-Pb, Ni-Zn, and Pb-Zn (Table 4). Based on the correlation coefficients, Ni showed a strong, significant positive correlation with As, Cr, and Cu (r = 0.725, p<0.05; r = 0.718, p<0.05; r = 0.748, respectively), Cu showed a strong significant positive correlation with As and Cr (r = 0.944, p<0.01; r = 0.656, p<0.05), and Zn showed a strong significant positive correlation with Pb (r = 0.698, p<0.05). The Spearman correlation matrix is useful for determining the sources and pathways of contaminants in river sediments. The strong correlations between the metal (loid)s suggest similar pollution sources. The sources of contamination of the metal (loid)s are likely to come from agricultural activities, especially the use of fertilizers and pesticides, and manure from livestock, which can enter the river through soil runoff [36-38]. For example, studies have reported high concentrations of As, Cr, Ni, Cu, Mn, Pb, and Zn in fertilizers [39], which can reach rivers through runoff [40]. Besides fertilizers, other possible sources of Pb, Mn, and Ni contamination in the river are batteries, pigments and paints, pesticides, and fuel [41].
Enrichment Factor and Geo-Accumulation Index
The enrichment factor (EF) was applied to assess the possible sources of the metal (loid)s. The results of the EF are shown in Fig. 3: EF of As ranged from 0.24 at S3 to 1.98 at S1, Cr ranged from 1.72 at S4 to 11.4 at S1, Cu values were between 0.23 at S4 and 1.90 at S1, Mn ranged from 1.1 at S6 to 7.13 at S2, Ni from 0.35 at S3 to 3.74 at S1, Pb ranged from 0.25 at S4 to 1.16 at S1, and Zn ranged from 0.14 at S4 to 0.78 at S6. The results show moderate enrichment of Cr at S1, S2, and S6, and Mn enrichment at S2. The enrichment factor has been widely used to categorize metal (loid)s associated with sediment pollution caused by human activities. In the Olifants River Basin, an available report showed that the sediments are moderately to severely polluted with Cr and Ni in the Ga-Selati, Spekboom, and Steelpoort rivers [42].
Table 3.
Statistical analysis of metal (loid) concentration during high and low flows in the Mohlapitsi River.
Table 4.
Spearman Rank correlation of the eight metal (loid)s in the Mohlapitsi River sediments.
Geoaccumulation index (Igeo) values based on the average shale are presented in Fig. 4. The Igeo values for As, Cu, Fe, Ni, Pb, and Zn were all below 1 and fell in class ‘0’ at all sites. The Igeo values for Cr and Mn were above 1 at all the sites, except at S3, where the Mn was below zero. Igeo is mainly used for the quantification of metal (loid) accumulation in sediments. In this study, only Cr and Mn showed significant contamination (Igeo>0), while As, Cu, Fe, Ni, Pb, and Zn showed insignificant contamination levels in the sediments (Igeo<0). The high concentration of Cr and Mn in the river is of great concern as it can pose a health risk to humans.
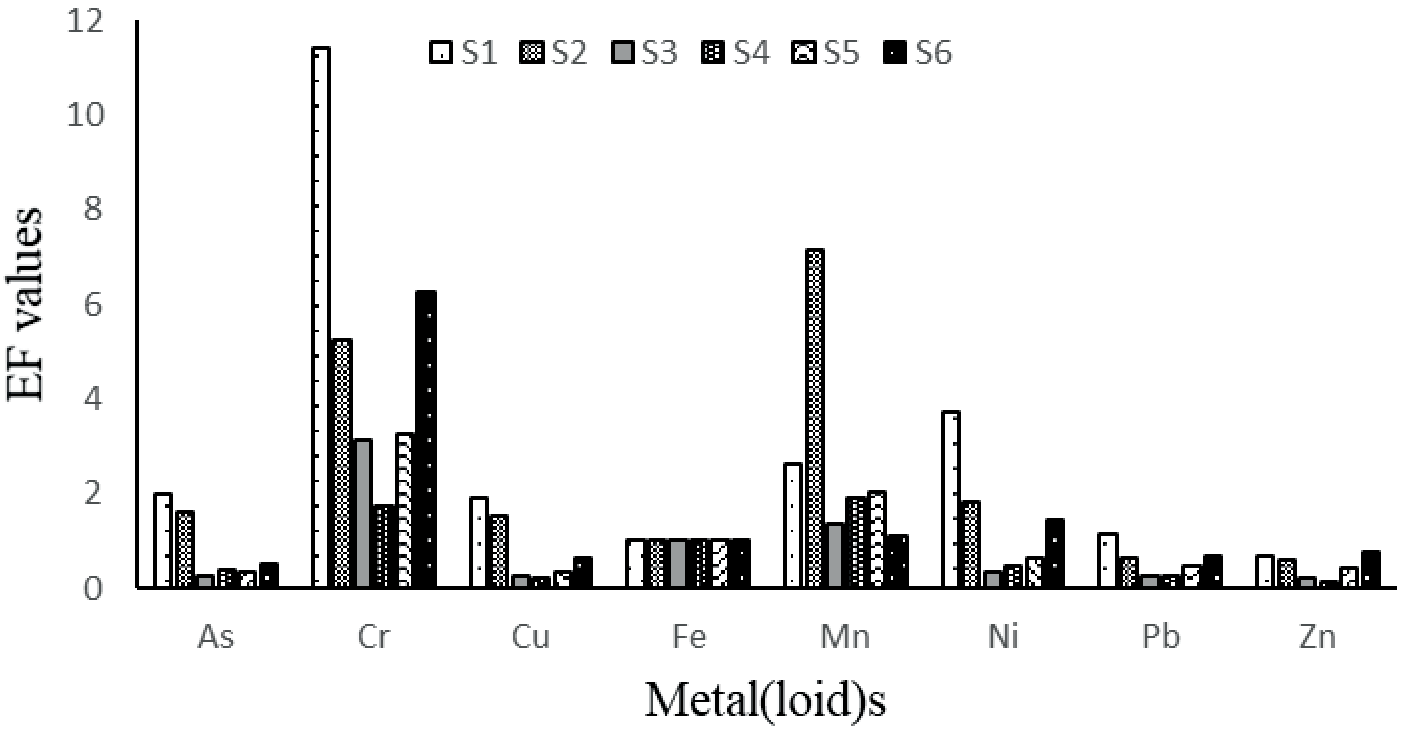
Fig. 4.
The geo-accumulation index (Igeo) of heavy metal (loid)s in the sediments of the Mohlapitsi River.
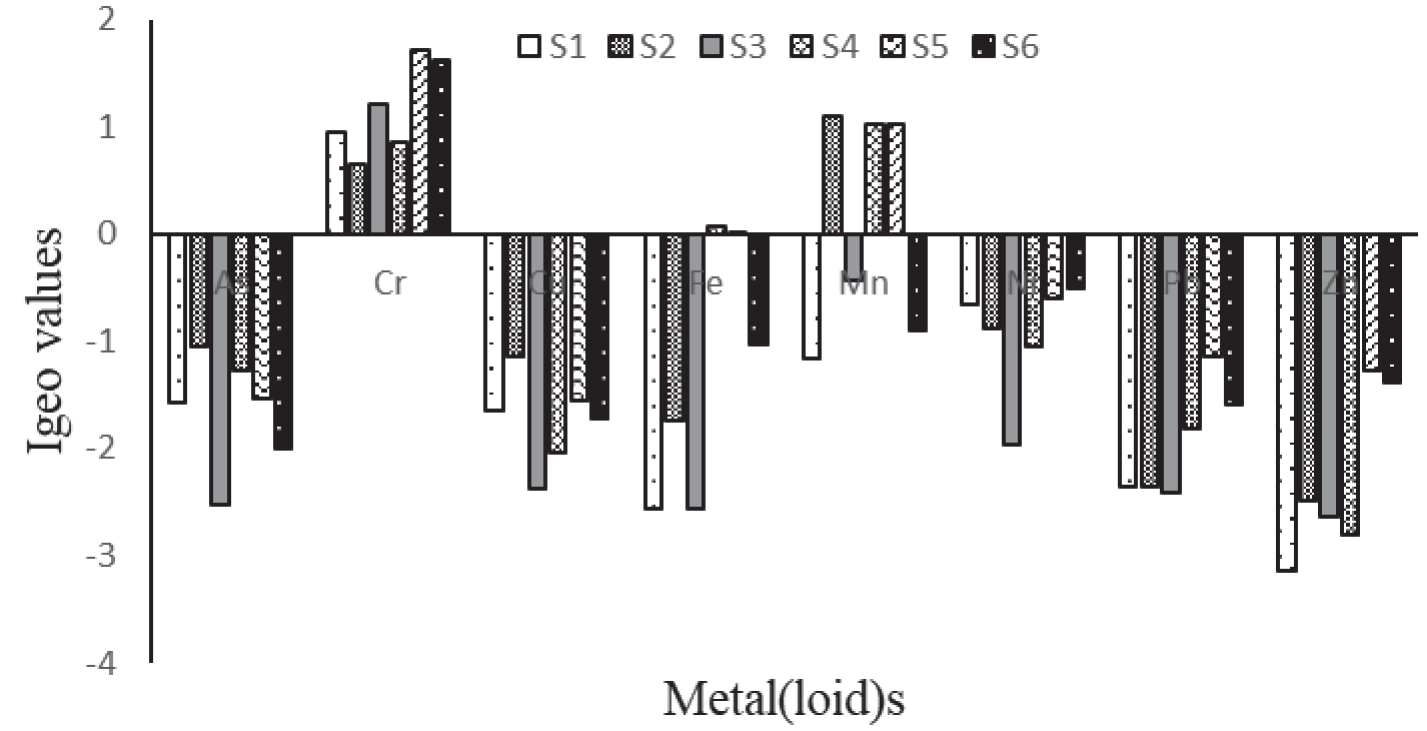
The high metal (loid) concentrations in relation to the background values and the high EF and Igeo values of Cr and Mn reflect the increased human activities along the river, especially from agricultural activities, as fertilizers are known to contain both elements [34]. The high metal (loid) concentrations may have adverse ecological implications for aquatic biota. However, the potential risks that metal (loid) concentrations in the sediments pose do not only depend on total concentrations but also on the bioavailable fractions [43-45].
The low concentrations of heavy metal (loid)s in the water and the high concentrations in the sediments in this study confirm the ecological importance of sediments as reservoirs of contaminants, including metal (loid)s. Metal (loid)s are usually distributed between the aqueous phase and bed sediments, but only a small portion of free metal (loid) ions stay dissolved in water, and the rest are deposited in the sediments [45]. This may become a potential source of secondary pollution in the water phase [46, 47].
Conclusion
The heavy metal (loid) concentrations at the six sampling sites along the Mohlapitsi River, with the exception of Mn, indicate low contamination in the water column. However, in the sediment, the concentrations of the metal (loid)s were considerably high, especially for As, Cr, Mn, and Ni, suggesting that the Mohlapitsi River is contaminated by metal (loid)s. The concentrations of all the studied metal (loid)s, with the exception of Fe, were higher during high flow than low flow. The positive correlations among metal (loid)s indicate that they are probably discharged from the same pollution source, and the main reason may be the impact of agricultural activities in the catchment. Furthermore, the EF and Igeo revealed that the sediments were moderately to highly polluted by As, Cr, Mn, and Ni. This study demonstrates that the Mohlapitsi River requires a proactive approach by decision-makers to implement measures necessary to reduce the metal (loid) concentrations in the sediment and have a regular monitoring program to assess their levels in the water, especially in areas where communities use it as the main source of drinking water.

