


Introduction
Recently, cadmium (Cd) contamination has caught huge attention because of its higher concentration noted in drinking water and its negative impacts on the health of people [1-3]. The Cd toxicity in plants, animals, and man has been reported by many scientists around the world [4-6]. It is ubiquitous in the ecosystem and exists in the atmosphere, living organisms, water, and soil [7, 8]. Cadmium exists in natural deposits as ores comprising elements. The extensive use of Cd is mostly for metal coatings and plating operations, such as baking enamels, transportation equipment, machinery enamels, television phosphors, and photography, and used in solar batteries and pigments [2, 9, 10]. Cadmium accumulation in soils can occur, where Cd mobility is inhibited, e.g., Cd can precipitate under anoxic conditions, Cd sorption is accompanied by enrichment of organic matter or clay. Anthropogenic sources of Cd in soils are direct inputs of waste material from mining and industry as well as agricultural applications e.g. sewage sludge and phosphate fertilizers [3]. Transport of Cd from the soil into groundwater depends on hydrogeochemical factors regulating Cd mobility. Besides direct input of wastewater, e.g., runoff and leakage, or atmospheric deposition, Cd leaching from waste material, landfills, and fertilization only can happen where Cd release is promoted by replacement, formation of soluble complexes, acidification, or oxidation [9]. Mining wastes usually go together with oxidation reactions and subsequently strongly decrease soil pH. Excessive N fertilization also decreases soil pH, which is associated with increased ionic strength and enhanced Cd mobility [4].
Dissolution and desorption of Cd-rich minerals are among the main causes of Cd contamination of groundwater [11]. Anthropogenic sources such as sewage waste, agricultural practices, smelting, and mining activities release a considerable amount of Cd into the water [12]. Cd in drinking water is generally from the corrosion of mineral deposits [1, 5], but can also be a consequence of metal refinery discharge and runoff from paints and waste batteries [13].
Drinking water is the major route of the Cd to the human body [14]. The Cd contamination in drinking water has been observed in many countries, especially in countries located in South Asia [2]. Cd-polluted groundwater is utilized for drinking by thousands of humans globally, especially in India, Pakistan, Iran, China, Taiwan, Vietnam, and Bangladesh [15]. Groundwater pollution via Cd has been found in Canada, Spain, Japan, Hungary, Mexico, and Argentina [1]. Cd contamination results in anemia, bronchitis, and kidney disorders in humans. For teenagers, Cd absorption reduces bone strength, and birth weight, and increases the loss of bones. For pregnant women, Cd has been noticed in breast milk, and exposure level to the child depends on the exposure level of the mother. Cd may negatively impact the nervous system and cause behavioral and learning issues [16-18].
Recently, health risk assessment due to heavy metals contamination has caught significant attention worldwide [19-21]. It is presented that almost 60% of surface and groundwater in Pakistan has been polluted via biological, inorganic, and organic pollutants [22]. Recent studies have reported heavy metal contamination of the groundwater in south Punjab due to the presence of landfills and dumping of solid wastes [1, 12]. Despite these findings, there is a need for a comprehensive evaluation of groundwater quality regarding any contamination of heavy metals based on the source, depth, and location. Based on this hypothesis, the present study was conducted to comprehensively evaluate the Cd contamination groundwater samples, collected from different depths, and sources located in rural and urban areas of four tehsils of District Khanewal. The collected data on the health hazard of Cd from drinking Cd-contaminated water would certify the basic security of the water for continuously increasing inhabitants.
Experimental
Study Area
Khanewal district is located in Punjab Province, Pakistan. It is located between 29°51′ to 30°43′ N latitudes and 71°30′ to 72°28′ E with an altitude of 453 feet (138 m). Khanewal district has a population of 2,921,986. The weather of Khanewal is an extremely hot season of summer (April to August, where maximum air temperature exceeds 50ºC) and very cold winter (November to January, where minimum air temperature drops to -1ºC. The rivers (Chenab and Ravi) and canals passing through the region are possible sources of aquifer recharge.
Collection of Groundwater Samples
The research area of district Khanewal was divided into four portions based on four tehsils i.e., Khanewal, Kabirwala, Mian Channu, and Jahanian. Groundwater samples (N = 196) were collected from rural (140) areas and urban (56) regions. Their distribution in four tehsils i.e., Khanewal, Kabirwala, Mian Channu, and Jahanian is presented in Table 1. Twenty-nine water samples were collected from tube wells (a form of water well in which a long, 100 mm to 200 mm wide, stainless steel tube is bored underground). The lower end is fitted with a strainer, and a pump lifts water for irrigation. Eighty-five samples were collected from an electric pump, and eighty-two samples were collected from a hand pump at different depths i.e. 50-400 ft. Their distribution of different sources in four tehsils i.e., Khanewal, Kabirwala, Mian Channu, and Jahanian is presented in Table 2. All pumps and wells were flushed for 10 minutes to gather samples of groundwater, which were recognized as purging. Water samples (each 1 liter) were collected in duplicate in the two different bottles having sealed corks. Each sample was acidified on the spot by putting 3 drops of HNO3 to stabilize Cd and metal ions and decrease precipitation. The acidified samples were employed to examine the Cd content. The other sample was preserved unacidified to examine different anions and cations.
Analysis of Groundwater
Samples were analyzed for total dissolved solids, electrical conductivity, sodium, magnesium, sodium, calcium, potassium, bicarbonates, carbonates, sulfate, chloride, and Cd following standard techniques. Then calcium, potassium, and sodium in the drinking water samples were determined by flame emission spectrometry [16]. Contents of Cd in the samples were determined through a protocol suggested by Garcia-Ruiz et al. [17]. A 25 mL water sample was used for the determination of Cd. The level of Cd was measured by atomic absorption spectrometer (HG-AAS, Agilent AA240). A standard reference (un-contaminated sample) was utilized for quality assurance. Furthermore, Cd values were replicated twice for each sample through an atomic absorption spectrometer.
Health Risk Assessment
The human health risk assessment model by USEPA was employed to calculate the adverse impacts of Cd presence in drinking water on human health in four research sites [7]. Risk assessment was calculated to evaluate the probability of individuals being shown to have Cd toxicity from the drinking water. For this determination, the average daily dose (ADD) of Cd owing to the consumption of Cd-polluted drinking water was estimated by adopting a formula [23].
Where C signifies the level of Cd in the water (mg L-1), IR signifies the water intake rate (L day-1), ED represents the exposure period (supposed 74 yr. to create a contrast with published literature from different countries and Pakistan), EF shows exposure rate (365 days year-1), BW signifies the weight of the body (72 kg) [23], and AT indicates the average lifetime (24,630 days).
Carcinogenic and Chronic Risk Assessment
Carcinogenic and chronic risk intensities were also evaluated in individuals. The hazard quotient (HQ) was calculated from the ADD via the adopting formula [24].
Where Rfd signifies oral reference dose (0.0003 mg kg-1 day-1) for Cd determined via using the formal equation [24]. Cancer risk (CR) was estimated by applying the following formula,
Where, CSF is the cancer slope factor for Cd, which is 1.5 mg kg-1 day-1, rendering to the USEPA model [24].
Results
Physicochemical Analysis of Groundwater Samples of District Khanewal
The mean values of the physicochemical attributes of the groundwater samples collected from different study areas of the district Khanewal are shown in Table 3. The pH values were in the alkaline range. The mean value of pH in district Khanewal was 7.81 with maximum and minimum units of 8.66 and 7.11, respectively. The mean values of TDS of water samples in district Khanewal were 874.1 mg L-1 with the highest and lowest concentrations of 1432.0 and 154.0 mg L-1, respectively. The mean value of electrical conductivity (EC) in the Khanewal district was 0.990 dS m-1. The maximum value of electrical conductivity observed was 2.433 dS m-1 and the minimum unit was 0.110 dS m-1. The mean level of hardness of groundwater samples was 58.1 mg L-1. The maximum and minimum concentrations were 89.0 and 21.0 mg L-1, correspondingly.
Findings exhibited that maximum concentrations of cations in district Khanewal were 168.0, 77.0, 680.0, and 1420.0 mg L-1, correspondingly for Ca, K, Na, and Mg. Mean ranges of all cations were noted as 70.2, 26.8, 207.2, and 324.6 mg L-1 for Ca, K, Na, and Mg, correspondingly. The maximum level of carbonate in water samples was 186.0 mg L-1 with a mean value of 91.2 mg L-1 and the maximum amount of bicarbonate was observed at 544.0 mg L-1 with a mean value of 228.0 mg L-1 in water samples in Khanewal district. The chloride maximum concentration in water samples was 69.0 mg L-1 with a mean concentration of 28.1 mg L-1. The mean value of sulfate concentration of district Khanewal was 398.6 with the highest concentration of 1133.0 mg L-1.
Cd Concentration in the Groundwater Samples of District Khanewal
The Cd concentration in groundwater samples of the Khanewal district and four tehsils (Khanewal, Kabirwala, Mian Channu, and Jahanian) is shown in Table 4. In district Khanewal, the mean Cd concentration in water samples was 5.04 × 10⁻² mg L-1 with a Cd level value of 0.60 × 10⁻³ - 1.00 × 10⁻¹ mg L-1. Mean values of Cd level were 3.51 × 10⁻², 2.74 × 10⁻², 4.50 × 10⁻², and 4.69 × 10⁻² mg L-1, respectively, for four tehsils, Khanewal, Kabirwala, Mian Channu, and Jahanian. Maximum Cd concentration (1.00 × 10⁻¹ mg L-1) was noticed in rural regions of the Jahanian groundwater. Contrarily, minimum Cd level (0.60 × 10⁻³ mg L-1) was found in urban regions of tehsil Khanewal.
Cd Level in the Groundwater Samples of Rural and Urban Regions
The level of Cd in groundwater samples of rural and urban regions of four tehsils (Table 4). It was noticed that the Cd level was a little greater in samples taken from rural areas than in urban regions, conversely, the result was non-significant for four tehsils. In rural regions, the Cd level was higher in water samples of Jahanian than in Khanewal, Kabirwala, and Mian Channu. Mean concentrations were noticed at 3.99 × 10⁻², 2.98 × 10⁻², 4.50 × 10⁻², and 5.05 × 10⁻² mg L-1, correspondingly, for rural zones of Khanewal, Kabirwala, Mian Channu, and Jahanian. The maximum level of Cd was observed at 1.00 × 10⁻¹ mg L-1 in water samples of Jahanian carried from rural areas.
In the urban areas, the Cd level in water samples was in descending order of Jahanian>Mian Channu >Khanewal>Kabirwala. The maximum level of Cd in urban areas of Jahanian water was 9.13 × 10⁻² mg L-1 with a mean value of 4.69 × 10⁻² mg L-1. Likewise, in urban zones of four tehsils mean values of Cd were 4.69 × 10⁻², 3.03 × 10⁻², 2.50 × 10⁻², and 4.16 × 10⁻² mg L-1, respectively for Jahanian, Khanewal, Kabirwala, and Mian Channu.
Cd Concentration in the Groundwater Carried from Various Sources
Samples collected from tube wells and electric pumps exhibited nearly the same mean Cd concentration of 4.52 × 10⁻² and 4.56 × 10⁻² mg L-1, respectively (Fig. 1). Conversely, water collected from hand pumps displayed a considerably lower mean Cd concentration of 2.31 × 10⁻² mg L-1 than electric pump and tube wells water.
Table 3.
Physicochemical parameters of groundwater samples taken from rural and urban regions of Khanewal district.
Table 4.
Cadmium concentration (mg L-1) in groundwater samples taken from rural and urban regions of the Khanewal district.
Cd Concentration in Groundwater Carried at Various Depths
With increasing depths 0-100 and 200-300, the mean value of Cd in water samples also enhanced from 2.73 × 10⁻² to 4.69 × 10⁻² mg L-1, however for depths 300-400 feet, Cd level decreased to 3.57 × 10⁻² mg L-1 (Fig. 2).
Exposure Evaluation and Cancer Assessment
In the present study, the average daily dose varied from 0.01 × 10⁻³ to 3.05 × 10⁻³ mg kg-1 day-1 with a mean value of 1.53 × 10⁻³ mg kg-1 day-1 (Table 5). The mean Average daily dose was greater in rural zones (1.53 × 10⁻³ mg kg-1 day-1) of the district Khanewal than in urban regions (1.21 × 10⁻³ mg kg-1 day-1). At the tehsils base, the average daily dose range of Cd was greater for Jahanian (1.42 × 10⁻³ mg kg-1 day-1) than Mian Channu (1.37 × 10⁻³ mg kg-1 day-1), Kabirwala (0.83 × 10⁻³ mg kg-1 day-1) and Khanewal (1.06 × 10⁻³ mg kg-1 day-1). Likewise district Khanewal, the mean average daily dose range was greater for rural areas than the urban areas in four tehsils.
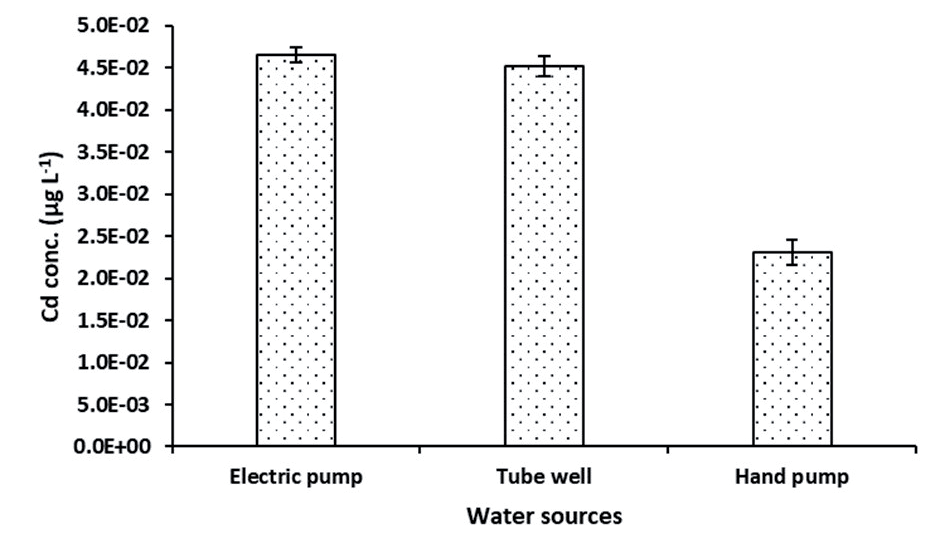
Fig. 2.
Cadmium level in groundwater samples taken from various depths (feet) in the district of Khanewal.
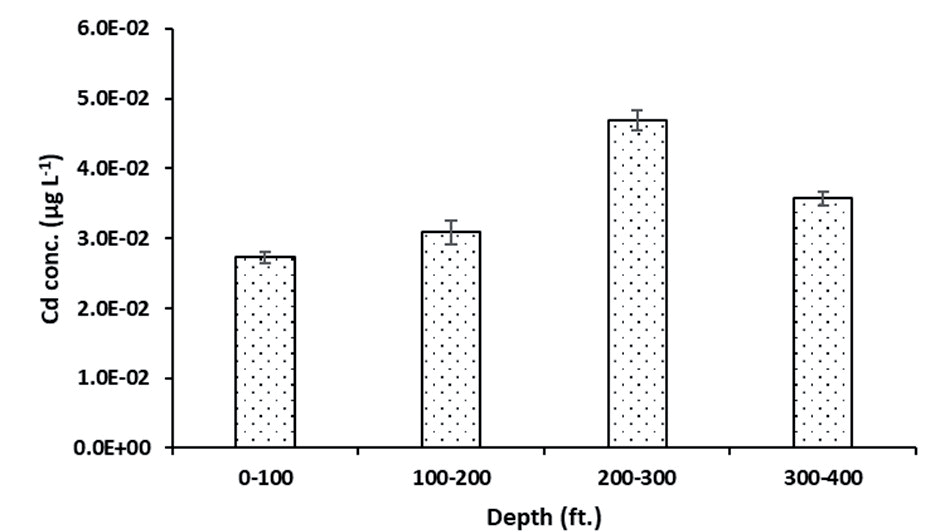
Table 5.
Average daily dose (ADD), hazard quotient (HQ), and carcinogenic risk (CR) of cadmium in Khanewal district.
The mean range of hazard quotient (HQ) was 75.67 for Khanewal district with a maximum and minimum range of 150.80 and 40.49, respectively. The value of HQ was noticed higher in rural zones of all tehsils and district levels than in urban areas. Four tehsils exhibited the mean value of HQ in decreasing order of Jahanian (71.71)>Mian Channu (1.37)>Khanewal (1.06) >Kabirwala (0.83). The potential carcinogenic risk (CR) ranges of district Khanewal noted 0.0001 to 0.0055 in the examined region. Likewise, HQ, ADD, and CR ranges were greater in rural regions of all tehsils and district levels than in urban areas. Additionally, the groundwater of the Jahanian tehsil displayed a high carcinogenic risk (CR) compared to the water of the Khanewal, Kabirwala, and Mian Channu tehsils.
Discussion
Physico-Chemical Analysis of the Groundwater of Khanewal District
Water and food safety has gained substantial attention in the last decade due to various adverse impacts of unclean food and water on people’s health. Drinking water that comprises higher values (exceeding threshold levels) of ions can induce health risks. The standard of the groundwater utilized for the ingestion intent is a vital factor in ascertaining its impacts on people’s health. The guidelines and criteria for drinking water recommended by WHO have been followed globally [1, 25].
In the present study, the quality of drinking water was compared with acceptable limits of various parameters (pH, electrical conductivity, TDS, hardness of water, Cl, CO3, Ca, Na, and Cd) set by WHO [1]. The scale of pH appropriate for drinking intent is considered to be around 5 to 9, whereas 6.5 to 8.5 is preferred [15]. In this research, the pH values of all collected samples from rural and urban zones of district Khanewal were within acceptable limits (6.5 to 8.5) as suggested by WHO [1]. Conversely, the data from this study demonstrated that the groundwater of district Khanewal was slightly alkaline (7.81). The water samples of the district Khanewal displayed high electrical conductivity (EC) (2.433 dS m-1) which was 70% above the WHO acceptable limits (2.0 dS m-1). Iqbal et al. [26] and Shahid et al. [23] also noticed greater electrical conductivity of 2.30 dS m-1 in Kohat Pakistan, and 6.30 dS m-1 in Vehari City, Pakistan, respectively.
The TDS values of all the samples in rural and urban regions of Khanewal district are above the allowable limit by PSQCA 100 to 500 mg L-1. TDS maximum level in the groundwater of Khanewal district was six to ten-fold greater compared to the maximum permissible limits. The high amount of soluble salts in the groundwater of district Khanewal can be because of the dissolution of several minerals e.g. dolomite, calcite, aragonite, and siderite from indigenous soil and bedrocks [27, 28]. Earlier, Naeem et al. [29] found that around 10-25% of groundwater in the research area exceeded the allowable limits for the TDS.
The groundwater samples tested in the present study contained 20, 270, 10, and 40% higher K, Mg, Ca, and Na concentrations, compared to the permissible limits of the Pak-EPA or Pak NEQs. Cations levels were noticed greater in the rural regions of district Khanewal compared to urban regions. The results of this research are similar to Chaudhary and Anuradha [30] who noticed Mg 31-98, K 30-160, and Na 33-350 mg L-1 in an industrial area of the Haryana province, India. A higher concentration of Cl- was recorded in all the samples, which might be due to the invasion of municipal waste and the disposal through anthropogenic activities [31]. The maximum concentration of Cl- 62 mg L-1 was observed in the Khanewal district, which is significantly high in all the samples compared to the WHO allowable limit (31 mg L-1). Similar findings were noticed in Kohat, Pakistan with a Cl- level of 760 mg L-1 [31].
Cd Concentration of Groundwater in Khanewal District
Cd is a naturally occurring metal, dispersed into the environment, and contributes to groundwater contamination [1, 14]. Few studies indicated an enormously higher Cd level in various zones of Punjab, Pakistan [1]. In this investigation, higher concentrations of Cd (mean 5.04 × 10⁻² mg L-1, median 3.99 × 10⁻² mg L-1, highest 1.00 × 10⁻¹ mg L-1, and minimum 0.6 × 10⁻³ mg L-1) have been noticed in 196 collected samples from 4 tehsils (Kabirwala, Khanewal, Jahanian, and Mian Channu) of Khanewal district (Table 4). The Cd level in 93% (184 out of 196) of samples taken from the Khanewal district was more than the WHO allowable limit i.e. 3.00 × 10⁻³ mg L-1 (Table 4). Three samples from each of the Khanewal, Kabirwala, Mian Channu, and Jahanian tehsils contained Cd levels<3.00 × 10⁻³ mg L-1. Likewise, one sample from Jahanian contained a Cd level>1.00 × 10⁻¹ mg L-1 Jahanian tehsil indicated a higher mean Cd level (4.69 × 10⁻² mg L-1) compared to Kabirwala (2.74 × 10⁻² mg L-1), Mian Channu (4.50 × 10⁻² mg L-1), and Khanewal (3.51 × 10⁻² mg L-1). Contrary Cd concentrations in collected groundwater samples show that there is a probable threat of Cd-caused toxicity from the groundwater, which is utilized for drinking purposes in district Khanewal. Consumption of water containing high or moderate concentrations of Cd can induce accumulation of Cd in the human body leading to serious toxicity.
Groundwater contaminated with Cd has been found in 105 countries with an estimation of an exposed population of >0.2 billion globally at a level >3.00 × 10⁻³ mg L-1 [1, 15]. People living in Khanewal and some cities in Pakistan have been exposed to severe Cd contamination because of the utilization of Cd-polluted groundwater for crop irrigation, drinking, and cooking purposes [1]. It is observed that the groundwater of 12/12 samples in district Khanewal contains Cd levels higher than the permissible limit recommended by WHO (3.00 × 10⁻³ mg L-1). Higher Cd concentration (0.01396 mg L-1) was recorded in groundwater samples collected from Uttar Pradesh India that exceeded the WHO safe limits [1]. The higher concentration of Cd might be due to the discharge of different industrial effluents into the Kosi River and the burning of electronic and electrical waste [32]. Burke et al. [33] reported Cd levels above 0.03 mg L-1 in the drinking water of Baluchistan, Pakistan.
It is stated that almost 12 million people in Baluchistan and approximately 30 million habitants in the subcontinent depend on groundwater comprising Cd levels various folds greater compared to the WHO recommended values [1]. The groundwater pollution through Cd and other trace metals in Pakistan remained overlooked until a joint project directed in 2000 through the Pakistan Council of Research and the United Nations Children Fund in Water Resources. Findings achieved from this project described that Cd pollution of groundwater surpassed the WHO-suggested standards in various cities in Pakistan [33]. The status of groundwater pollution through Cd is very serious in Multan and Khanewal, where >60% of wells surpass the allowable limit of 3.0 × 10⁻³ mg L-1 groundwater [1, 12]. In Pakistan, it is suggested that groundwater pollution of Cd is the consequence of oxidation of Cd-containing minerals, atmospheric deposition of combustion emissions, mining, weathering, and anthropogenic activities. Khan et al. [34] reported that the maximum Cd level was 3.1 × 10⁻² mg L-1 in Nowshera (Khyber Pakhtunkhwa) of Pakistan. The highest concentration of Cd in Nowshera may be due to domestic sewage, industrial effluents, and plumbing [14, 35, 36].
Recently, it revealed Cd pollution in the wells of Pakistan with Cd concentration above the suggested Cd level by the US-EPA [1,12]. Khan et al. [34] described that 50-60% of the population in Khyber Pakhtunkhwa, Pakistan, was distressed from chronic Cd-toxicity. Muhammad et al. [37] stated that the epidemiological and clinical evidence of Cd skin wounds is because of the utilization of Cd-dirtied groundwater for ingestion in Pakistan.
When the Cd concentration in groundwater samples was compared with respect to different sources, it was observed that the mean Cd concentration was greater in tube wells (4.66 × 10⁻² mg L-1) and electric pumps (4.52 × 10⁻² mg L-1) than in hand pumps (2.31 × 10⁻² mg L-1) groundwater (Fig. 1). Contrary to this work, Ashraf et al. [38] also stated a higher concentration of Cd in hand pumps than in tube wells in various regions near Karachi-Pakistan. Usually, the type of water source does not play any main role in the Cd concentration of groundwater. Conversely, it mostly depends on the depth from which the groundwater is pumped to surface groundwater.
A comparison of Cd levels in collected groundwater samples concerning depth exhibited that the mean Cd concentration elevated up to a depth of 200 feet and then reduced. This indicated that groundwater <100 feet or above 300 feet carried less amount of Cd than groundwater between 100 feet and 300 feet depth in the district Khanewal (Fig. 2). The higher content of Cd between 200 feet and 300 feet might be because of the presence of the Cd-containing minerals at these depths, which have been primarily deposited in these layers of the soils previously. Thus, deep or shallow wells may be chosen in the Khanewal district for drinking purposes. Usually, it is presented that the Cd concentration is higher in shallow groundwater than in deep groundwater. Cai et al. [39] also stated a higher Cd amount (7.0 × 10⁻² mg L-1) up to a depth of 100 meters (>200 feet). Nonetheless, at a depth of >100 meters, authors stated that without Cd-contaminated groundwater.
Comparison between collected groundwater samples from urban and rural regions showed that rural regions carried more Cd in their groundwater than urban regions. Murtaza et al. [1] observed a higher Cd amount in the rural regions than urban regions of Multan and Khanewal, Pakistan. This indicated that the Cd level may vary with rural and urban regions and the range varies with tehsils and districts. The variation in Cd concentration in groundwater of rural and urban regions depends on the type of anthropogenic sources in addition to the mineral forms in the earth’s crust. In rural regions, agricultural practices including fertilizers and pesticides are major sources of Cd pollution. Nonetheless, in urban regions, different types of industries may pollute groundwater with Cd. Additionally, irrigation of crops with Cd-contained water may also raise Cd levels in the groundwater. Thus, the Cd concentration in groundwater of urban and rural regions depends on their sources. Cadmium pollution of soil and groundwater is a worldwide problem that affects resources for food and drinking water mainly in Asia and Africa. Further efforts to clean wastewater, inhibit leachate of contaminated material, e.g., in landfills and mines, and reduce the use of Cd-contaminated phosphate fertilizers are necessary to decrease anthropogenic Cd output. Depending on time scale, geographic position, and land use, there are different scenarios for the quantity of Cd input into groundwater and the amounts of various sources, mainly deposition and P fertilizers. Apart from that, anthropogenic Cd input occurred in some areas in the past, which led to delayed Cd leaching into groundwater from soil and aquifer solids. There are other anthropogenic influences, e.g., fertilization and acidification, altering the hydrogeochemistry and thus enhancing the release of naturally occurring Cd.
Exposure Evaluation and Cancer Assessment
The values of ADD recorded in the present study are comparable to those noted in Punjab and other provinces in Pakistan (mean 2.7, ranging from 2.10 × 10⁻⁵ to 4.61 × 10⁻³ mg kg-1 day-1) [5]. Nonetheless, these values or findings were greater than previous ones recorded in Khanewal by Murtaza et al. [1], Nowshera, Pakistan by Khan et al. [34], Uttar Pradesh, India (1.3 × 10⁻³ -3.08 × 10⁻³ mg kg-1 day-1) by Idrees et al. [32], and Kasur, Pakistan (2.1 × 10⁻⁵ -4.6 × 10⁻³ mg kg-1 day-1) by Ashraf et al. [38]. Moreover, in Korea, Lim et al. [40] recorded a higher average daily dose (ADD) i.e. 3.0 × 10⁻² – 2.35 × 10⁻¹ mg kg-1 day-1, and it matched to findings of the present research work.
In this work, almost all collected samples surpassed the suggested toxic risk index of 1.00. This indicated possible health risks in district Khanewal regarding groundwater intake for drinking purposes. Belkhiri et al. [41] noted higher HQ values i.e. 0.8-30.5 in rural zones of Algeria. In their study, 80% of samples from different areas were above the toxic risk index limit. Comparable to HQ, CR, and ADD values higher than the USEPA recommended limit for all collected samples of district Khanewal. The findings suggested that people living in examined regions that are exposed to Cd through drinking water are at carcinogenic risk (Table 5). This indicates that regular monitoring and Cd remediation are needed to keep people safe from health risks due to the consumption of Cd-contaminated water.
Conclusions
This research indicates that groundwater from urban and rural regions of four tehsils of Khanewal district is unsafe for drinking purposes with higher values of hardness, electrical conductivity, total dissolved solids, higher cations ratio, and alkalinity than WHO, USEPA as well as Pak-NEQS safe limits for drinking water. Moreover, it contained higher levels of Cd, which is up to 10 times more compared to the WHO-recommended safe limit (3.0 × 10⁻³ mg L-1). In district Khanewal, Jahanian tehsil groundwater shows severe risk among all examined tehsils. The parameters of the health risk assessment also indicated possible health risks of Cd exposure because of the consumption of Khanewal groundwater for drinking purposes. The hazard quotient values of Cd in district Khanewal are up to 150.84, which shows the possibility of health risks linked with the consumption of Cd-contained groundwater for drinking purposes.

