

Introduction
Global biodiversity is currently facing a concerning decline, drawing the attention of scientists and researchers worldwide [1]. Among the ecosystems most vulnerable to extinction are deserts, known for their open landscapes characterized by a permanent structure of perennial plants and fragmented spaces where ephemerals may exist briefly [2]. The combination of climate change and human-induced desert degradation and fragmentation is exacerbating the situation, leading to synergistic effects that contribute to the global decline in biodiversity [3]. The reduction in floristic diversity carries significant implications, including ecological imbalance, environmental degradation, depletion of biological resources, food crises and decreased primary productivity [4]. In order to maintain biodiversity stability, conservation of desert is crucial, because desertification ranks among the most pressing ecological and socioeconomic issues of our time [5]. Desertification is driven by the impacts of climate change, including altered precipitation patterns and global warming. This problem is further exacerbated by anthropogenic factors, such as uncontrolled grazing and cultivation in arid and semiarid regions. Currently, around 30% of the world’s land area is grappling with desertification [6]. Over time, external stressors can significantly impact the evolution of plant communities, leading to a decline in soil fertility and consequently affecting the well-being of more than 25% of the world’s population [7]. Plant ecologists have adeptly described the variations within floristic communities along the environmental gradients influenced by factors such as climate change, human activities and soil ecophysiology. These factors synergize at both regional and global scales, providing the insights needed for successful ecosystem restoration and biodiversity conservation [8].
Cholistan Desert (CD) is an extension of the Great Indian Desert, situated in the eastern part of Pakistan and the southern region of Punjab. Its geographical coordinates range from latitudes 27°43' to 29°45'N and longitudes 69º56'30'' to 72°51'30''E, with an average elevation of approximately 112 meters above sea level [9]. CD is a sandy desert covering an area of about 26,000 km2 [10]. It encompasses 8% land area of the Punjab and two thirds of Bahawalpur division. Around 1200 B.C., the Hakra River used to flow through Cholistan, but it gradually diminished by 600 B.C. [11].
Severe damage has been observed during the dry period in the CD, which may last for two to three years [12]. Significant fluctuations in temperatures have been recorded; with an average night time temperature of 20ºC and daytime temperature of 45ºC, which may reach 51ºC. CD remains dry throughout the year except during the two months of August and September when the monsoon season brings 80% of the annual rainfall ranging from 88-135 mm. Groundwater in this region is saline and is typically found at depths of 80-100 meters below the surface. Tobas (natural ponds filled after rain) serve as the only source of water for both people and animals [13].
Despite being one of the driest deserts, the Cholistan Desert is rich in biodiversity, including a variety of grasses (Aristida, Cenchrus, Lasiurus, Panicum), herbs (Aerva, Chenopodium, Dipterygium, Suaeda, Zygophyllum) and shrubs (Capparis, Haloxylon, Polligonum) [12]. Fauna includes carpenter ants, crow, crow pheasant, cochineal rabbits, deer, desert monitor, insect, Indian Cobras, and lizards which are frequently used by natives for indigenous medicinal purposes. Domestic animals include cattle, camels, goats and sheep [14], which are essential resources for daily life. Around 10.8% of Pakistan’s GDP originates from animal productivity, medicine and sustainable feed resources. From this perspective, the Cholistan Desert significantly contributes a wealth of 135 million livestock [15].
Based on parent rock material, topography, soil composition and vegetation characteristics, the Cholistan Desert is divided into two regions; Lesser Cholistan and Greater Cholistan. Lesser Cholistan, also known as Northern Cholistan has extensive canal-irrigated areas covering 7770 Km2, and its soil consists of less sandy ridges intermixed with sporadic salty alluvial flats. On the other hand, Greater Cholistan, often referred as Southern Cholistan covers an area of 18130 Km2, and has soil composition dominated by large sand dunes [14, 16]. Overall, 81% of CD’s area is sandy, while only 19% comprises alluvial flats and small dunes [17]. In 2017, total population of the CD was 229,908 in scatter form with a 3.48% annual growth rate. Lesser Cholistan is densely populated as compared to Greater Cholistan [18].
The Cholistani people are nomadic, and rely on resources like agricultural land, livestock, natural vegetation, pasture land, water bodies (tobba), wildlife (flora and fauna) etc. When resources in one area become depleted, they migrate to another part of the desert [19]. The increase in the desert’s population due to the settlement and semi settlement has intensified the demand for food and shelter, placing additional pressure on existing resources [18]. Agricultural practices have also been on the rise, due to government subsidies for solar-powered tube wells and drip irrigation installations. Recent droughts and extensive overgrazing have exerted significant pressures on the indigenous wildlife and flora of CD [13]. This highlights the urgent need for proper management, protection, and rehabilitation. While some conservation practices are already underway in CD, it has become a pressing priority to assess the extent to which protected areas contribute to conservation efforts. Analyzing the development and changes in arid and semi-arid regions influenced by climate change, edaphic factors, and human impacts holds great significance in understanding the current floristic status and its conservation. To date, no comprehensive study has thoroughly explained all these factors and their impacts on the Cholistan Desert [19]. Therefore, present work was conducted with the objectives (1) to assess the actual floral diversity changes at selected protected and unprotected sites (2) to analyze the effectiveness of conservation strategies adopted in CD (3) to identify the potential anthropogenic, climatic, and edaphic factors at play in study areas (4) to find relationship between vegetation diversity and identify operating factors in CD.
Materials and Methods
Study Area
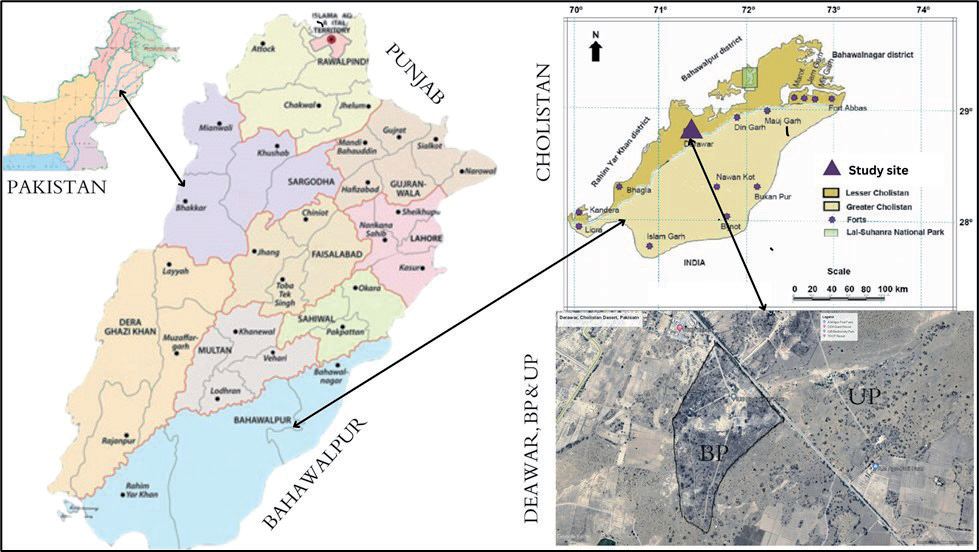
For the current study, Derawar region of the Cholistan Desert was selected, situated at 28°46′04″ N, 71°20′02″ E [20], 97.5 kilometers away from Bahawalpur city via NH5/AH2, Ahmedpur to Derawar Fort Road Choloistan Desert. This settlement has been known by various names over time. Presently, the most widely recognized name is Derawar, named after its founder, Dev Rawal, who constructed the fort. The Hakra River used to irrigate this kingdom until 1200 BCE, but it gradually disappeared around 600 BCE. As the river dried up, this area transformed into a desert, yet its fort still stands tall [20, 21]. Maximum anthropic activities were observed during the field visits of non-fenced nearby areas of Derawar CD. Therefore, these non-fenced areas were designated as the unprotected site while the fenced area near Derawar Fort is referred to as the protected site called Biodiversity Park. This park was jointly established in 2012 by the Environment Protection Department and Cholistan Development Authority and now under the control of The Islamia University of Bahawalpur, Pakistan. It is located at 29°46′585″ N, 71°19′496″ E at an elevation of 330 ft. The area of this park is 85 Acres (Fig. 1).
Vegetation Sampling
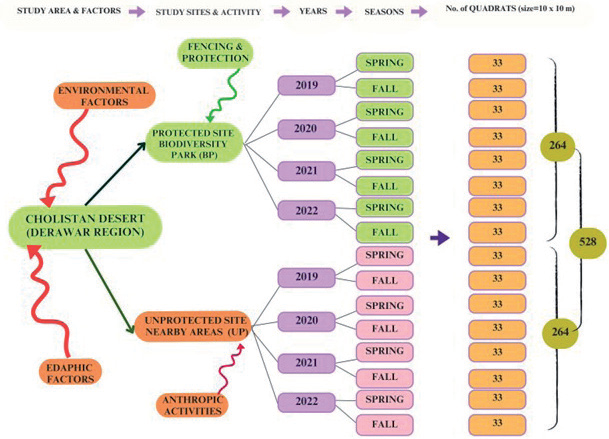
The systematic field surveys were conducted for four consecutive years spanning from February 2019 to October 2022, to study the phytosociological characteristics of two selected sites; (1) Nearby unprotected areas of Derawar (UP), and (2) Protected areas of Biodiversity Parks (BP) during two seasons of each year; spring (February to March), fall (September to October). A total of 528 quadrats were established at the sampling sites, with 264 quadrates at protected and 264 in the unprotected sites during the four years period. This means that data was collected from 33 quadrats in BP during one season of each year. The quadrats had dimensions of 10 × 10 meters and were randomly placed at each selected site to maximize ecological diversity (Fig. 2). Data from each quadrant was recorded following the methodology outlined by Hussain, Ludwig and Ahmad [22-24]. Garmin eTrex, Global Positioning System (GPS) was used to determine the geographic aspects (altitude, latitude, and longitude) for all site of Derawar region of Cholistan Desert, Punjab, Pakistan [25]. During the survey, wild plants were sampled, carefully pressed, dried, and affixed to herbarium sheets measuring 41×29 cm. Taxonomic identification of the collected plant samples was conducted using the Flora of Pakistan, relevant literature, and established herbaria at the Cholistan Institute of Desert Studies [26, 27]. The herbarium was deposited in the Department of Botany, The Islamia University of Bahawalpur, Pakistan (IUB).
Soil Physico-Chemical Analysis
Soil samples were systematically collected during both the spring and fall seasons of the years 2019 to 2022, extracted from a depth of 0-30 cm in each quadrant, and then carefully placed in polythene bags, each labeled for identification. A total of 48 soil samples were collected (24 from UP and 24 from BP) after pooling the replicate from each site. Soil samples were thoroughly mixed, air-dried, and passed through the 2 mm sieve to separate the gravel and the large particles of the root [28]. Soil elemental composition and physiochemical properties were assessed at the soil science laboratory of the Regional Agricultural Research Institute Bahawalpur, Pakistan. Soil textures were determined by hydrometer [29, 30], pH was measured with the pH meter, electrical conductivity with an EC meter [31], and soil organic matter was determined by using the methodology of Nelson [32, 33]. Calcium concentration was estimated with the methodology of Lanyon and Heald [34, 35]. Nitrogen concentration was estimated with the Kjeldahl methodology [36, 37] and phosphorus, potassium, and sodium contents by the methodology of Olsen and Sommers [38, 39].
Environmental Data
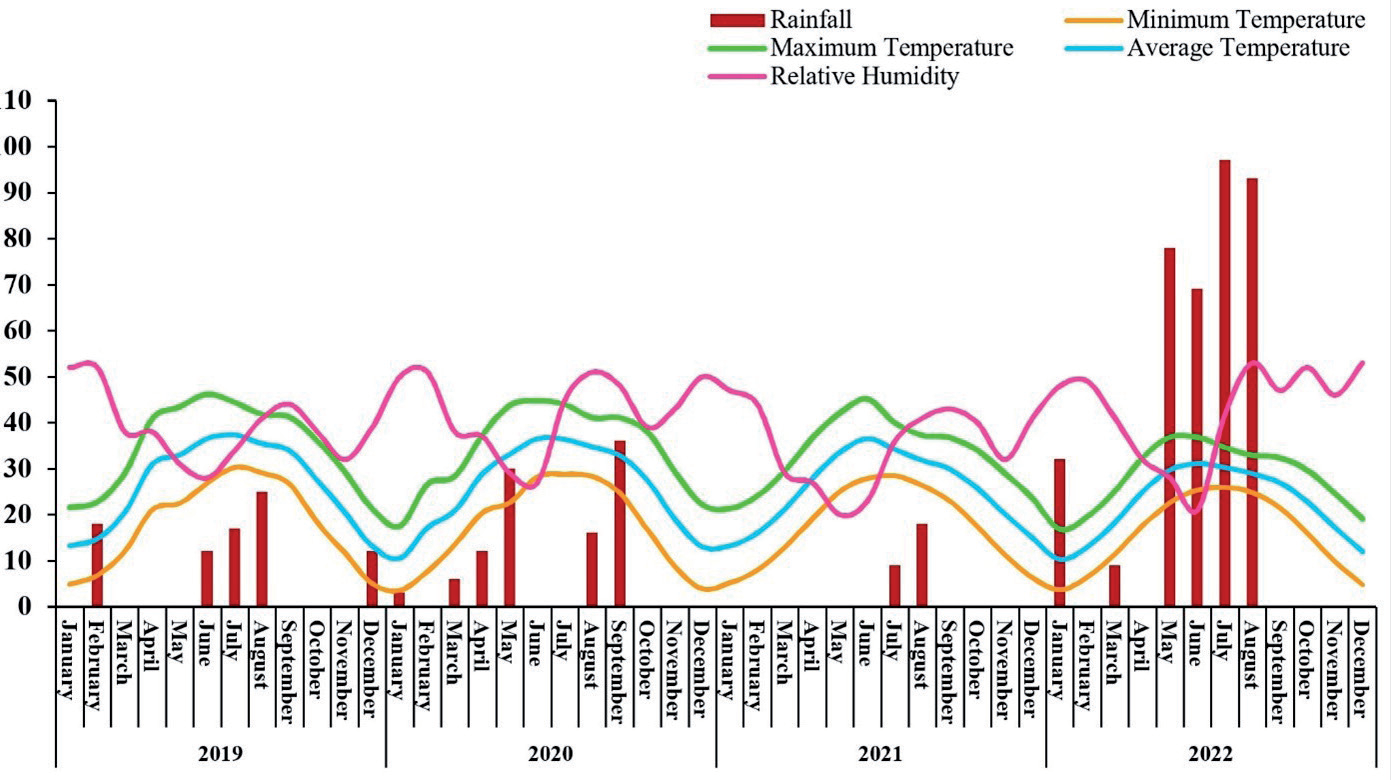
Meteorological data, including temperatures (maximum, minimum, and average), relative humidity, wind speed, evaporation, and rainfall was collected from a field research station of CD, Pakistan Council of Research in Water Resources (PCRWR), Pakistan Meteorological Department Bahawalpur [40], as well as the weather stations at Bahawalpur airport. The data covers all months of the study period, which spanned from 2019 to 2022.
The climate at the study site in Derawar is characterized as arid, featuring irregular weather conditions with significant variations in rainfall and long periods of dryness. The mean monthly precipitation data for the four-year period falls within the range of 9 to 197 mm, occurring primarily between July and September before the fall season, and ranging from 0 to 32 mm during the spring season, typically between February and April. Temperature fluctuations are observed between 13ºC to 29ºC during the spring season and 32ºC to 46ºC during the fall season. Relative humidity, wind speed, and evaporation rates are generally low during the spring season but increase during the fall season (Fig. 3).
Anthropogenic Factors
The assessment of anthropogenic factors was conducted through visual observations for each sample plot during every survey at the study site. Prominent anthropogenic attributes taken into consideration include agricultural practices, construction sites, deforestation, military activities, over-collection, the presence of invasive species, overgrazing, overhunting, solid waste accumulation, urbanization, and tourism. Assessment of the human activities was carried out at the four levels. Therefore disturbance intensities were estimated visually at four different levels [7, 41]; 1 = Absent, 2 = Low, 3 = Moderate, and 4 = High.
Data Analysis
The phytosociological data related to flora, anthropogenic factors, climatic variables and soil physico-chemical characteristics were systematically organized and processed using Microsoft Excel 2016 [25]. This allowed for the quantitative analysis of vegetative data, including density, frequency, and cover, along with their respective relative values, calculated following the methodology established by Hussain [42, 43]. All three relative values were summed up to determine Importance Value Index (IVI) [44, 45]. Diversity Index like the Simpson Diversity Index (D) was calculated by following the formula by Simpson [5, 46], and the Shannon-Wiener Index (H’) was computed according to Shannon and Wiener [47, 48]. Species Richness (R) was documented by following Margalef [49, 50] and Species Evenness (E) was calculated by following Pielou [51, 52]. For statistical analysis, the data was further processed in the SPSS Version 16.0 where LSD tests were applied in order to determine the simple averages, mean values, and percentiles, to make required graphs and tables [53]. Due to fencing, seasons, anthropic factors, edaphic and climatic factors, this data was huge and more or less homogeneous at protective site and heterogeneous at unproductive sites, which is why the data were subjected to R Studio (R 4.2.2 software) for Windows. Canonical Correspondence Analysis (CCA) was carried out and heat maps were prepared in R software to illustrate the relationship between species distribution, associations, seasons, edaphic, anthropic and environmental factors of Derawar region of CD [54].
Results
Species Composition
The reflection of the vegetation and the plant resource is termed the floristic diversity of an area. The average floristic composition across all selected sites (protected, unprotected), during all seasons (spring, fall), and all years (February 2019 to September 2022) comprised 84 species belonging to 62 genera and 26 families. Among all the families Poaceae (22 spp.) was dominant followed by the Amaranthaceae (12 spp.), Fabaceae (7 spp.), and Zygophyllaceae (4 spp.) were the leading families. Other families included Aizoaceae, Asteraceae, Cleomaceae, Euphorbiaceae, Heliotropiaceae, and Malvaceae had 3 spp. each. Apocynaceae, Cucurbitaceae, Nyctaginaceae, Polygonaceae, and Tamaricaceae had 2 species each while the rest of the eleven families (Acanthaceae, Asphodelaceae, Boraginaceae, Capparaceae, Caryophyllaceae, Cyperaceae, Gisekiaceae, Lamiaceae, Molluginaceae, Portulacaceae, Salvadoraceae) had 1 species each (Fig. 4). Of 84 plant species, 42 were herbs, 22 grasses, 12 shrubs, 7 trees, and one sedge species (Table 1).
The number of species in protected site were 76 belonging to 23 families. The protected site was dominated by herbs and grasses because out of 76 plant species, 37 were herbs, 20 were grasses, 11 were shrubs, 7 were trees, and 1 was sedge. However, the unprotected site has lower floristic diversity than the protected site, as they had only 49 species from 15 families. This site had 19 herbs, 12 grasses, 11 shrubs, and 7 tree species which shows the dominance of herbs, grasses and shrubs (Fig. 4).
Seasonal Distribution of Species in Protected and Unprotected Sites
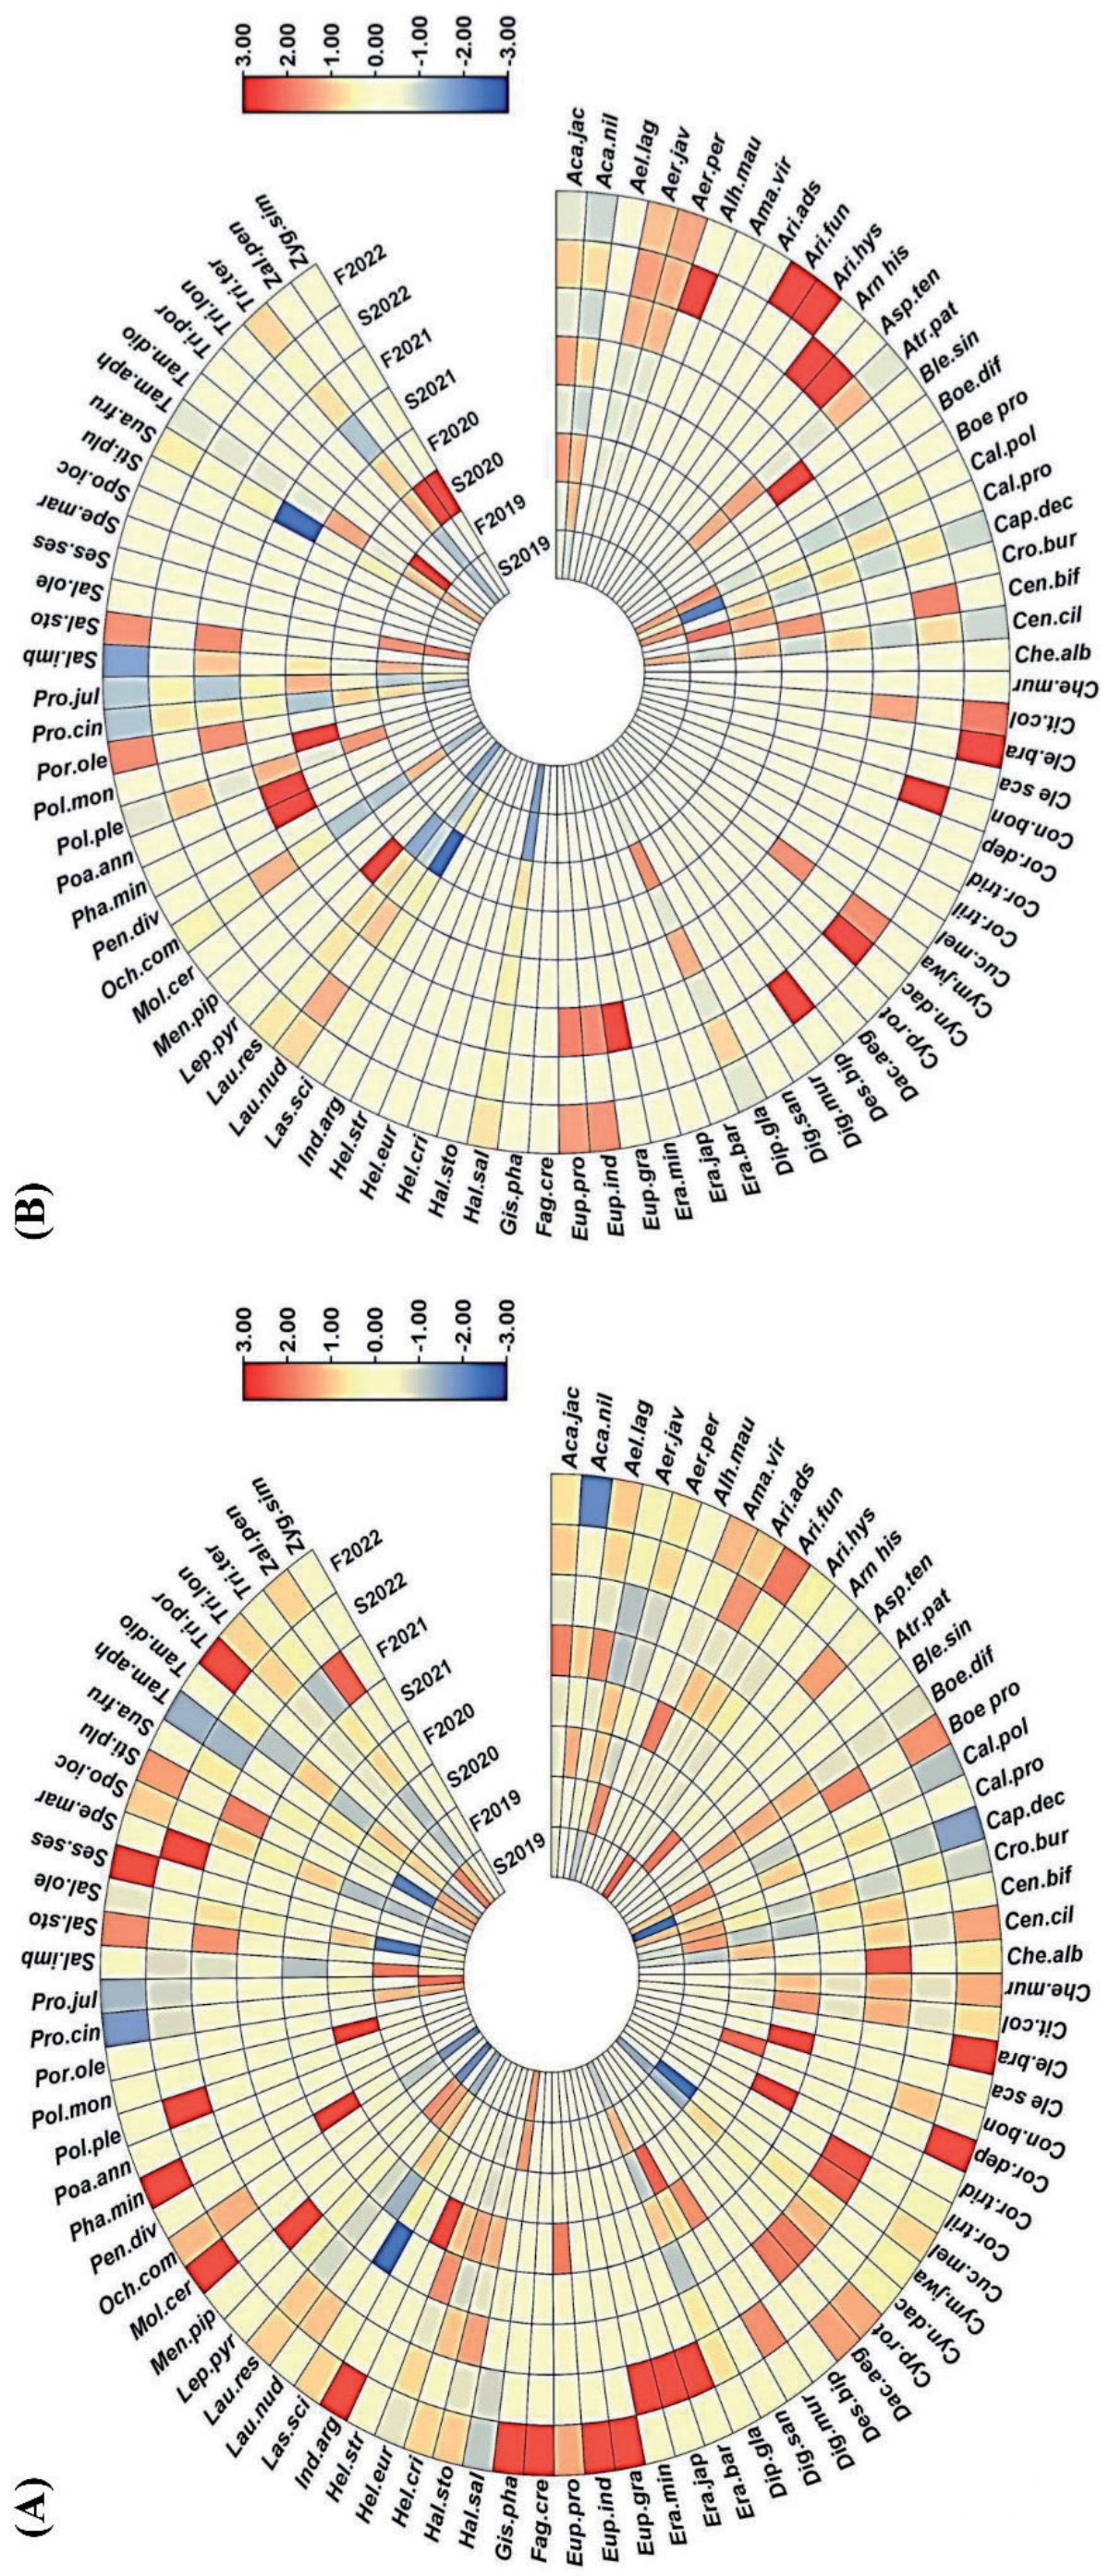
A cicular heat map visualization (Fig. 5) was used to analyze the floristic species distribution based on their IVI values from eight seasons of four years. This investigation also explain the presence and absence of species at BP and UP sites of Derawar region of Cholistan Desert. Generally, more species were present at BP than UP site. Seasonal comparison reveals that overall diversity increased from spring to fall in protected site, while the opposite trend was observed in unprotected site. Heat map also indicated the general diversity increased from 2019 to 2022. For example, Acacia nilotica, Calligonum polygonoides, Calotropis procera, Capparis decidua, Cenchrus ciliaris, Haloxylon salicarnicum, Lasiurus scindicus, Prosopis cineraria, Prosopis juliflora and Salsola imbricata were distributed throughout the study at both BP and UP site. However, Cymbopogon jwarancusa, Ochthochloa compressa, Sporobolus ioclados, Tamarix aphylla and Tamarix dioica found abundantly and increased from 2019 to 2022 at BP while Aristida adscensionis, Aristida funiculate, Fagonia cretica, Gisekia pharnaceoides, Indigofera argentea, Mollugo cerviana, Sesuvium sesuvioides were only found at BP with lowest diversity (Fig. 5a). Blepharis sindica, Atriplex patula, Arnebia hispidissima, Alhagi maurorum, Desmostachya bipinnata, Poa annua, Portulaca oleracea and Zygophyllum simplex were absent from BP and found with very low IVI at UP (Fig. 5b).
Diversity Indexes
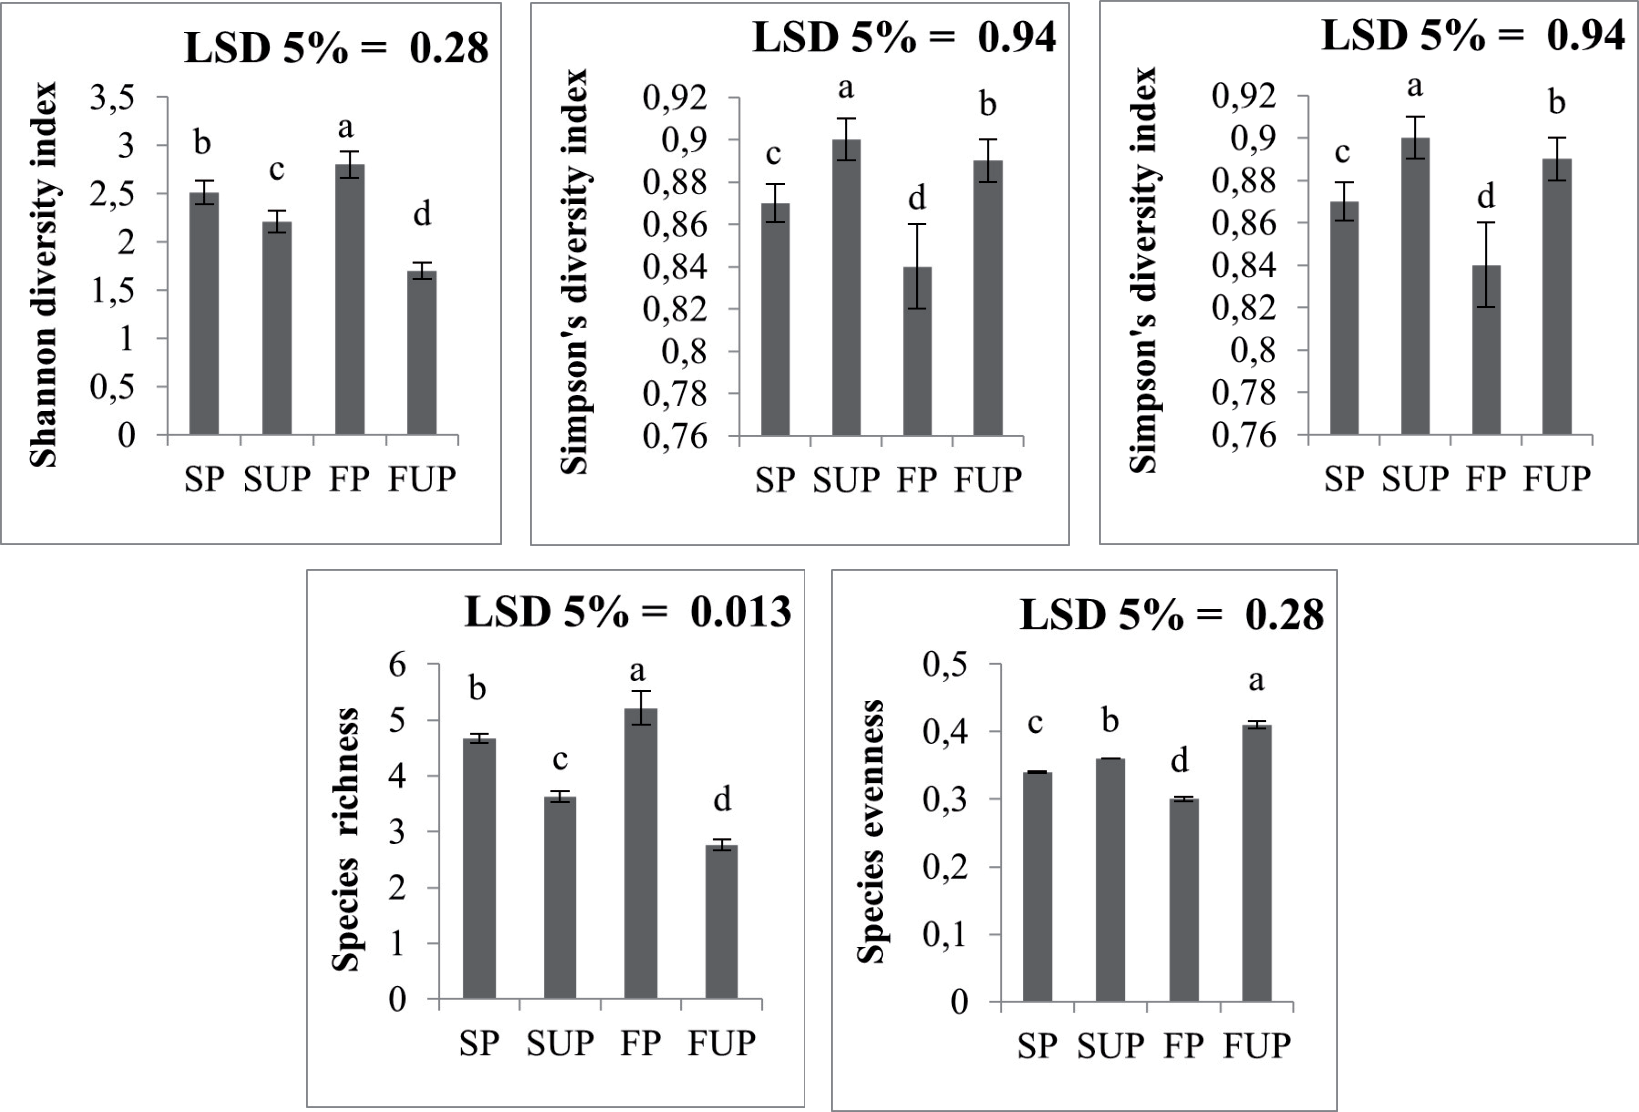
Indexes are indicators of how many different types of species are present in the community. The Shannon-Wiener index showed a significant decrease from protected to unprotected site (p<0.05). In the protected site, it increased significantly from 2.51 during spring to 2.8 during fall. However, a significant decline in the Shannon index was recorded for the unprotected site as compared to protected ones; it significantly decreased from 2.21 during spring to 1.7 during the fall season. These results confirmed that protected areas have shown a significant increase in diversity during the fall season as compared to the unprotected site because a larger Shannon-Wiener index directs greater diversity (Fig. 6).
In Fig. 6, the Simpson index significantly increased from protected to unprotected sites but it significantly declined from 0.87 during spring to 0.84 during fall and for the protected site (p<0.05). However, unprotected sites showed greater values for the Simpson index, which significantly decreased from 0.90 during the spring to 0.89 during the fall. Here, the lesser Simpson index symbolizes more diversity which sustains the results revealed by the Shannon-Wiener index. Species evenness significantly increased from the protected to the unprotected site but increased significantly from spring (0.36) to fall (0.41) at the unprotected site. The protected site showed a significant decline in species evenness, which was 0.34 during spring and 0.3 during the fall season. Higher values of evenness show a constant number of species on the site. For more accurate results, species richness was also calculated which indicates a significant decrease in richness as we move from the protected to the unprotected site but there was a significant increase in richness observed from 4.67 during spring and 5.21 during the fall season. On the other hand, the un-protected site significantly declined by 3.63 which was during the spring, and 2.73 during the fall. Higher species richness represents the higher number of species that are present at the study site as in Fig. 6.
Table 1.
Distribution of families, genera and species in protected (BP) and unprotected (UP) sites and their species codes, common names, and habits at Derawar region of Cholistan Desert Pakistan. Table 1. Table continued. Table 1. Table continued.
Fig. 4.
a) Dominant families representing largest number of species found during 4 years of study at Derawar region of the Cholistan Desert, Pakistan; b) Proportion of herbs, grasses, sedges, shrubs and trees in the protected and c) unprotected site of Derawer region of the Cholistan Desert, Pakistan. Seasonal Distribution of Species in Protected and Unprotected Sites
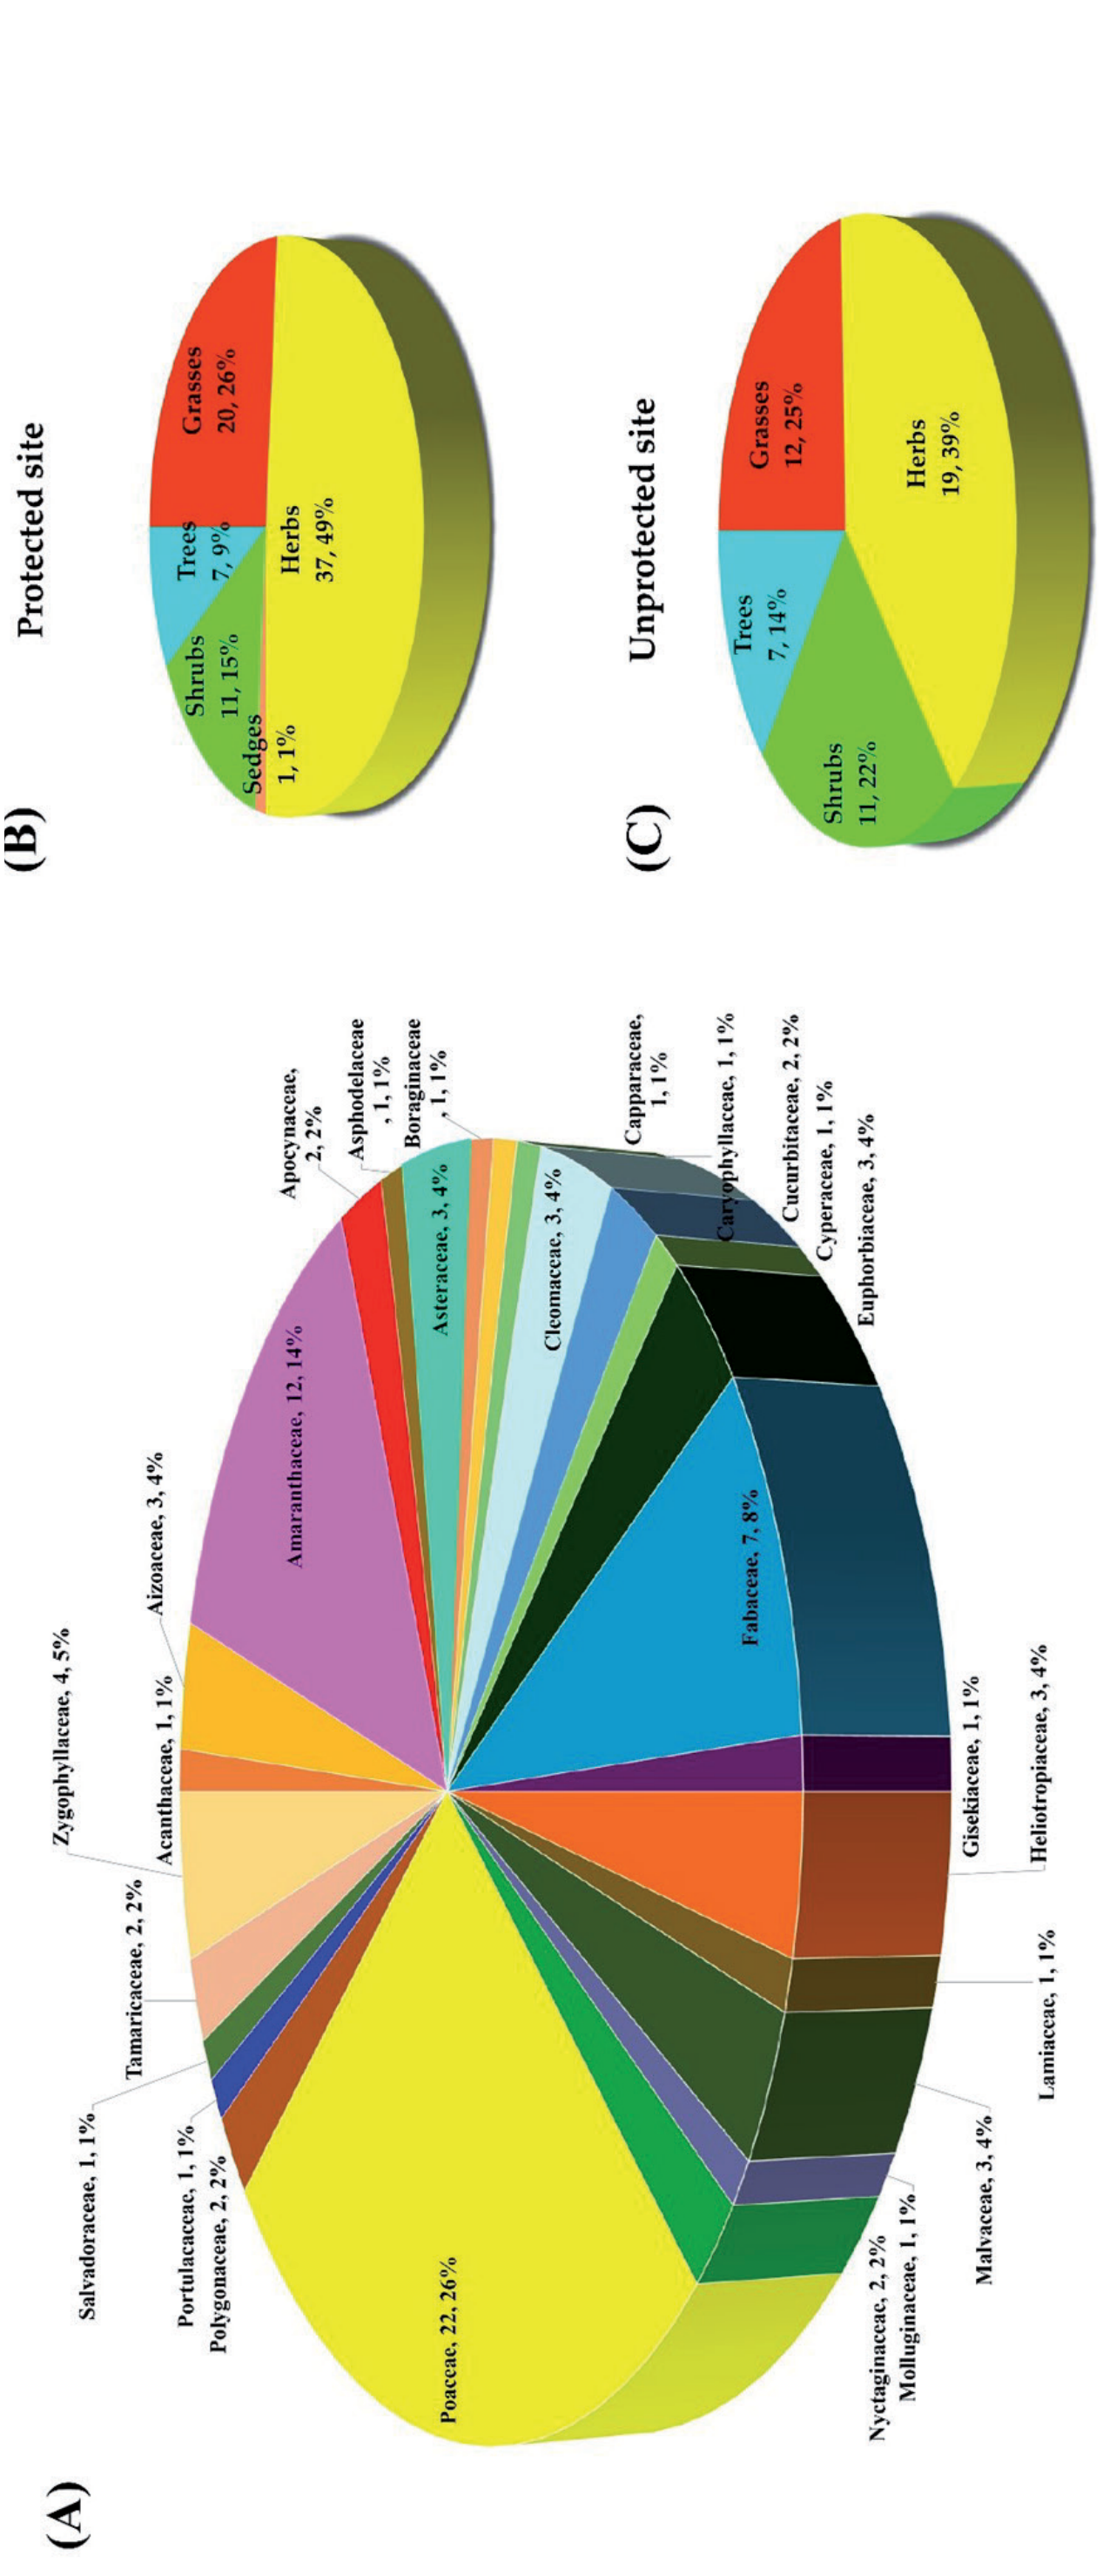
Fig. 5.
Circular heat map analysis of floristics distribution in protected and unprotected study sites of Derawar region of the Cholistan Desert. Both heat maps show correlation of species associations with seasons (red = strong, blue = weak, yellow=absence). Species code description is given in Table 1 where S= spring and F= fall season. a) Floristic distribution of protected site from spring 2019 to fall 2022;. b) Floristic distribution of unprotected site from spring 2019 to fall 2022.
Intensity of Anthropogenic Factors at Study Sites
Heat map was drawn to evaluate the intensity of human induced pressure at BP and UP sites (Fig. 7). Visualizations of map displays two clusters. Cluster 1 showed highest anthropic activities at UP site while cluster 2 indicated lowest man induced pressure at BP site while Strong correlations along with cluster 1 between the anthropic activities (n = 12) and disturbances at the unprotected site (seasons = 8) of which 21 were significant. Of note, there were significant increases in human pressure in fall seasons as compared to spring that also increased year by year. Lowest anthropic activities were observed during spring 2019 and highest during the fall 2022 at UP. Most significantly disturbing activities were over grazing, deforestation, agricultural practices, over hunting, over collection, construction sites, habitat fragmentation, tourism, urbanization military activities and solid wastes at UP while BP has no major anthropic threats but very low anthropic activities were observed due to over collections of plant samples by researchers and students visiting that place, habitat fragmentation, construction site and solid wastes.
Edaphic Factors
The soil texture of protected site was from sandy to sandy loam while the soil was sandy to clayey saline for the unprotected site. Electrical conductivity showed a minor non -significant difference in protected and unprotected site (p>0.05) but soil moisture content significantly increased from protected to protected site (p<0.05). The soil was considerably alkaline having a pH range of 8.47 to 8.22 at both sites. pH, organic matter, soil moisture, and soil nutrients (calcium, nitrogen, phosphorus, potassium, sodium) showed a significant decrease from protected to unprotected site as in Table 2.
Ordination of Plant Species of Protected and Unprotected Site under the Influence of Environmental and Edaphic Variables
Fig. 8, represents the ordination diagrams of CCA showing the influence of environmental, edaphic variations and the ordination of species (based on IVI values) of protected and unprotected site along with seasonal distribution. The CCA1 (first axis) of the protected site showed the 29.42%, the CCA2 (second axis) identified the 21.45%, which covers more than 50% variations while the rest of the CCA3 to CCA7 covers 49% variations. CCA ordination of the protected site in Fig. 8a) confirmed that the environmental variables like precipitation, evaporation, mean minimum temperature, mean maximum temperature, mean average temperature and relative humidity had a significant influence on distributional patterns of species. Plant species that were clustered in the first quadrant showed the influence of relative humidity on their distribution while second and third quadrant species show no effect of environmental variables. Maximum flora of the protected site clustered in the fourth quadrant under the influence of most of the environmental factors like evaporation, mean minimum temperature, mean maximum temperature, and mean average temperature. Moreover in 4th quadrant, near the long arrow head of precipitation there is an assemblage of a lot of species, which show strong correlation and influence of rainfall on the vegetation of Biodiversity Park. Overall, CCA1 and CCA2 of the unprotected site cover the 49.75% variations while the rest (CCA3, CCA4, CCA5, CCA6, CCA7) covers the 50% variations. Fig. 8b) also represent the positive correlation of the environmental variables and species distribution as most of the species were assembled in first quadrant and were positively correlated with the precipitation, humidity and minimum temperature. Going through the second quadrant, very few species were influenced by the temperature and wind speed, while the species of the third and fourth quadrant showed that they are not affected by environmental factors.
Fig. 7.
Cluster heat map presenting the correlations between anthropogenic factors and seasons (spring 2019 to fall to 2022) at protected and unprotected sites. Absent anthropic values (0.8-1) are blue while the highest value (2.40) are yellow (see color scale). Different color densities represent the corresponding ratios. Fall, S = spring, pr = protected, upr = unprotected, Agr_prac = agricultural practices, C_sites = construction sites, H_frag = habitat fragmentation, Def = deforestation, Mil_act = military activities, Ove_coll = over collection, Inva_sp = invasive species, O_gra = over grazing, O_hun = over hunting, S_waste = solid waste, Urban = urbanization, Tour = tourism.
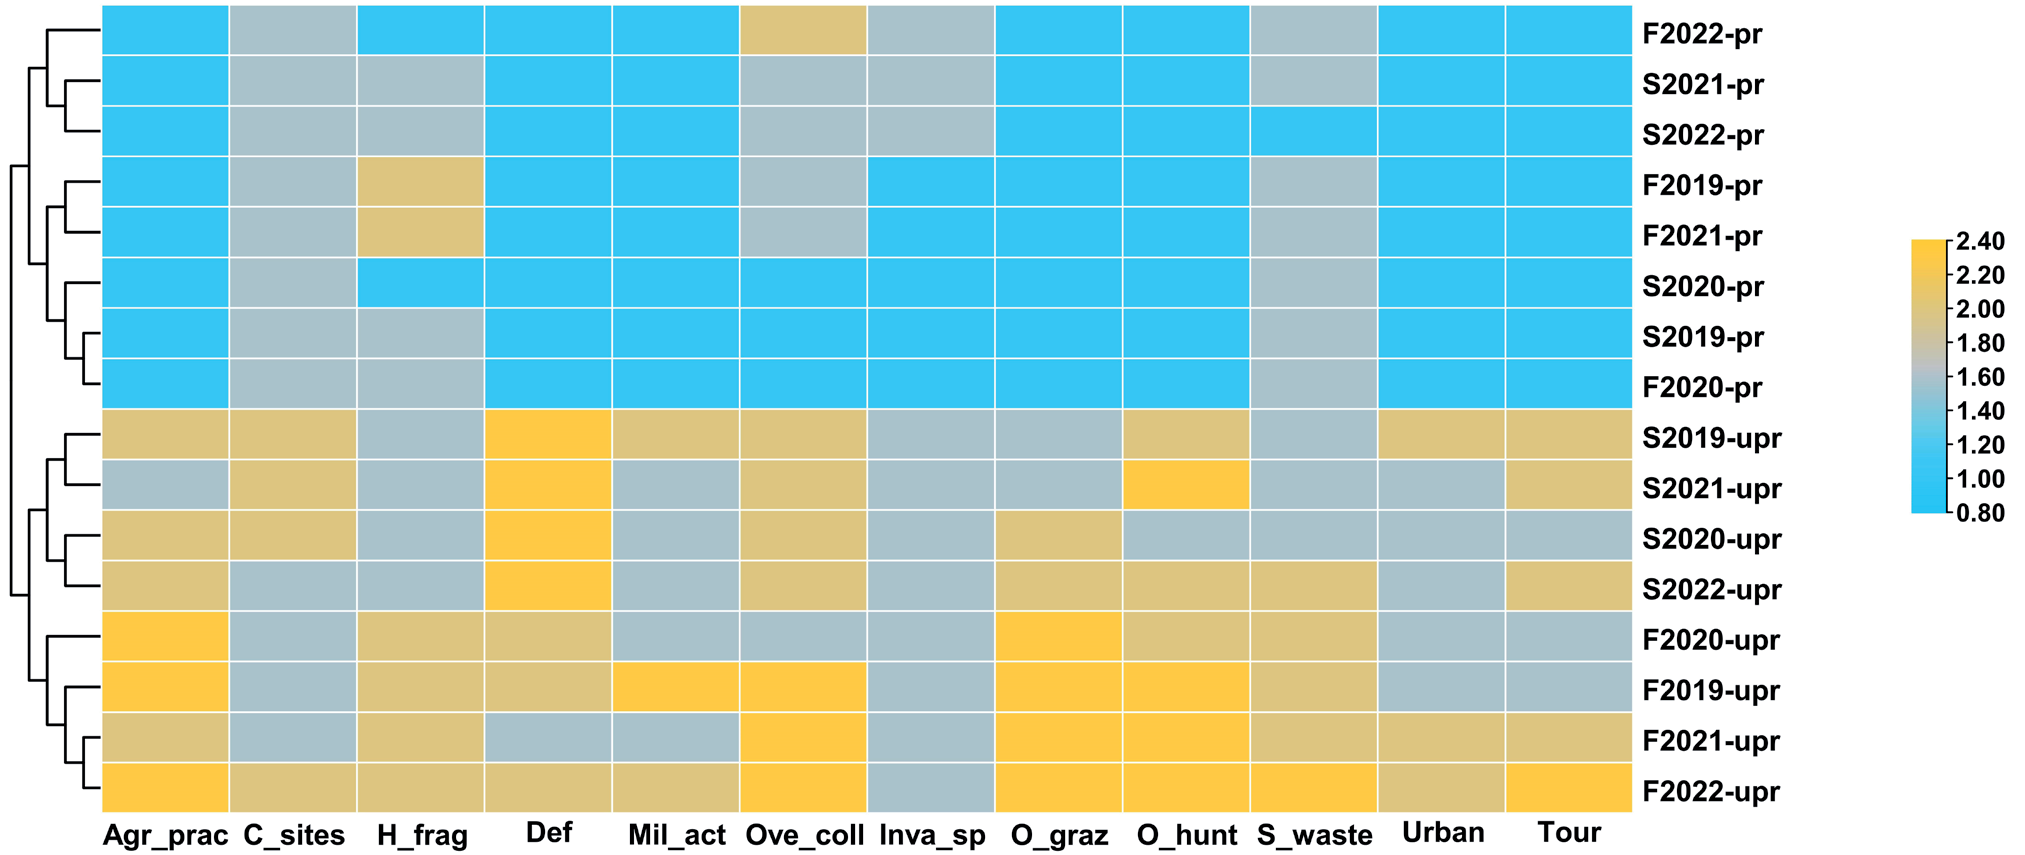
Table 2.
Soil physicochemical characteristics of the protected and unprotected study sites of Cholistan Desert.
Fig. 8.
Ordination diagrams of CCA representing the relationship among environmental, edaphic factors (arrows) and the ordination of species from protected and unprotected sites along with seasonal distribution. a) CCA analysis showing the species distribution under the influence of various environmental variables at protected sites; b) CCA bi-plot diagram depicting the species distribution under the impact of different environmental factors operating at unprotected sites. Where Evap = Evaporation rate, MmiT = Mean minimum temperature, MmaT = Mean maximum temperature, MAvT = Mean average temperature, Prept = precipitation, RH = Relative humidity, WS = Wind speed, row1 = spring 2019, row2 = fall 2019, row3 = spring 2020, row4 = fall 2020, row5 = spring 2021, row6 = fall 2021, row7 = spring 2022 and row8 = fall 2022; c) Data attribute plot of CCA presenting the distribution of species under the effect of diverse edaphic factors at protected site; d) CCA diagram showing the floristic distribution under the influence of different edaphic variables at unprotected site. Where EC = Electrical conductivity, Ca = calcium, N = nitrogen, P = phosphorus, pH = pH, SM = Soil moisture and SOM = Soil organic matter. Plant species are represented by the first three letters of the genus and species name. Species code description is given in Table 1.
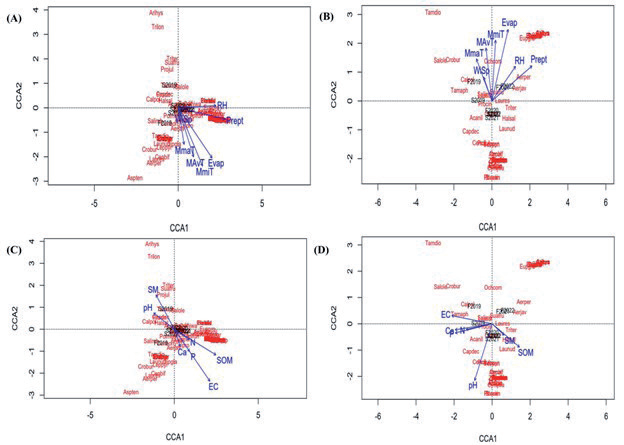
Ordination of different plant species of protected site (Fig. 8c) represented the positive correlation and influence of edaphic variables with the flora. Species impacted by the soil moisture and pH were assembled in the second quadrant while the species strongly influenced by the edaphic factors were clustered closely around the calcium, electrical conductivity, nitrogen, phosphorus and soil organic matter. Species found in first and third quadrant are not influenced by the edaphic variable. On the other hand CCA analysis (Fig. 8d) of unprotected site resulted that species that were sensitive to edaphic variable like electrical conductivity assembled in second quadrant while most of species assembled in fourth quadrant under the influence of the soil moisture and soil organic matter. Calcium, nitrogen, phosphorus and pH were negatively correlated with few species that fall in fourth quadrant.
Discussion
Arid regions, characterized by limited vegetation and very low precipitation rate, possess rich natural flora. However, in the current scenario, they face significant threats from seasonal, climatic, edaphic, and anthropic pressures, which make these deserts highly susceptible to biodiversity loss.
In the Cholistan desert, Biodiversity Park near Derawar serves as one of the protected habitats showed and exhibits higher floristic diversity, with 76 species belonging to 23 families, in contrast to unprotected habitats where there are 49 species and 15 families. A similar study was conducted in Mansehra, Pakistan, and stated that the protected sites tend to harbor more diverse plant communities due to reduced human-induced activities [55]. Cooke and their colleagues also reported similar results [56]. Herbs and grasses dominated fenced habitats due to protection from grazing while public areas have less number of herbs and grasses [57, 58]. Protected site of Derawar region of Cholistan Desert have dominant families i.e. Poaceae, Amaranthaceae, Fabaceae and Zygophyllaceae due to the absence of human induced activities. A study by Bagoriya and his colleagues also concluded that Poaceae and Fabaceae are the most dominant families at Tal Chhapar wild life sanctuary in Rajasthan, India [59]. Poaceae, Fabaceae, Amaranthaceae are leading families in Dongyztau, Kazakhstan. Fenced territory and arid environments of habitat characterizes the predominance of resulting families in the vegetation of the site [60].
In the Cholistan Desert, the protected site of Derawar exhibited greater plant diversity during the fall season compared to spring. This was attributed to the higher levels of precipitation recorded during the monsoon season (ranging from 9-197 mm), which triggered the germination of numerous grasses and herbs. Summer precipitation plays a critical role as a critical trigger of species distribution and richness [61]. Monsoon rains bring forth a lush green carpet of flora in the Thar Desert of Pakistan [62].
On the other hand, the current study indicated that the unprotected site had relatively higher diversity during the spring season compared to the fall. This was attributed to increased herding activities during the fall season, leading to overgrazing and soil disturbance by the hooves of animals. This, in turn, reduced vegetation cover during the fall season, whereas in spring, plants had ample time to regenerate. Overgrazing leads to a decrease in plant diversity [63]. Intense grazing contributed to a decrease in species richness in the Northern China desert [64]. Higher plant density in unprotected areas during spring was due to plants adopting a regeneration strategy in unprotected areas compared to protected ones IVI is a composite measure three key phytosociological parameters like relative density, relative frequency, and relative cover, which collectively indicate the dominance of species [58]. Ochthochloa compressa, Cenchrus ciliaris, and Lasiurus scindicus are grasses in protected sites that had shown the highest IVI values as protected areas are fenced and managed that’s why to have low anthropic pressure including grazing and more availability of soil nutrient. A study on Ordos Plateau also confirmed that grasses have high aboveground biomass due to good soil texture and fencing that eliminated grazing factors [65]. The absence of grazers and human activity increased the IVI of grasses at the wildlife reserve in Nepal [66].
In unprotected sites, Suaeda fruticosa, Haloxylon salicornicum, and Salsola imbricata exhibited the highest phytosociological parameter values, while grasses have the lowest IVI value. This is attributed to several factors, including the clayey soil texture prevalent in most unprotected sites, the occurrence of drought periods, and overgrazing by herds during the sprouting season. These combined factors resulted in a reduction in the seed bank and contributed to the relatively lower diversity observed in these sites, characterized by the dominance of unpalatable shrubs. Anthropogenic factors disturb the phytosociological attributes very badly in an environment [67]. A study on Cholistan desert in Pakistan, also support our results that the Suaeda, Haloxylon, Salsola, and Calotropis species dominated clayey saline patches, based on soil types [68]. Prolonged drought and herbivory have been observed to reduce grass population and promote the establishment of shrubs in the southwestern United States [69].
Regarding diversity indexes, Shannon-Wiener index, Simpson index, and species richness showed greater diversity in protected sites compared to unprotected ones but species evenness was lower in protected sites than in unprotected. The reduced diversity in unprotected sites can be attributed to cumulative effects of anthropic, edaphic, and climatic factors. Species variation in an area is influenced by factors such as distance from water, overgrazing, and soil composition [68]. A study by Liu and his colleagues also support these findings, highlighting the negative impact of severe climatic and edaphic factors on plant diversity in desert ecosystems [70].
Another factor contributing to the lower diversity indexes in unprotected sites compared to protected ones is intensified pressure from human activities, leading to biodiversity loss, nutrient depletion, and the influence of climatic factors. The current study also indicated the strong anthropic pressures that affected the floristic diversity including high agricultural practices, habitat fragmentation, deforestation, over-collection, overgrazing, construction site, and urbanization. Hassan and Hassan also discussed similar results that due to human manipulations of floristic cover, composition, and diversity declined [71]. Similar results were reported in Libya by Zatout where Shannon-Wiener and another diversity index were correlated negatively by overgrazing, fire, and agricultural practices [72]. Over-collection and urbanization negatively affect the Shannon–Wiener index [7, 73]. Factors like roads, construction, and urbanization, as well as agricultural practices, have led to reduced floristic diversity [74].
Unprotected sites, on the other hand, experienced a decline in diversity due to various anthropic factors, including military activities, overhunting, solid waste, tourism, and invasive species. A significant decrease in species richness and diversity is also due to the exotic species and plastic waste [75] uncontrolled tourism, military activities, and overhunting [76]. Pollution, military operation, and tourism in the Himalayas contributed to the decline of biodiversity [77].
Protected sites are fenced and have minimal or no anthropic pressure, which aided increased floristic diversity of the Biodiversity Park except tourism, solid waste, and over-collection. Protected areas have more visitors annually, which may contribute to solid waste [78]. Protected areas reduce the anthropogenic pressure that raises the diversity of plant vegetation [79]. Fenced sites have the lowest anthropogenic pressure; in this scenario, the region has the lowest pressure on the plant diversity [80].
The results of the current study indicate that the soil of the unprotected site was essentially nutrient poor which caused the decline in the floristic diversity and its indexes. Clayey compact patches and sandy barren land lead to soil erosion, water erosion, and nutrient loss (calcium, nitrogen, phosphorus, potassium) which were further intensified by human activities. Nutrient poor soil with low pH and low fertility affects the Shannon index of an area [81]. Floristic diversity, evenness, and richness were reduced significantly in correlation to the reduction of soil pH, carbon, nitrogen, and nutrient content [82]. Clayey soil makes forest patches in rangeland [83]. This study also indicated that unprotected soil has also lower pH, organic matter, and soil moisture that resulted in a decline in diversity indexes and a low germination rate. Other studies of sporadic germination indicate that plant growth was affected by soil moisture, nutrient availability, and soil temperature [84]. Soil characteristics like soil moisture and pH value are responsible for the characteristics of the plant community at each slope gradient level [85]. Protected sites in this study showed relatively favorable soil characteristics (pH, organic matter, soil moisture, calcium, nitrogen, phosphorus, potassium, and sodium contents) as compared to the unprotected sites that favored the diversity of Biodiversity Park. Soil nutrients are strongly correlated to vegetation properties [86]. Soil nutrients have a great influence on plant diversity indexes [87].
The mean monthly climatic data of this study for four years showed that protected and unprotected site had similar patterns of rainfall, humidity, temperature, wind speed, and evaporation. Protected and unprotected areas experience similar climatic conditions [58]. The current study also explained that environmental conditions and human disturbances intensify the vulnerability of unprotected site as the protected site has water sprinklers to be used during the prolonged drought period and no human impacts. Climatic conditions (hot and dry) and human interferences are rapidly intensifying the susceptibility [88]. The presence of fencing has contributed to increased vegetation and biomass at the protected site, with minimal seasonal effects [89].
Highest precipitation, temperature, wind speed, evaporation rate, and relative humidity were observed during the fall season as compared to spring at both protected and unprotected sites during this study. This aligns with the findings of another study, which reported that the fall season typically experiences more rainfall, higher temperatures, increased evaporation rates [90], stronger wind speeds, dust storms [91], and higher relative humidity [70]. More floristic diversity was observed during the monsoon season and is correlated with the highest precipitation rate. Another study also reported that 40-60% increase in rainfall also increased species richness and species diversity as more precipitation is favorable for the growth of the grasses that convert desert shrubland into grassland [92]. The findings of study of Ebrahimi-Khusfi also support our results that wind speed, air temperature, humidity and precipitation has strong linkage with growing seasons in the arid environments [93].
Conclusions
Form present study, its it can be inferred that seasons have significant influence on edaphic factors and floristic diversity of both protected and unprotected sites of Cholistan Desert, even then protected site showed better floristic diversity as compared to unprotected site due to fencing. Increase in the species diversity of protected sites was witnessed during fall season which declined subsequently in spring due to slow growth rate and many other climatic factors. However, decline in diversity of unprotected sites was recorded in fall seasons due to anthropogenic factors specially overgrazing, nutrient poor soil which were further intensified by the harsh climate but when spring season approached it resulted increase in diversity due to nutrient regeneration from fallen plants parts, decaying roots, organic manure from animals grazing, good environmental conditions and regeneration strategy of plants. Furthermore, desert habitats are sensitive to disturbance and have slower rate of natural recovery, for this reason their management is the dire need of this era to reduce the impacts of man induced threats. It is advisable to prioritize the conservation measures of species exhibiting lower IVI values while the species with higher IVIs need seasonal monitoring of soil physico-chemical characteristics, human pressure and climatic influence at both selected sites. These findings can prove valuable in detecting floral changes, establishing the priorities for habitat protection and enhancing initiatives for conserving natural landscapes.

