


Introduction
The increase in population and urbanization and the issuance of government policies to encourage regional economic development have impacted landscape changes, including cities on small islands. The significant changes in land use and cover are a complex problem currently faced by small islands, such as Sabang City. Sabang City, located at the westernmost tip of Indonesia in Aceh Province, is a small island city within the outermost islands as per Presidential Decree No. 6, 2017. It covers an area of 122.13 km2, according to Regional Regulation No. 6 of 2012 on Spatial Planning & Zoning. Sabang City is made up of several islands, including Weh, Klah, Rubiah, Seulako, and Rondo, with only Weh Island being inhabited. Additionally, Sabang has been designated as a Center of Regional Activity and a Center of National Strategic Activity within the National Urban System. Sabang and its surrounding area are part of the Weh National Strategic Tourism Area, known as a unique natural tourist destination where both the sea and land can be enjoyed on one small island (Government Regulation No. 50, 2011). It also serves as the zero (0) kilometer point of Indonesia.
This policy aims to make Sabang City a potentially rapidly growing urban area, which consequently affects the landscape changes in the area, impacts the ecosystem of the small islands, and requires serious environmental support [1]. The rise in population, including both local residents and migrants, along with the growing influx of tourists to Sabang, has created a higher demand for housing and food supplies. The rapid development to accommodate the increasing needs of tourism and culinary requirements will inevitably present various issues, opportunities, and challenges in LULC [2].
Changes in LULC are indirectly influenced by several regional conditions, such as infrastructure, activity centers, land cover conditions, increasing carbon stocks, and geographical conditions [3]. The density and frequency of urban heat islands are intricately linked to variations in land use, land cover, and surface temperature [4]. One of the variables most significantly affected by this change is the decline in the area of existing forest land due to urban development and other land-clearing activities. Information on changes in land use and studies on land cover change (landscape dynamics) are highly useful for local governments and urban planners in improving plans for sustainable city development [5]. The analysis of spatial changes in land use patterns plays a crucial role in the success of physical planning processes and coastal area protection [6]. Monitoring changes in LULC is crucial in enhancing understanding and assessment of the extent, dimensions, consequences, and causes of LULC changes.
In this term, geospatial technology and remote sensing methodology are crucial for analyzing LULC change detection [7]. Remote sensing (RS) is used to detect changes in the impact of reservoirs on LULC change using supervised classification with a maximum probability algorithm to produce thematic maps [8, 9]. The Geographic Information System (GIS) expedites the process of urban growth analysis, while remote sensing methods are used to acquire current maps of land cover information [10-12]. This technology has been effectively used in various applications, including land cover monitoring, due to its ability to provide information about the spatial diversity on the Earth’s surface quickly, extensively, accurately, and easily [13- 15].
The integration of CA-Markov can simulate the spatiotemporal dynamics of LULC change. The model validation process involved an accuracy assessment of the prediction and contrast made between the predicted and observed LULC maps. Therefore, to evaluate the change drivers of the past and simulate the future, we utilized the validated data [16].
Sustainable urban growth is essential for future generations to meet their needs by implementing appropriate and strategic urban policies [17]. Therefore, sustainable development cannot be separated from LULC and the potential resources available for sustainable development (SDGs). Sustainable development is a response to urban challenges such as globalization, decentralization, and rapid population growth [18]. The most important elements in a sustainable development strategy are to focus on public participation, capacity building, education improvement, partnerships, and job creation to achieve urban sustainability [19].
The objective of this study is to examine the patterns of urban expansion caused by changes in LULC from 2013 to 2021 in Sabang City. Furthermore, it seeks to forecast alterations in LULC through spatial development scenario planning for the periods of 2021- 2032 and 2032-2042
Material and Methods
Study Area
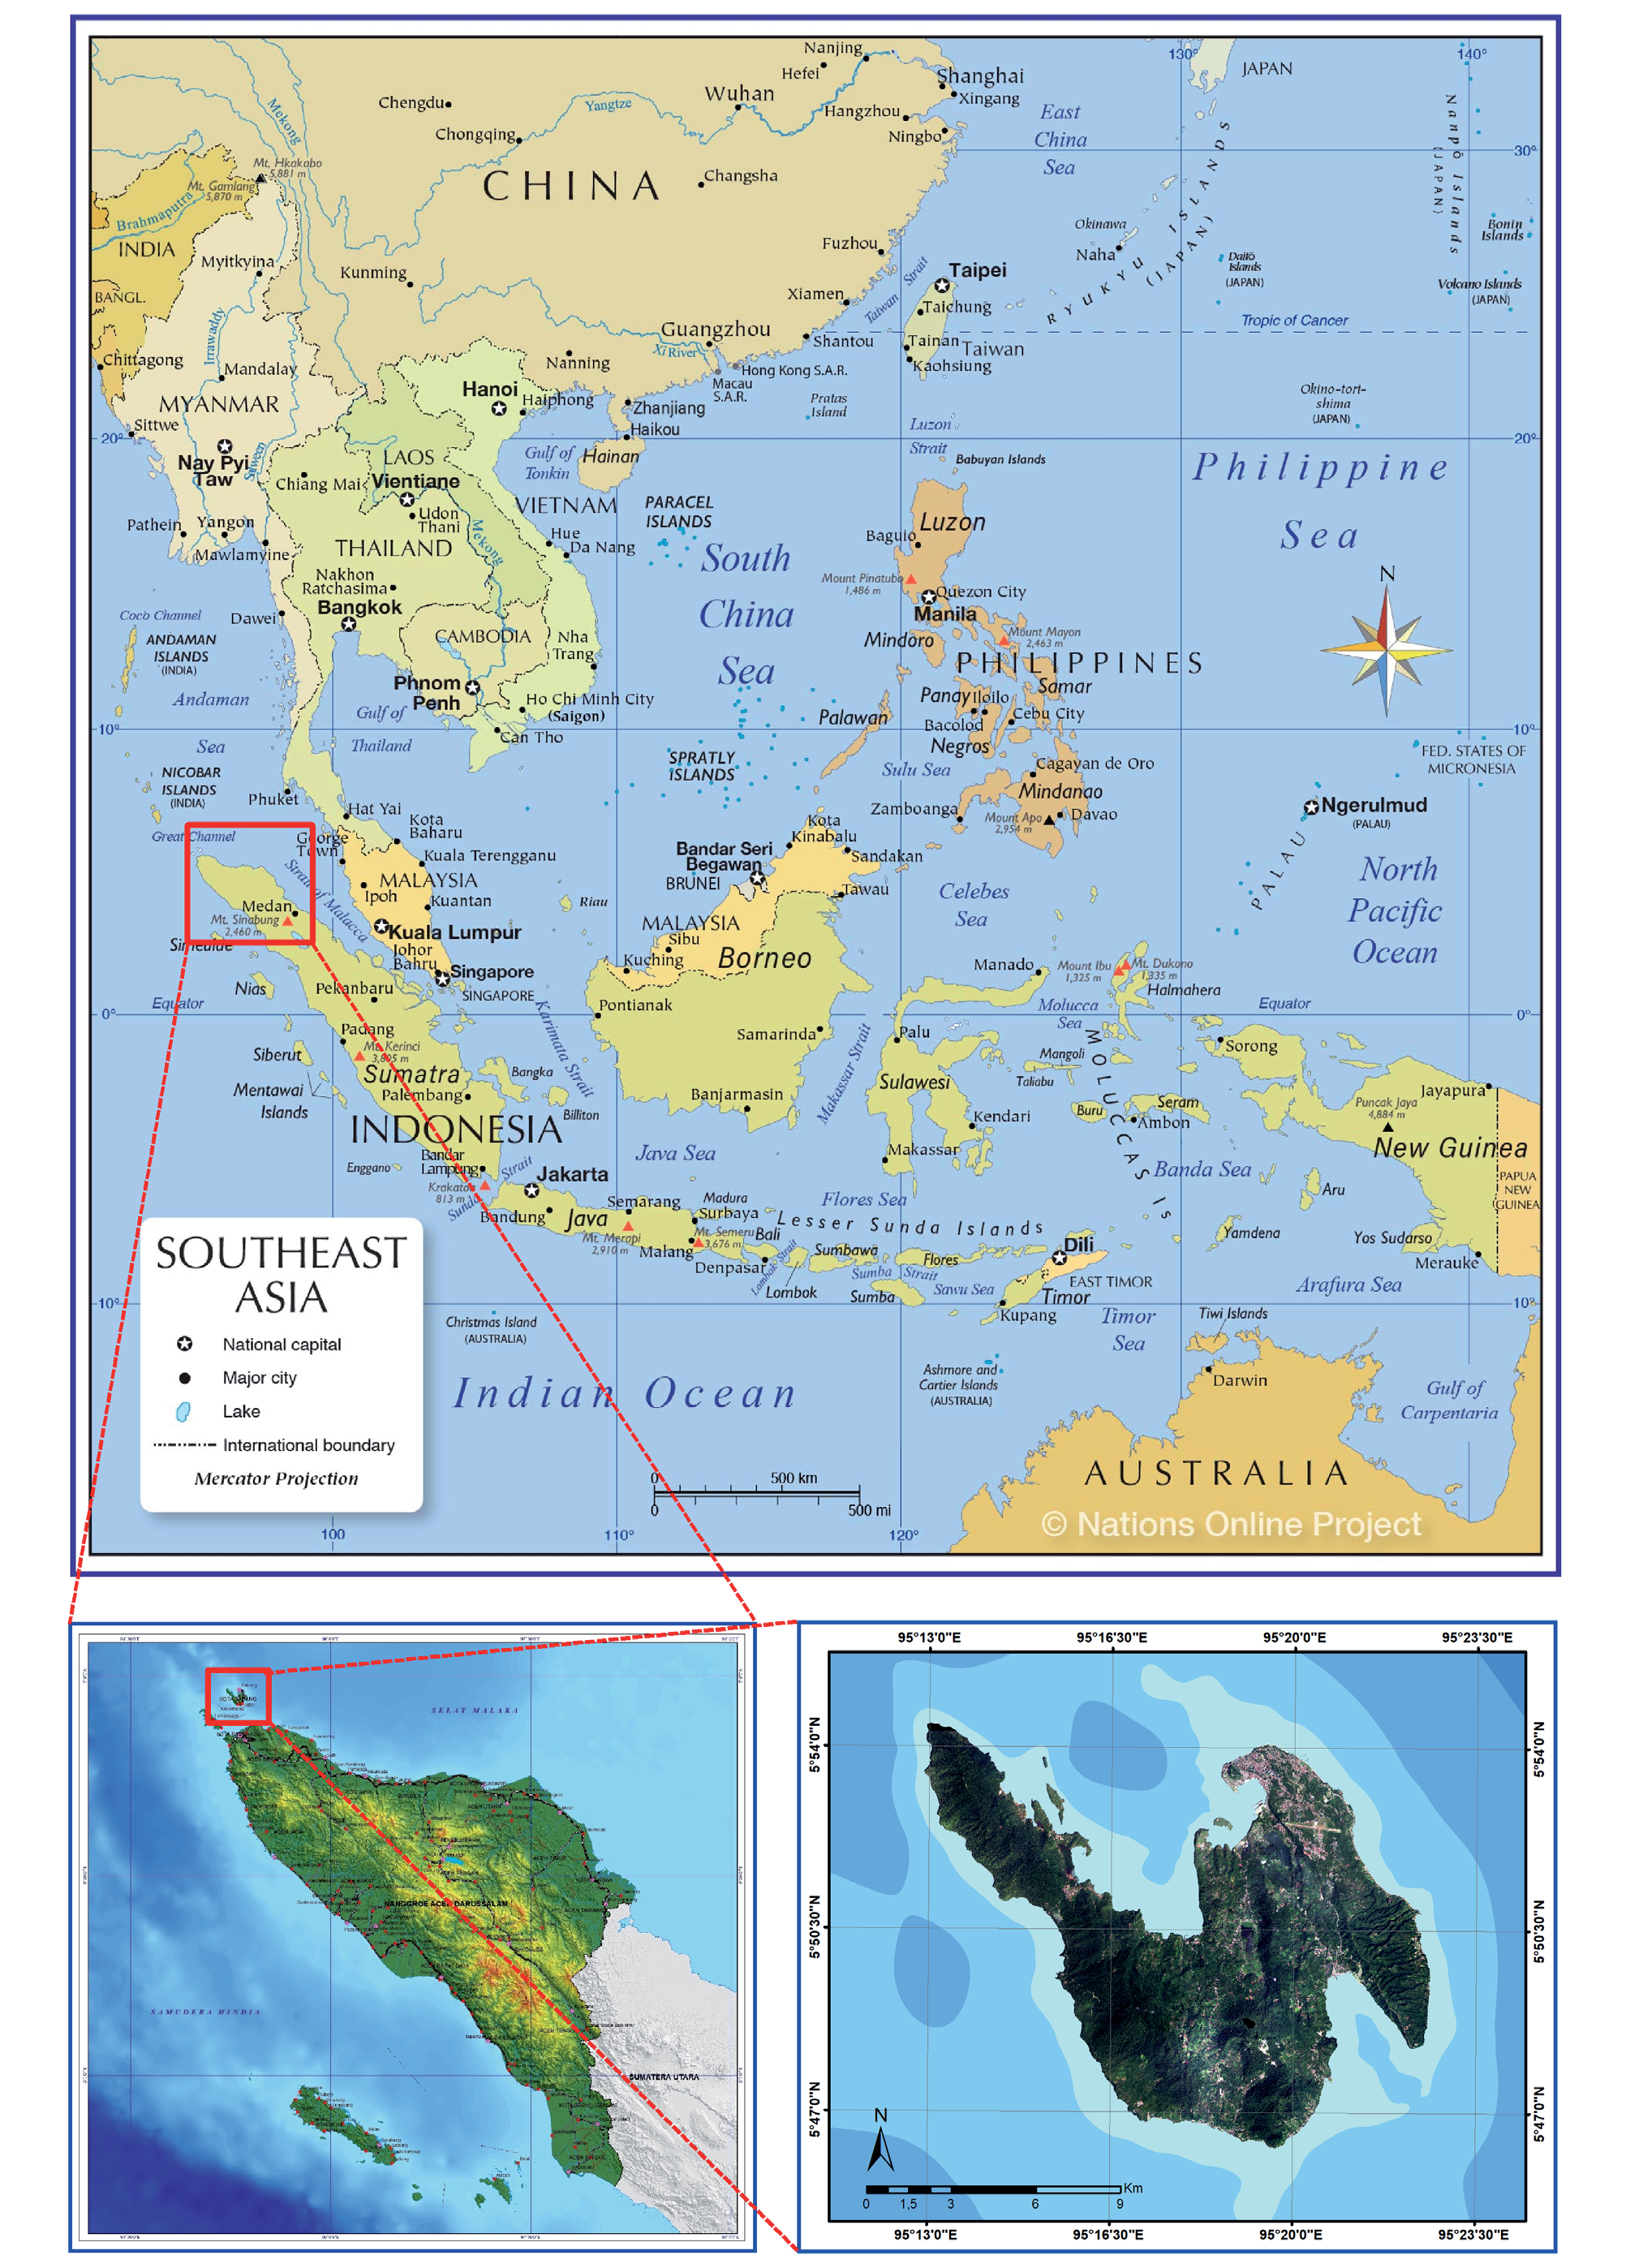
The study location is in Sabang City, Aceh Province, Indonesia, which is located on the line of 05°46’28”N-05°54’28”N and 95°13’02”E-95°22’36”E. Sabang City is a region of small islands in Indonesia (Fig 1), bordering the Indian Ocean. It has an area of 12,084.45 ha and is situated at an elevation of approximately 28 meters above sea level (asl) [20].
The majority of the area in Sabang City is mountainous, making up about 48.17% of the total area. The city also includes flat land (1.01%), low-lying areas (5.02%), undulating plains (31.70%), and steep terrain (14.10%). The slope inclination varies, with the western and central parts of Weh Island being hilly and undulating, with slopes steeper than 15%. The population of Sabang City, located only on Weh Island, was 32,191 people in 2013 and increased to 43,391 people in 2020 (BPS Sabang City).
Data Collection
This research utilized data obtained from the National Research and Innovation Agency (BRIN) in August 2022, in the form of SPOT-6 satellite image maps from 2013. SPOT-6 is an optical remote sensing satellite capable of providing images with a resolution of up to 1.5 meters for panchromatic and 6 meters for multispectral imagery. The satellite imagery for 2021 utilized a combined SPOT image map from both SPOT-6 and SPOT-7, which is a satellite constellation in conjunction with SPOT-6. In this study, five driving factors were used: distance to roads, distance to city centers, distance to strategic urban areas, distance to tourist areas, and slope condition. These factors were derived from the Spatial Planning and Development Plan of Sabang City.
An accuracy assessment was carried out to determine the accuracy of the interpreted classification results by comparing them with actual ground-truth data. It is important to exercise caution when interpreting and using classification accuracy assessments, as they may not always accurately reflect the properties of the map [21]. Model validation was conducted to assess the accuracy of the predicted LULC map [22]. One commonly used method is the statistical Kappa method, which is calculated from the contingency table between two sets of data. The Kappa statistic is frequently used to evaluate the agreement between observed and predicted results [23-25].
Real-world conditions were verified using Google Earth imagery and direct field observations at approximately twenty-one randomly selected points. The verification process using Google Earth included analyzing historical high-resolution imagery obtained from Google Earth Pro 7.3.1.4507, which was acquired in June 2013 and August 2021. The stratified random sampling technique was used to identify verification points scattered across each land cover change category based on their density [26]. This was accomplished by utilizing the “create accuracy assessment point” feature within ArcGIS 10.8.
Image pre-processing is essential for minimizing errors and improving data accuracy. In 2021, the image data was merged using the Arc Toolbox Mosaic in ArcGIS 10.8. The resulting mosaic was then clipped using the administrative boundaries of Sabang City. Data processing for image classification utilized the extraction concept, employing the select and clip methods within the administrative boundaries. Subsequently, the images underwent supervised classification using the Maximum Likelihood Classification (MLC) algorithm within ArcGIS 10.8. The classification process sorted the images into six distinct classes: woodland, built-up area, water body, agricultural land, grassland, and bareland [27]. The MLC algorithm necessitates the collection of training samples using the stratified random sampling method.
Analysis of LULC Change Patterns
This study examines changes in LULC between 2013 and 2021. The analysis utilized overlay techniques in ArcGIS 10.8, including clip, union, dissolve, reclassify, and intersect, to detect changes in LULC. Calculations to determine the extent of land use changes were performed using the calculate geometry menu in ArcMap 10.8. A gains and losses analysis was conducted using the Land Change Modeler (LCM) simulation model in IDRISI TerrSet to provide an overview of land change transitions in Sabang City. Additionally, the Landscape Expansion Index (LEI) method, based on patches [28, 29] was used to quantitatively identify the pattern of built-up area growth. This method addresses the shortcomings of previous studies on landscape expansion indices by incorporating graph theory and spatial topological relationships. The LEI tools were downloaded from https://www.geosimulation.cn/LEI.html to determine and calculate the LEI for new patches by examining the characteristics of their supporting zones.
where: LEI: Landscape Expansion Index; Ao: Intersection between the buffer zone of the new built-up area and the occupied category; Av: Intersection between the buffer zone of the new built-up area and vacant land.
Prediction of LULC Change
Modeling is a valuable method for comprehending and predicting future trends in land use change [30]. The Land Change Modeler (LCM) is a modeling tool used to forecast land use. The CA-Markov model, utilized in LCM modeling, predicts changes in land use over a specific time period. The CA-Markov model is rooted in Cellular Automata (CA), a computational tool for forecasting dynamic systems that evolve based on neighboring cells. CA-Markov modeling generates a transition matrix or probability area matrix, indicating the probability of land use change from the previous year to the selected year [31]. The diagram below illustrates the relationship between these three matrices:
where; MLC: Probability; Mt+1: Probability at time t+1; Mt: Probability at time-t; Ut represents the proportion of the probability of each classified point as class U at time t; and LCua indicates the probability of a class U transitioning to another class within a specific period.
The changes in LULC between 2013 and 2021 are being used as a variable to predict LULC in 2032.. The input data includes the land use transition matrix for the years 2013-2021, which is assumed to be unaffected by other factors influencing LULC change.
Validation is essential to verify the accuracy of the generated prediction data and assess its reliability. The data is validated by comparing the predicted map with the existing map using overlay methods and the Kappa index. The validation test is measured using the Kappa Index of Agreement (Kappa value) [32] as follows:
Where: k: Kappa Value; xii: Type area of land use-i from simulation corresponding to the area of land use type-i from observation; xi+: Type area of land use-i from simulation; x+i: Type area of land use-i from observation; N: Total types of all land use areas; z: Number of types of land use.
The result of the Kappa value determines whether the simulation is categorized as accurate, good, or not good in terms of both area and spatial distribution. If it is deemed accurate, the LULC modeling for predicting land use in 2032 can proceed.
Urban Growth Scenarios
The main assumptions based on predictions are growth scenarios. Even with geographical data, it is possible to simulate different urban growth processes using various growth scenarios. Implicit or explicit methods to convey growth scenarios include policy restrictions, growth regulations, growth rates, and urban population siz.
Logistic regression analysis is conducted to uncover the relationship between urban growth, socio-economic drivers, and biophysical factors [33]. Generally, the logistic regression equation for this research follows a model described below [34, 35]:
Where: z is the probability of urban growth; b0 is the intercept; b1….bn are the coefficients of the independent variables (x1…..xn); x1…..xn are independent variables (x1…..xn).
By using logistic regression analysis, the logit function can be expressed as:
where:
where: ln represents the natural logarithm with a constant value of 2.72 (approximately); p is the logistic probability; exp or denoted by the symbol symbol “e,” is the exponential function, which is the inverse of the natural logarithm.
The prediction of future land cover changes is developed into two scenarios (Fig 2) to serve as a comparison of trends for the development of Sabang City. The land cover change transition sub-model (Table 1), derived from prior analysis, is subjected to logistic regression calculations to ascertain potential transitions influenced by driving factors for each type of land cover change. The CA-Markov then uses these potential transitions to predict areas that will undergo growth in 2032 and 2042. This illustrates that Cellular Automata operates based on the interactions of neighboring cells, with specific cells growing either presently or in the future [36].
Results and Discussion
Results of the Classification Accuracy Assessment
Based on the results of image interpretation, an overall accuracy of 93% was achieved in 2013 and 94% in 2021. The Kappa coefficient values, which ranged from 0.81 to 1.00, indicate excellent agreement, placing the satellite image interpretation in the “very good” category [37]. The classified map is suitable for further land use analysis. Additionally, validation testing results were corroborated by field observations conducted at randomly selected sample points..
LULC Changes in Sabang City in 2013 and 2021
The analysis of LULC transitions provides insight into the LULC change. Table 1 illustrates the transitions in land use/land cover from 2013 to 2021. The most significant transition occurred as forested areas were converted to agricultural land, encompassing 567 hectares. The second largest transition involved the conversion of agricultural land to grassland (509.92 ha), followed by transitions from grassland to agricultural land (463.27 ha) and from forest to grassland (276.61 ha). Additionally, the largest transition to built-up area was from open land, totaling 139.74 ha, ranking as the fifth largest transition. These transitions have resulted in both the expansion and reduction of various LULC categories.
The most significant change in land type was woodland, which decreased by 7%, followed by a 3% increase in agricultural land. In comparison to the preceding time, built-up area and grassland both expanded by 2%, while bareland declined by 1%. There were no alterations in the water body. In 2013, non-built-up areas accounted for 98% of Sabang City’s total area. However, by 2021, it had decreased to 96% due to population growth and economic development, resulting in physical changes in the city. This suggests that non-built-up areas have the potential for urban growth since they are huge and can be used for housing and other urban services.
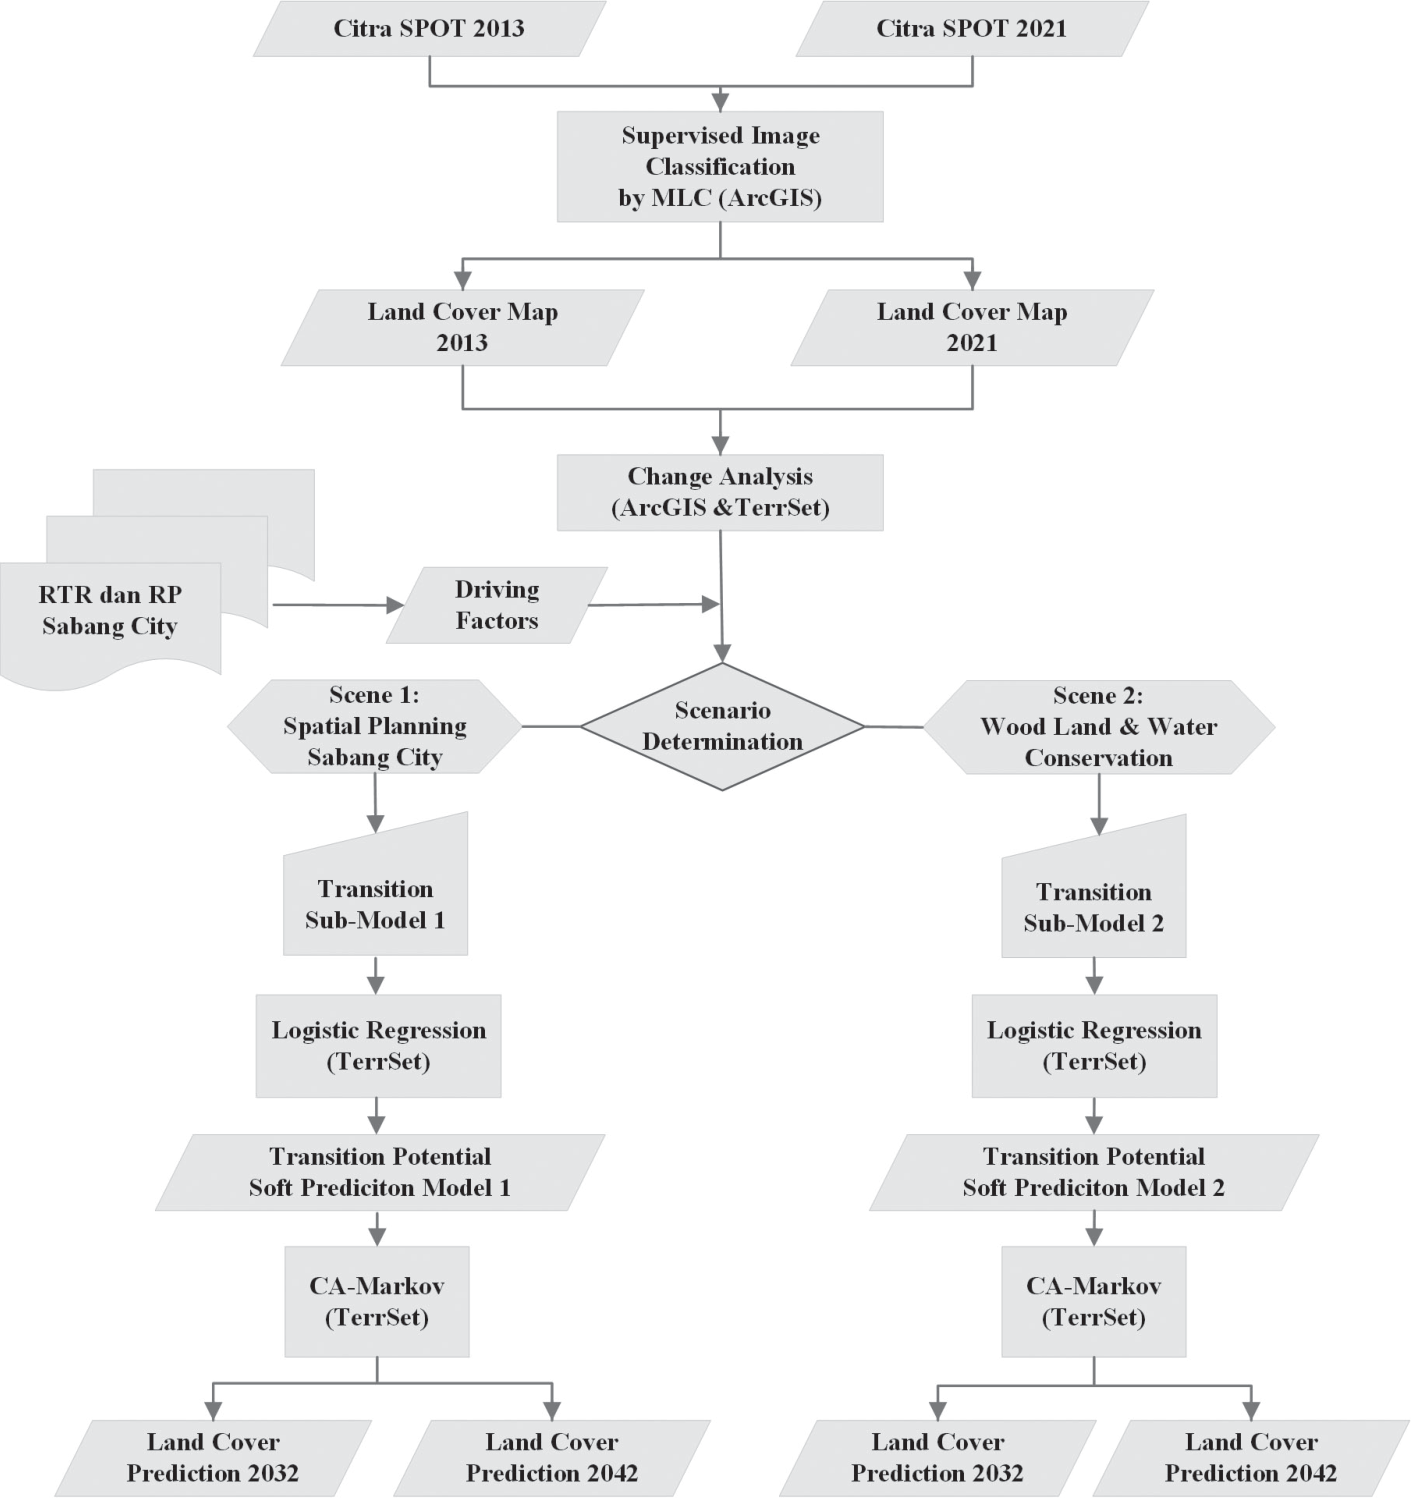
Table 1.
Transition LULC in Sabang City in 2013-2021.
In 2013, the LULC in Sabang City was dominated by woodland and agricultural land, in line with the Sabang City Spatial Plan 2012-2033. Built-up areas were limited to specific urban service centers, with significant areas of agricultural land and grassland still present. However, by 2021, built-up development had intensified in certain areas, particularly around Maimun Saleh Airport and in central neighborhoods. Urban development also expanded in tourist areas and along main roads.
These changes indicate a shift in land use, with concentrated development in urban areas due to the presence of only one urban service center. Additionally, good access to Banda Aceh through Ulee Lheue Port has influenced development in the Balohan area, accelerating urban land growth in the center of economic activity [38]. However, the urban center has not shown rapid growth, resulting in a non-significant increase in built-up area.
LULC changes are also influenced by the substantial population growth in the city [39]. The population of Sabang City has risen from 32,191 individuals in 2013 to 42,066 individuals in 2021. Population growth has also risen from 1.36% in 2013 to 2.82% in 2021. At the same time, population density has increased from 264 individuals per km2 in 2013 to 344 individuals per km2 in 2021.
The slow expansion of the built-up area in Sabang City can be attributed to the city’s physical features, which are primarily characterized by land with a 40% slope, consisting of tropical woodland designated as protected areas and tourist attractions. According to the Spatial Plan, Sabang City has substantial woodland potential, including 3,400 ha of protected woodland, 1,300 ha of tourist woodland, 2,600 ha of marine park, and 1,700 ha of reserve woodland.
Built-up Area Expansion Pattern in Sabang City in 2013 and 2021
In Table 2, the dominant growth pattern is the expansion pattern, which occurs in areas surrounding previously built-up area. This expansion pattern accounts for 175 ha or 67.04% of the total growing built-up area, following the path along the road. The development of built-up area in the city center is predominantly characterized by infilling, with 44 ha (16.9%), meaning that new built-up areas are available spaces surrounded by previously built-up areas. The outlying pattern covers 42 ha (16.06%) and generally occurs in a scattered manner, but predominantly in newly developing residential growth areas, far from the existing built-up areas or growth centers in Sabang City.
The rapid urban expansion is leading to the loss of agricultural land, particularly near roads, as the expansion and development patterns are not aligned with the planned built-up area. This highlights an unstable relationship between urban planning and urban growth patterns. Urban growth is gradually expanding and diverging from established land use planning documents [40]. Urban growth expansion in Sabang City is accelerating the loss of agricultural land due to the increase in built-up area. However, the growth of the built-up area is not as significant as the loss of agricultural land.
Landscape Changes Prediction in Sabang City for 2021-2032
The largest increase in landscape growth is seen in agricultural land (Table 3), which covers 401.64 ha, up from 3,510.61 ha in 2021 (a 6.1% increase). This is followed by a 288.25 ha (4.1%) increase in built-up area and a 144.59 ha (3.15%) increase in grassland. The largest decreases are observed in woodland, with a reduction of -814.79 ha (-13.74% from 2021), bareland with -0.56 ha (-0.72%), and a shrinkage of -17.93 ha (-0.12%) in water bodies.
Tourism is a vital component of Sabang City’s appeal as a distinctive and alluring destination in Aceh. Klah Island, in particular, has been identified as a promising area for development, boasting a high value based on spatial analysis and assessment of natural attraction areas (ADO-ODTWA). However, the predicted LULC map of Klah Island indicates a noticeable increase in built-up area, albeit relatively small in size. Despite regulations aimed at protecting the island’s natural areas, they have not been entirely successful in curbing the growth of tourism [41].
When making predictions about LULC, it is crucial to take into account the decrease in the size of water bodies, particularly the shrinking of Lake Aneuk Laot, which has transformed into open land. Research has shown a noticeable reduction in the area of water bodies from 2001 to 2017 [42]. This phenomenon warrants further investigation as it is a significant occurrence in the area.
Scenario 1: Based on the Regional Spatial Planning of Sabang City 2021-2032
The accuracy test for Scenario 1’s logistic regression was conducted using the ROC with range values between 0.5 and 1.0.[43, 44]. Table 4 displays the five independent variables and their corresponding Adjusted Odds Ratios for Scenario 1. The results of the tests met the specified criteria of 0.7-0.8, indicating that all variables are significant in influencing land use and cover changes.The accuracy test for logistic regression in Scenario 2 showed an average ROC value of 0.7 for three variables (Table 5). The ROC Value and Adjusted Odds Ratios for Scenario 2 indicate that all variables significantly influence LULC changes. The analysis produced a potential transition map (soft model) for LULC changes, with the main output being a predicted LULC map for the years 2032-2042 [45, 46].
Scenario 2: Woodland and Water Body Conservation
The accuracy test for logistic regression in Scenario 2 showed an average ROC value of 0.7 for three variables (see Table 5). The ROC Value and Adjusted Odds Ratios for Scenario 2 indicate that all variables significantly influence LULC changes. The analysis produced a potential transition map (soft model) for LULC changes, with the primary output being a predicted LULC map for the years 2032-2042.
Table 2.
Built-up Growth Pattern Area in Sabang City in 2013- 2021.
| Type of Pattern | Land Area | Percentage |
|---|---|---|
| Expansion | 175,8323 | 67,04 |
| Infilling | 44,3278 | 16,90 |
| Outlying | 42,1299 | 16,06 |
| Total | 262,2901 | 100,00 |
Table 3.
Prediction of LULC Classification in Sabang City in 2032.
Water management in the region will always be a critical concern for all decision-makers to ensure a fair resolution of complex water issues. Any solution must strive to be part of a broader and more integrated regional strategic plan that can fulfill the main objectives and targets according to the needs of the island [47, 48]. It is crucial to implement this scenario in order to preserve the sustainability of water bodies, which are the source of life for all living beings. Erratic weather changes and increasing temperatures are putting the existence of water bodies at risk, which in turn threatens the survival of ecosystems. Conserving water bodies will also help to reduce urban flooding during periods of heavy rainfall. The ultimate goal of this scenario is to make the city environmentally friendly for all ecosystems in the future [49]. Developing a baseline for urban tree cover and land cover mapping is an important first step in urban forest planning and monitoring. It is essential to inventory large, old trees that hold cultural significance. Evaluating the urban environment is crucial to addressing challenges such as urban flooding and disparities in access to green space. Improving forest management is essential to addressing the effects of climate change, such as the urban heat island effect [50].
Implications for Spatial Sustainable Development
The trends in LULC changes for 2032 and 2042 are depicted in each scenario, as shown in Fig. 3. The distribution of built-up area in each projected year serves as evidence of these changes. These differences are driven by the potential transition of land changes outlined in the transition model. In Scenario 1, there is a push for the organic expansion of built-up areas in accordance with the Regional Spatial Plan, which includes the conversion of woodland and water body areas. Conversely, Scenario 2 prohibits the conversion of woodland and water body areas into built-up areas.
In Scenario 1, the woodland decreased by approximately 53.15 ha, which is significantly larger than the decrease in Scenario 2. Additionally, the built-up area increased by around 65.54 ha in Scenario 1, which was also larger than the increase in Scenario 2. The reduction in water body in Scenario 1 was 12 ha, while it was nearly negligible in Scenario 2. Agriculture land and grassland both experienced the same decrease in all scenarios. Bareland was the only area that did not undergo significant changes across all six LULC categories in all scenarios.
Hence, development land use on small islands must be limited. Unchecked and rapid conversion of land into built-up areas will increase the vulnerability of small island communities [51]. Regulations governing spatial utilization and environmentally supportive development are essential for promoting sustainable development in the small islands of Sabang City. The lack of zoning plans and strategic land use plans has led to unstructured and unplanned usage patterns that do not adhere to the principles of sustainability [52]. A city should aim to create a healthy environment, vibrant green spaces, and a well-planned urban layout through systematic planning that prioritizes both functionality and aesthetics. Achieving these goals is possible through the development and implementation of a comprehensive urban design concept. [53].
Table 4.
ROC Value and Adjusted Odds Ratios for Scenario 1.
Table 5.
ROC Value and Adjusted Odds Ratios for Scenario 2.
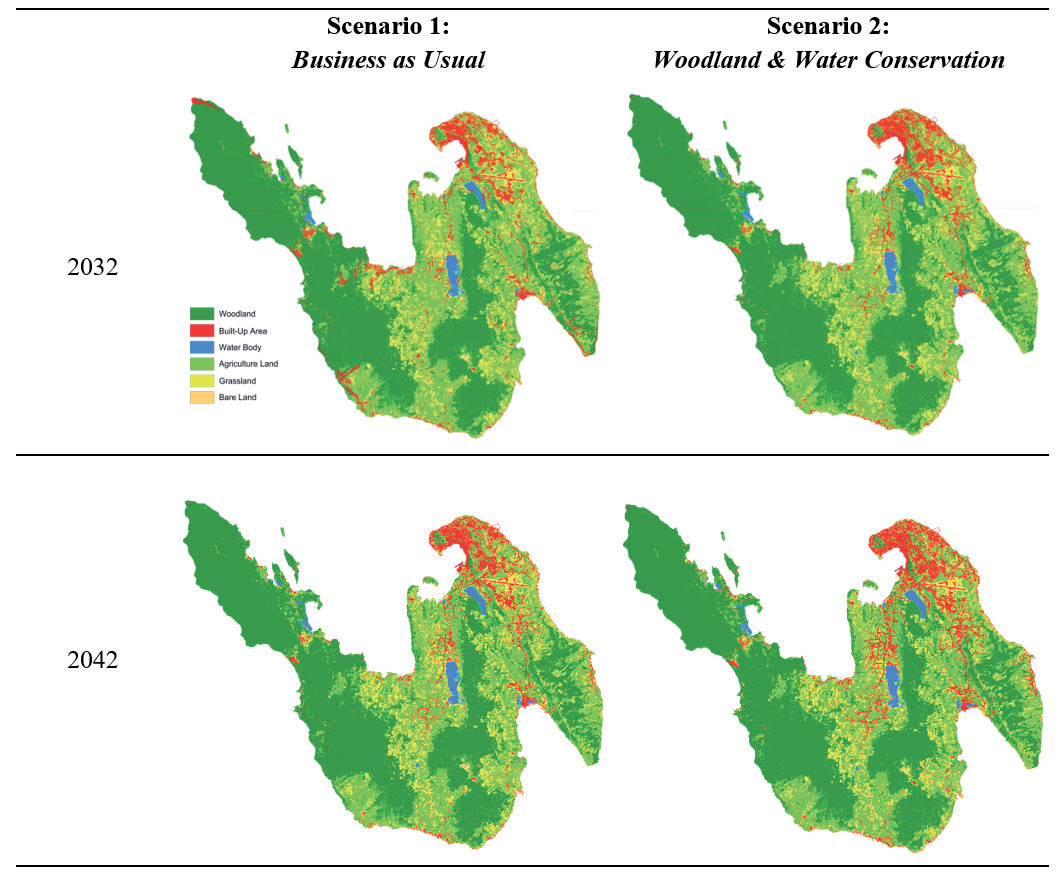
Table 6.
Comparison of LULC Area Predictions in Sabang City (Scenario 1 and Scenario 2).
Conclusion
This study aimed to comprehensively understand the changes in LULC, as well as the urban growth patterns, that occurred from 2013 to 2021 and to predict LULC patterns until 2042. An integrated approach, including RS, GIS, and Land Change Modeler (LCM) modeling, was applied through the CA-Markov model to understand the spatiotemporal dynamics of LULC and predict future LULC changes in Sabang City, Aceh Province, Indonesia. The growth pattern of the built-up area (urban) was quantitatively identified using the Landscape Expansion Index (LEI) method based on patches. Over the span of eight years, there has been a reduction in forest area by 777 ha (11%). This forest land has been converted into agricultural and plantation land, covering an area of 755 ha. Additionally, built-up area has increased by 256 ha within the same period. It is crucial to implement control measures in land clearing for the production of forests or other uses.
The urban growth pattern in Sabang City from 2013 to 2021 shows that the expansion of the built-up area is primarily driven by the conversion of undeveloped land around the city center. The growth follows an expansion pattern of 67%, an infilling pattern of 1%, and an outlying pattern of 16%. Expansion typically begins in the existing built-up area along the roads. In contrast, the city center experiences growth through infilling, particularly in the central area and around the Balohan Port. The outlying pattern is spread throughout the Sabang area. The increase in built-up area is influenced by tourism development, port expansion, and bungalow construction. Similarly, the northern coastal area of Weh Island has also seen an increase in built-up area, although it remains relatively low.
The study predicted the urban growth patterns of Sabang City for the 2032 and 2042 periods using two scenarios. Scenario 1, based on the Regional Spatial Planning and Development Plans of Sabang City, allows for the expansion of areas converted from forests and water bodies, leading to decentralized growth and rapid development in tourist areas. This is evident in the distribution of building areas in each predicted year. Scenario 2, based on Forest and Water Conservation, prohibits the conversion of LULC from forests and water bodies into built-up areas. This scenario follows the principle of compact cities, with building area growth focused on the city center and sub-city centers, following the road network structure. These differences are influenced by potential land change transitions defined in the transition model.
After analyzing scenarios 1 and 2, it is clear that the urban growth pattern is more in line with scenario 2. This scenario prioritizes land conservation for forests and water bodies, which helps to preserve the highest carbon reserves from land cover changes. The future urban growth pattern can be predicted by considering sustainable city spatial planning scenarios. It is important to minimize the negative effects of LULC changes on small island ecosystem services by implementing climate-resilient green economic strategies and developing policies for sustainable development. Future research should integrate assessments of land use impact and land cover changes with enhanced ecosystem service parameters.

