

Introduction
The ground waters represent in Slovakia the dominant source for supplying the population with drinking water. Only 16% of the total amount of the water supplied into the public water mains is present the waters retrieved from the surface sources. Based on the quality of the water that is taken, it is necessary in many cases to treat the water so that way it meets the requirements for the drinking water that are laid out inby the Decree of the Ministry of Health of the Slovak Republic No. 91/2023. When it comes to the ground waters, only 22% requires to be treatmented – which, from the total amount, represents approximately 7700 L/s of these waters used for drinking purposes. That actually points on a great quality of the ground waters. Whole amount of water that is taken from surface water sources is treated and it represents 1400 L/s approx.
Fig. 1.
Map of Slovakia with markings of the protected water management area, the river basins of significant watercourses and water supply reservoir.
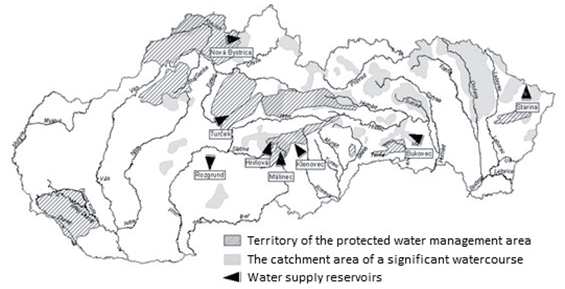
In the present day, in Slovakia, there are 113 water treatment plants (WTP) in operation, and these are used to provide treatment to both surface and ground water to provide safe drinking water. 65 WTPs operate for the treatment of surface waters and 48 WTPs for the treatment of ground waters. Eight of these surface water reservoirs in Slovakia (Rozgrund, Turček, Hriňová, Klenovec, Málinec, Nová Bystrica, Bukovec, and Stariná) are put to use as water sources to supply the population (Fig. 1).
Some of the WTPs are facing problems related to the treatment in certain seasons of the year, which leads to worsened water quality. Only based on thorough knowledge of the quality of the water in the reservoir might optimal and proper measures be taken to avoid the water quality getting worse. This requirement is enhanced by the latest published results of the monitoring of cyanobacteria in water supply reservoirs in Slovakia. In addition, water taken from surface sources contains fine, insoluble particles that become evident as turbidity, living microorganisms, and unwelcome dissolved solids that need to be removed from the water ahead of the entrance point to the supply network. Some of them need to be removed from an aesthetic point of view, and some represent a health risk. Drinking water suppliers need to ensure water quality, where water does not cause adverse consequences for human health, even in long-term consumption.
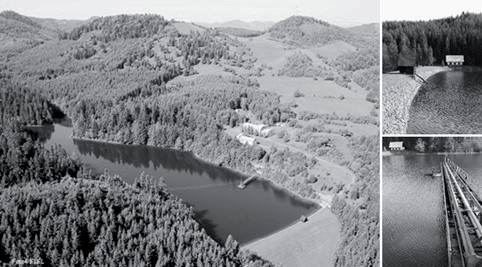
The Rozgrund water treatment plant was put into operation in 1997 to supply part of Banská Štiavnica with water. The eponymous water reservoir Rozgrund, built in 1743-1744, is the source of water for the water treatment plant; it has been in operation since 1789. The “tajch” (Rozgrund water reservoir) project was developed by Samuel Mikovíni in 1741. It has been used as a source of drinking water since the early 20th century due to the purity of its water (Fig. 2).
The Rozgrund water treatment plant (WTP) serves for treatment and repumping of the treated water into the Červená Studňa water storage (the water storage volume is 650 m3). The designed output of the water treatment plant is 14 L/s.
The water treatment technology was designed as single-stage and it consists of pumping water from the Rozgrund water reservoir, dosing an aluminum coagulant into the raw water pipeline but also into the treated water, slow mixing by means of 4 perforated walls, dosing calcium hydrate into the raw water pipeline but also into the treated water, 3 open sand filters, sanitary protection of the treated water by chlorine with the possibility for pre-chlorination, repumping of the treated water into the Červená Studňa water tank and accumulation of the used wash water.
In 2015, the water treatment plant was taken out of operation due to the stench of the drinking water in the distribution system. Until the water treatment plant was taken out of operation, the technological line functioned only on the direct filtration principle and sanitation of the water by dosing with chlorine gas. In the critical situation regarding the stench, the operator sought to treat the water by dosing the PAX-18 coagulant and powdered active carbon into the water. Subsequently, part of Banská Štiavnica was connected to the Hron Group Water Mains, entailing multiple repumpings of the water.
Currently, an effort is being made to utilize the surface water from the Rozgrund water reservoir again for supplying Banská Štiavnica, Banka, and Vyhne. The requirements for the modernization of the water treatment plants require the performance of pilot-plant tests.
From the long-term perspective, the water quality does not change very much; the water is of relatively high quality; without the impact of human activity, the pH of the water between 2012 and 2019 ranged from 6.95 to 8.25, and the water temperature from 2.8 to 24.1ºC. The water color on the long-term average did not exceed 20 mg/L Pt. The year 2013 was an exception, as in March and April, 69 and 26 mg/L Pt, respectively, were measured. The water turbidity ranges from 1.0 to 3.0 NTU; in 2013, the turbidity measured in March and April was 5.8 to 3.3 NTU. Chemical oxygen demand (CODMn) on the long-term average achieves 1.4 to 2.9 mg/L, but in one case the value achieved 3.56 mg/L. With regard to the aging of the reservoir and the eutrophication process, an increase in living organisms was determined from 150 to 400 organisms/mL. Living organisms predominate Cycllotela and Dinobryon; smaller amounts are represented by Ankistvoduz, Monoraph, Nitzsnia, Honea, Synedra, and Chlovella. Analyses of water quality for the years 2012 to 2019 were provided to us by a water company in Banská Bystrica.
There is currently an effort around the world to modernize and optimize water treatment. New equipment, new filters, or sorption materials are tested to, obtain the optimal suspension and its separation, choose a suitable coagulant, flocculant, water disinfectant, etc. Great attention is paid to this issue in the literature [1-8]. In the literature [9-14], conventional drinking water treatment is compared with new technologies. The aim of all experiments is to obtain quality and safe drinking water and to find technology that can cope with organic micropollutants, natural organic substances, the occurrence of cyanobacteria, living organisms, eutrophication, and changes in water quality due to climate change (torrential rain, fallen snow melting, extreme drought).
In accordance with Directive 2020/2184 on the quality of water intended for human consumption [15] and Directive 2000/60/EC establishing a framework for community action in the field of water policy [16], demanding measures must be taken in the water treatment process to modernize existing water treatment plants.
The aim of this study was to compare the efficiency of the different surface water treatments at the Rozgrund water reservoir. The pilot-plant tests in the WTP Rozgrund were focused on conventional water treatment with two different filter media by using coagulant polyaluminium chloride PAX-18, conventional water treatment complemented with filtration through granular activated carbon (GAC), pilot tests with ultrafiltration without coagulation, and pilot tests using the same procedure with ultrafiltration followed by filtration through GAC. The result of these experiments was to design the most suitable water treatment technology for the planned modernization of the Rozgrund WWTP.
Experimental
Quality of Surface Water from the Rozgrund Water Reservoir
Table 1 shows the physical-chemical analysis of water on entry to the water treatment plant during the pilot tests. The preparatory works and assembly of the individual technologies started in summer 2018; the pilot tests themselves were carried out from 8.9.2018 to 13.12.2018.
Table 1.
Water quality on entry to the Rozgrund water reservoir during the experiments.
Conventional Water Treatment
Pilot tests focused on the single-stage water treatment technology (only one separation step filtration is used) were based on the original technology at the Rozgrund water treatment plant. The performance of the pilot facility was approx. 0.3 L/s. The PAX-18 coagulant (0,75 mL/L) was dosed between two diaphragms, with the subsequent homogenization performed using a quick mixer. This was followed by slow mixing in three separate sections with mechanical mixing at mixing velocities of 60, 40, and 20 rotations per minute. Next, the water flowed gravitationally through a distribution object onto three plexiglass filters with a diameter of 300 mm and 2.7 m high. There were 10 horizons on each filter, with the measurement of the head loss (filtration resistance) in the given filter horizon. The total depth of filter media was 1.4 m, and the available space above the bed allowed the buildup of the head for a constant flow rate, regardless of filter plugging. The filter columns also allow the sampling of water in the filter bed. The columns were mounted on a steel support structure. The composition of the filter media was as follows: – filter F1: material Filtralite MonoMulti Fine with two
different grain sizes and specific weights (height of
medium 140 cm), – filter F2: two-material medium: 70 cm of new silica
filter sand (FP1) + 70 cm of Carboziar (calcined
anthracite).
Three filtration cycles were performed with a total duration of 108 hours. Comprehensive measurements of filtration cycles 1 and 2 were carried out. The third cycle was focused only on verifying the quality of the filtered water depending on the filtration period.
Filter F1 was filled with an expanded clay filtration medium denoted as Filtralite® Pure Mono-Multi Fine, a material produced in Norway. EnviPur supplied it for the pilot tests. It is produced by Saint-Gobain Byggevarer a.s. This is a filter medium consisting of two different grain sizes and specific weights. Table 2 shows the basic characteristics of the filtration material Filtralite® Pure Mono-Multi Fine. The chemical composition of Filtralite® Pure Mono-Multi Fine is in Table 3.
Table 2.
Basic characteristics of the filtration material Filtralite® Pure Mono-Multi Fine [17].
Table 3.
Chemical composition (approx. values) Filtralite® Pure Mono-Multi Fine [17].
| SiO2 | Al2O3 | Fe2O3 | K2O | CaO |
|---|---|---|---|---|
| 63 % | 17 % | 7 % | 4 % | 2 % |
Table 4.
Basic characteristics of filtration materials – new silica sand and Carboziar [18].
Fig. 3.
Grain size distribution curves for filter F1 (Filtralite MonoMultiFine) and filter F2 (Silica sand + Carboziar).
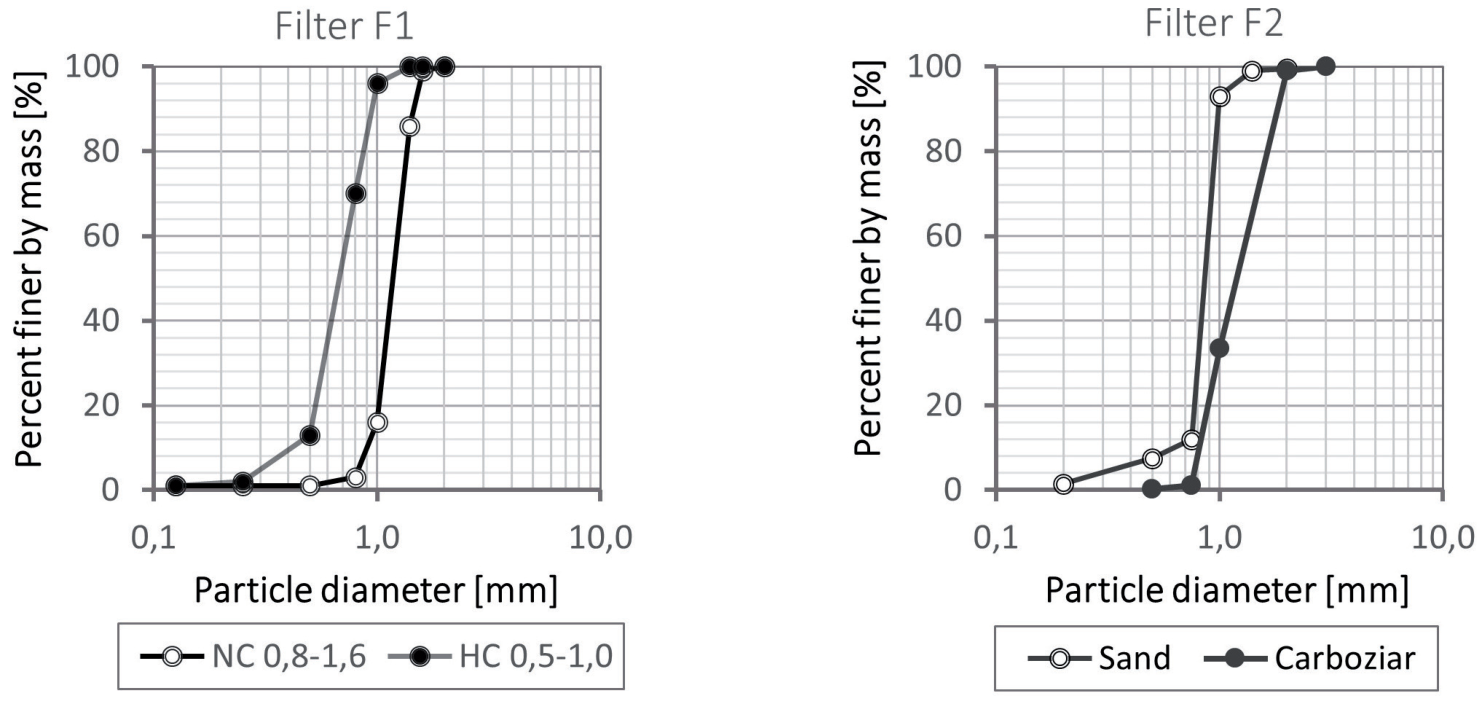
Fig. 4.
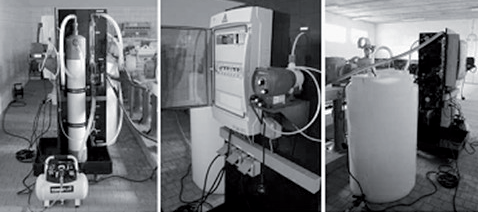
A view of the ultrafiltration device, the membrane module itself, the control system, and the treated water storage tank.
Filter F2 was filled with two filtration materials – new silica sand (FP1) 70 cm high, and a 70 cm layer of Carboziar (calcined anthracite). Table 4 shows the basic characteristics of filtration materials – silica sand and Carboziar (VUM, Slovakia).
Fig. 3 shows the particle size distribution curve of the materials used in the individual filter columns. The quality of the treated water did not deteriorate even after 108 hours when the filtration cycles ended, however, the sludge capacity was exhausted earlier. This information was derived from the filter resistance values. The following parameters were analyzed when monitoring the water quality: pH, water temperature, turbidity, color, alkalinity, CODMn, aluminum, number and size of particles and hydrobiology.
Pilot Tests Using Ultrafiltration without Coagulation
A fully automated ultrafiltration (UF) facility with a UA-640 membrane module (Microdyn-Nadir) with a control system, measurement of trans-membrane pressure, back-washing of the membrane with water and air and the possibility of chemical washing was used (Fig. 4). Specifications for modul UA-640 are listed in Table 5.
Altogether, 30 filtration cycles were performed. Every third cycle was analyzed, i.e. 10 separate cycles were evaluated. Each test lasted for 30 minutes. Samples were taken from the individual cycles as follows: – filtered water 1 (15 seconds after washing), – filtered water 2 (10 minutes after start of operation), – filtered water 3 (20 minutes after start of operation), – filtered water 4 (30 minutes after start of operation,
or immediately before the next washing of the
membrane).
Within each cycle, a sample of raw water was taken in advance of the membrane, of filtered water beyond the membrane and of the discharged wastewater after washing, wherein the washing cycle lasted only 10-12 seconds. An average sample of wastewater from three washings was used for the analysis.
The ultrafiltration experiment lasted for approximately 15 hours. The water flow rate through ultrafiltration was maintained at a value of 600 L/h. The following parameters were analyzed in the samples: water temperature, pH, conductivity, alkalinity, CODMn, turbidity, color, and total dissolved solids (TDS) and undissolved solids (at 105ºC). One hydrobiological examination was also performed during the ultrafiltration operation.
Table 5.
Basic characteristics of the membrane modul UA-640
Results and Discussion
The Pilot-Plant Experiments
The pilot experiments were divided into four stages:
A. conventional water treatment using various filtration materials,
B. conventional water treatment complemented by filtration through GAC,
C. pilot tests using ultrafiltration,
D. pilot tests using ultrafiltration followed by filtration through GAC.
Conventional Water Treatment Using Various Filtration Materials (Test A)
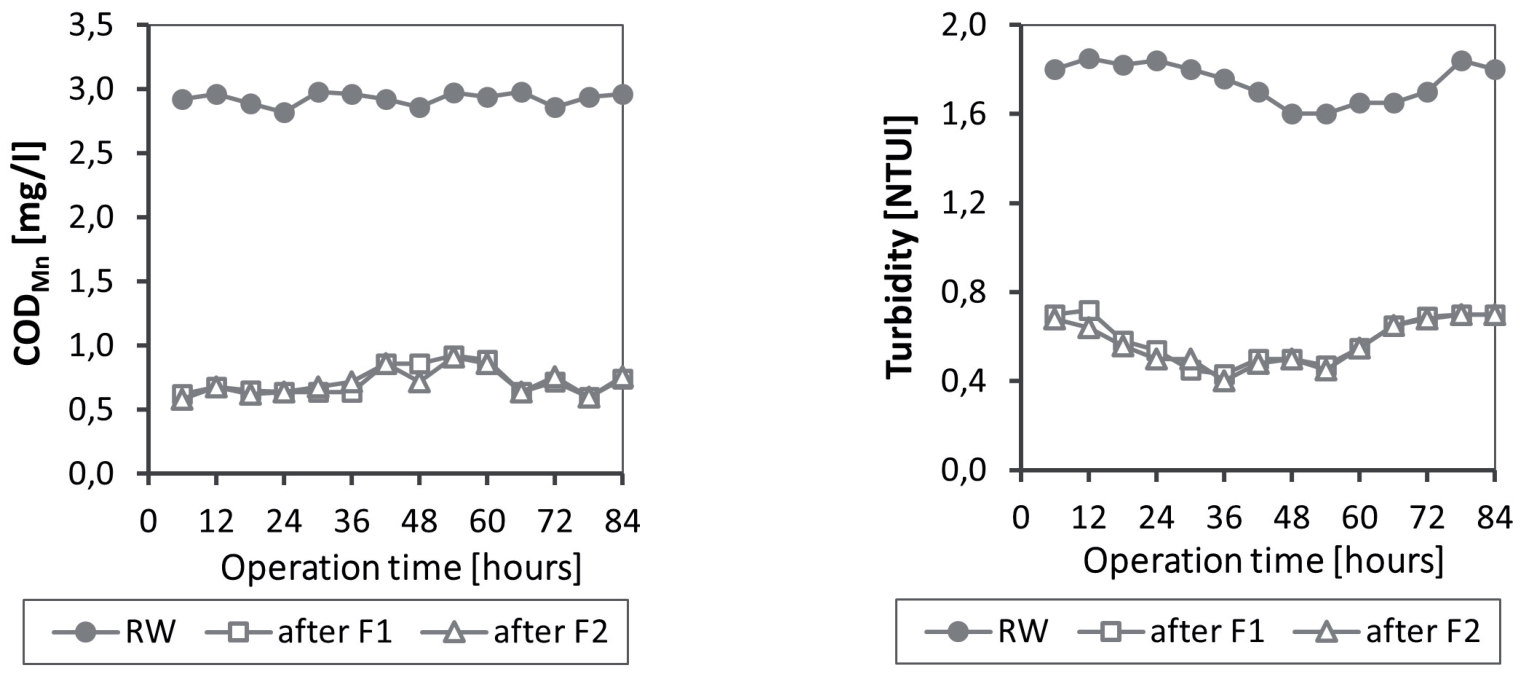
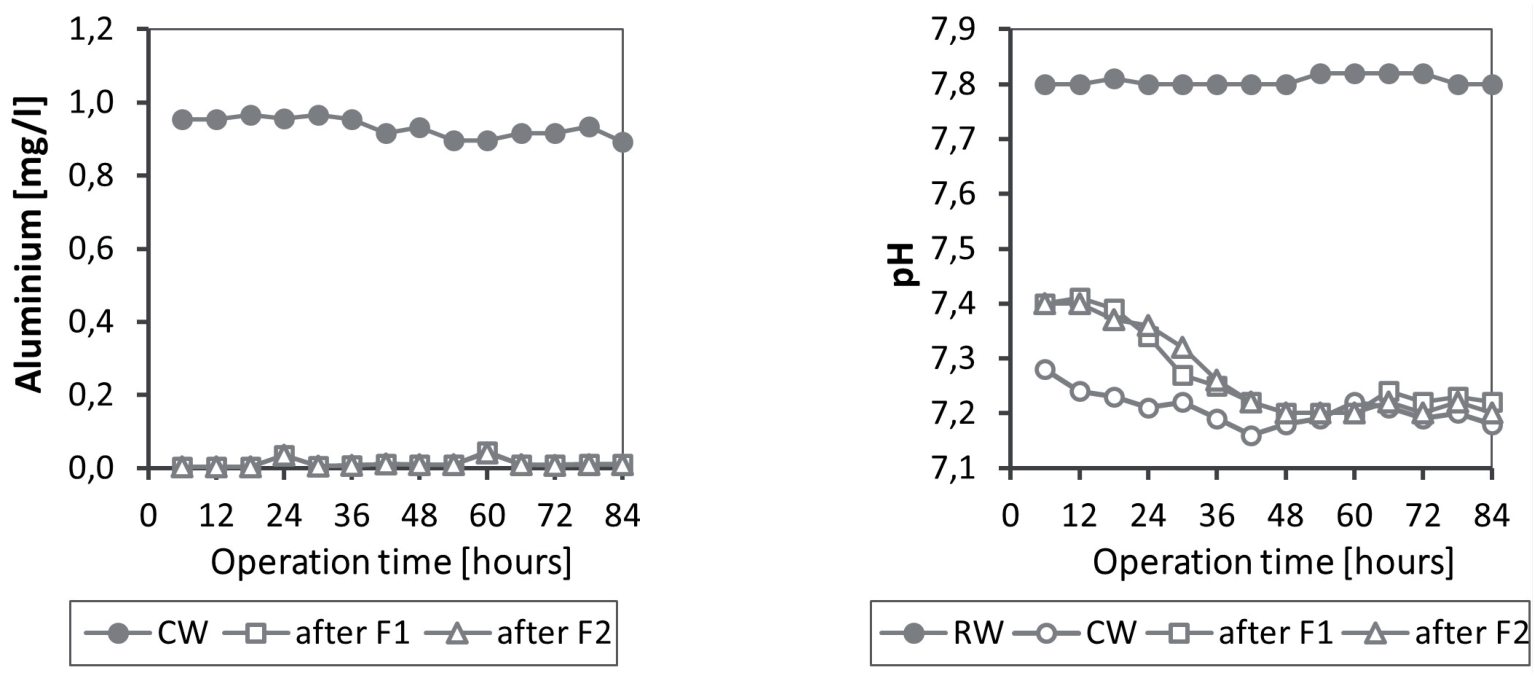
Figs. 5-7 show the efficiency of conventional water treatment from the Rozgrund water reservoir. The figures give the concentrations of raw water (RW) and water after coagulation and filtration by using two different filtration columns.
Fig. 7.
Course of the living organisms (left) and the total number of particles (right) when treating water by conventional water treatment technology.
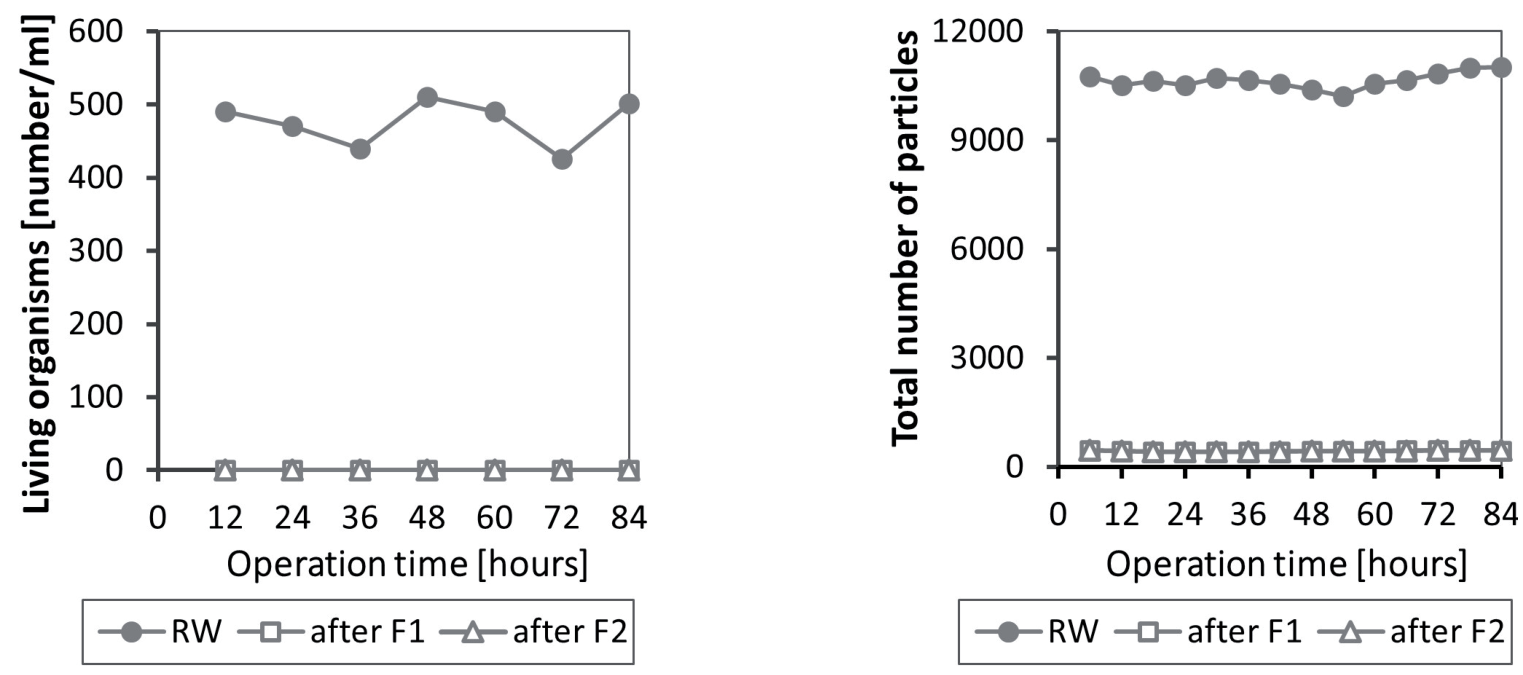
When considering the filtration effect or the effect of adverse component removal (reduction), the filtration materials used in the filters F1 and F2 exhibit an almost similar reaction. The comparison of the values of filtration resistance indicates that the values related to filter F1 are moderately better. At the horizon, the water passes from the anthracite filtration material into the filtration material of silica sand. The increase in resistance in the filter F2 is apparent. Filtration cycles for both filters ended after 108 hours of filtration, while the water quality did not get worse. However, the sludge capacity has depleted. This knowledge was obtained from the values of filtration resistance. In terms of capturing the organisms on the filtration media in filters F1 and F2, no differences were found, and during the entire filtration cycle, both of the filtration materials captured all of the organisms. A minor difference does not allow us to state responsibly which material is better for use.
In any case, the water consumption for washing the filtration material Filtralite is 30% lower with regard to the lower volume weights of this material.
With conventional water treatment, a CODMn removal efficiency of 75.4% was achieved for filter “F1” (Filtralite) and 75.6% for filter “F1”. In terms of turbidity, the efficiency of the individual filter columns was 67.0% for the “F1” filter and 67.7% for the “F2” filter. For filters F1 and F2, the value of aluminum in the filtered water was less than 0.04 mg/L Al throughout the filtration cycle. The pH of water with the addition of coagulant has decreased from 7.8 to 7.2.
In the filters “F1” and “F2”, no differences were found: both filter materials captured all organisms in the filter column during the whole filtration cycle. The results of particle number monitoring were similar. In the filters “F1” and “F2”, the efficiency was >98%.
Pilot Tests Using Ultrafiltration (Test C)
Fig. 8 shows the efficiency of ultrafiltration (without coagulation) in water treatment from the Rozgrund water reservoir. The figures give the average concentrations of raw and filtered water at the beginning and just before the end of the ultrafiltration cycle (together, 10 cycles). The average values for 10 filtration cycles before and after ultrafiltration are evaluated in Table 6.
Table 6.
The average values (altogether 10 cycles) determined before and after ultrafiltration.
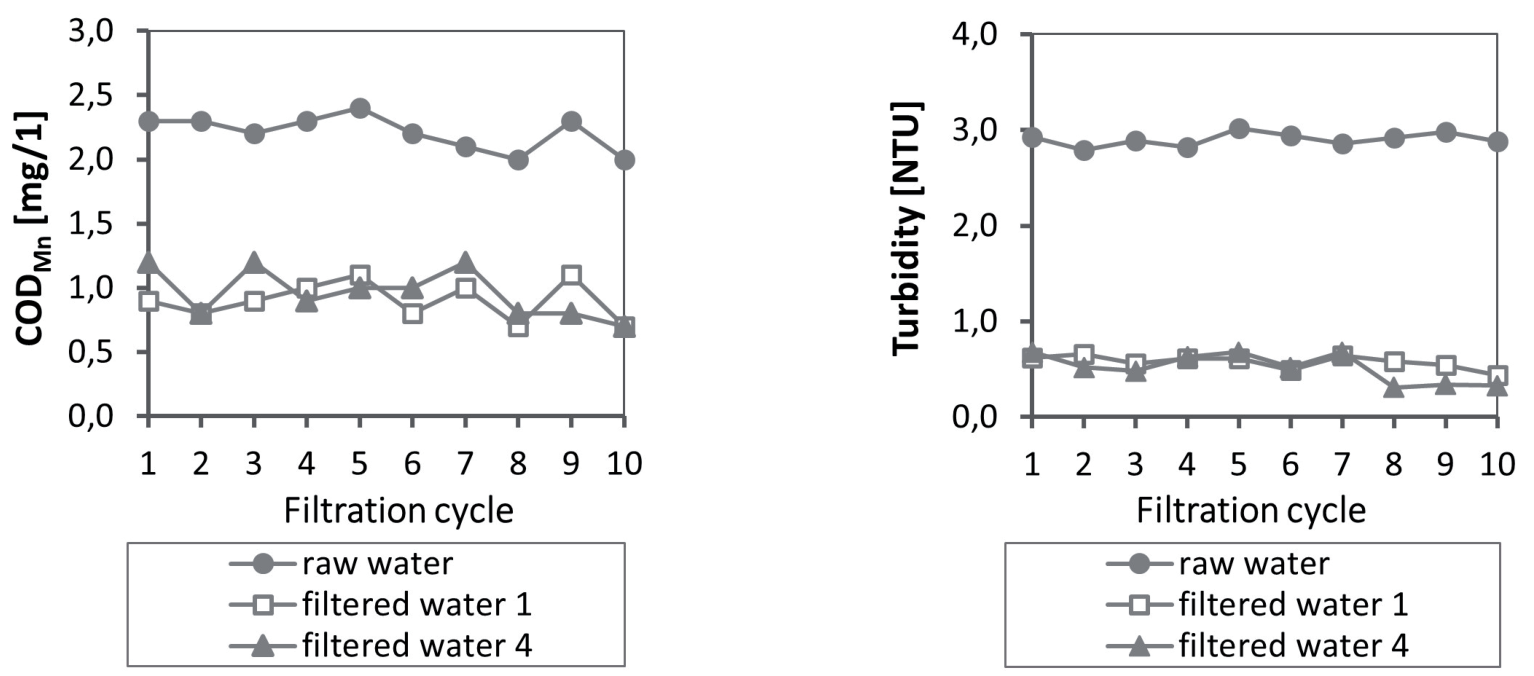
Fig. 9.
Course of CODMn when treating water by ultrafiltration, linked with GAC (left) and using conventional water treatment technology. Then, after adding a filter with GAC (right).
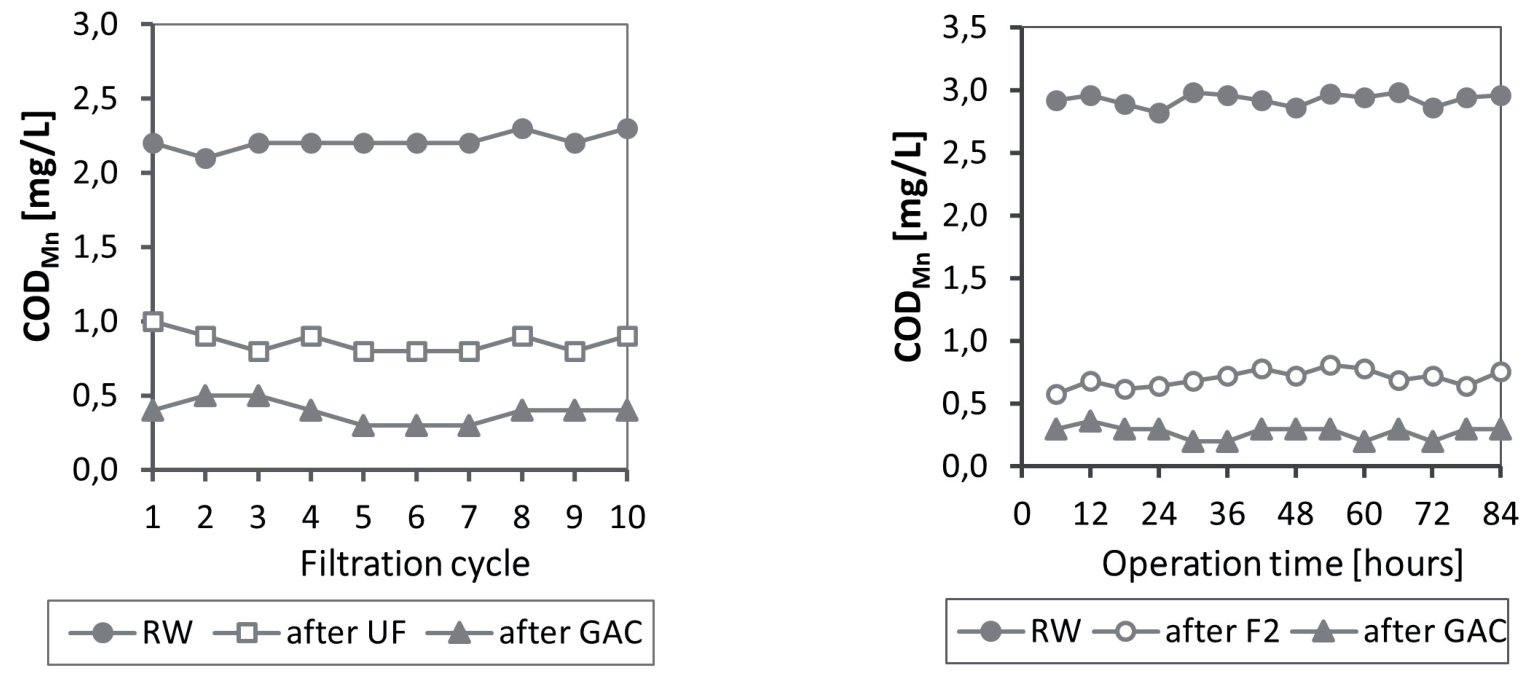
Fig. 10.
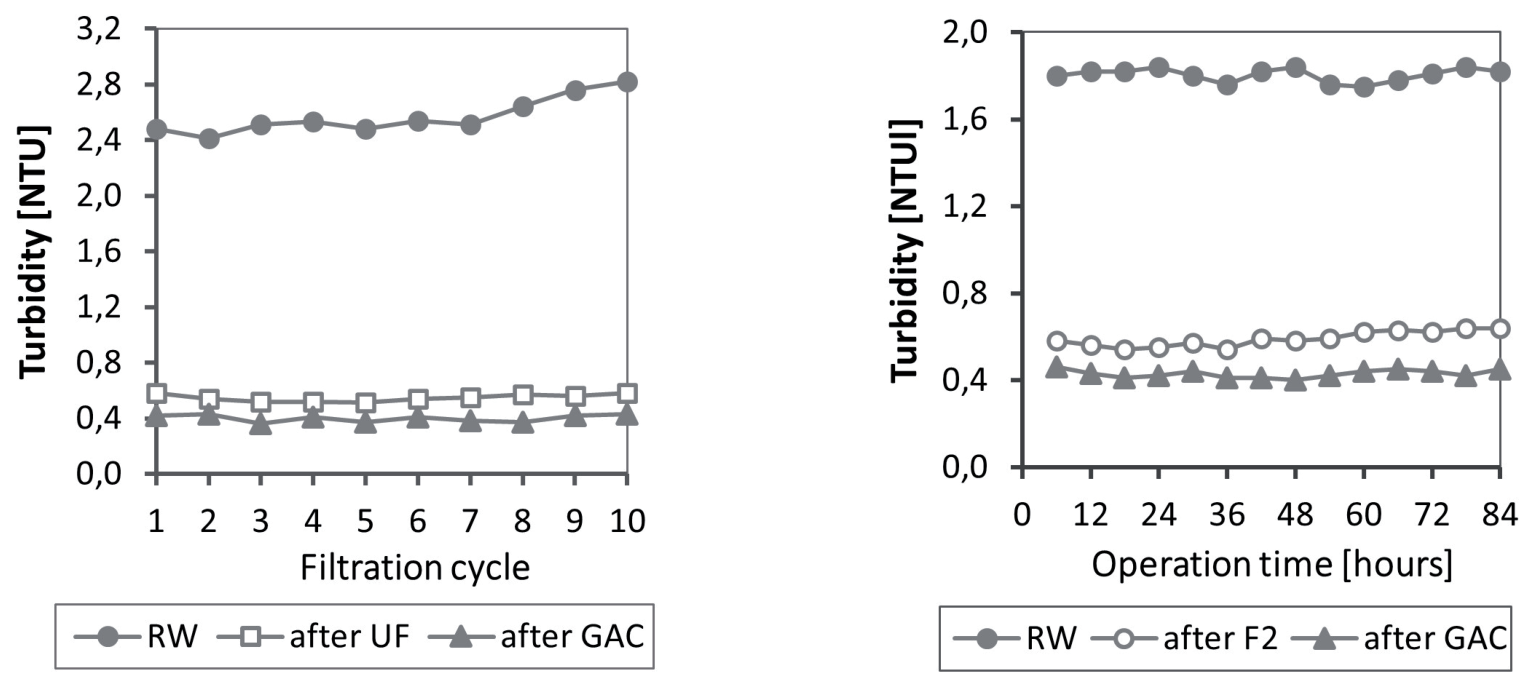
Course of turbidity when treating water by ultrafiltration, linked with GAC (left) and using conventional water treatment technology. Then, after adding a filter with GAC (right).
Based on all the cycles, it may be stated that ultrafiltration leads to a slight decrease in the conductivity and a slight increase in the pH of the water, while the turbidity and color of the water removal efficiency range from 84.8% to 95%. The more than 52% CODMn reduction was achieved. This is thought to be due to the removal of humic acids from water, as the pH decreased considerably (6.8-6.9) and the CODMn increased markedly (10-12 mg/l) in the waste (washing) water (Table 6).
Monitoring the ultrafiltration efficiency over one cycle showed that there was no change in water quality after washing the membrane and starting a new cycle. Also, before the end of the cycle, no deterioration in the quality of the treated water was detected.
Pilot Tests Using Ultrafiltration Followed by Filtration through GAC (Test D)
During the fourth pilot experiment, filtration through GAC was added to the ultrafiltration; the procedure was as for test C. During the operation, the quality of the raw water, the water after ultrafiltration, before the GAC filter, and after filtration using GAC was monitored.
Figs. 9 and 10 show the efficiency of classical water treatment and ultrafiltration, complemented by filtration through granular activated carbon (GAC).
In the case of conventional water treatment (using filter F2) or ultrafiltration complemented by filtration through granular activated carbon (Norit 830), the quality of the filtered water was evaluated prior to and after flowing through granular activated carbon (test B); compared with test A, the TOC parameter was also determined (due to odor).
By treating water using ultrafiltration and a filter with granular activated carbon, as high an efficiency as 82.6% of the removal of organic substances expressed by CODMn was achieved. The difference between the water after ultrafiltration and after flowing through GAC represented a 27.5% reduction of the TOC parameter. The turbidity removal efficiency was increased from 82% to 89% using a granular activated carbon filter connected after ultrafiltration.
Conventional Water Treatment Complemented by Filtration through GAC (Test B)
During the second pilot experiment (B), filtration through GAC was added to the conventional water treatment with filter F2. The CODMn removal efficiency of 75.6% without GAC (test A) was achieved and, if filtration through GAC was applied, the efficiency was around 90.5%. The difference between water after conventional treatment (after filter F2) and water flowing through GAC represented a 24.7% reduction of the TOC. In terms of turbidity, the efficiency of filter column F2 was 67.7%; if filtration through GAC was applied after filter F2, the efficiency was around 85%.
It is necessary to emphasize the significance of washing the new GAC material, and also of soaking it adequately, as recommended by the producer. According to the producer, it is necessary to wash new granular activated carbon with a 10 to 20-fold volume of water per filter volume.
Conclusions
The technological tests of the treatment of surface water from the Rozgrund water reservoir proved that the pilot experiments using different technologies can achieve the quality of drinking water according to the Decree of the Ministry of Health of the Slovak Republic No. 91/2023.
The conventional water treatment concerning coagulation, flocculation, and filtration with two different filtration mediums – Filtralite MonoMultiFine and filter sand with black coal material Carboziar, was compared with the conventional treatment with filter sand and Carboziar complemented with filtration through granular activated carbon (Norit 830), ultrafiltration using fully automated equipment with membrane module UA-640 (Microdyn-Nadir), and ultrafiltration combined with granular activated carbon (Norit 830).
The results of the tests showed that:
1. With conventional water treatment, CODMn and turbidity removal efficiency ranged from 75.4% to 67,0% for filter “F1” (Filtralite) and from 75.6% to 67,7% for filter “F2”, respectively. For filters F1 and F2, the value of aluminum in the filtered water was less than 0.04 mg/L Al throughout the filtration cycle. This technology captured all living organisms, and the efficiency of total particle removal was more than 98% during the whole filtration cycle.
2. With ultrafiltration, the turbidity and color of water removal efficiency range from 84.8% to 95%. The more than 52% CODMn reduction is an interesting result. This technology removes all living organisms and all particles from water.
3. The difference between water after ultrafiltration alone and ultrafiltration complemented by filtration through GAC represented an increase in the removal efficiency of CODMn from 52,1 % to 82,6%, a 24.7% reduction of the TOC in treated water, and an increase in the turbidity removal efficiency of 82% to 89%.
4. When filtration through GAC was added to the conventional water treatment with filter F2, the CODMn removal efficiency was 75.6% without GAC (test A), and after filtration by GAC, it increased to 90.5%. The difference between water after conventional treatment and water flowing through GAC represented a 24.7% reduction of the TOC. In terms of turbidity, the efficiency of the filter column F2 was 67.7%; if filtration through GAC was applied, the efficiency was around 85%.
In relatively pure water, where the decisive parameters (color<12 mg/L, turbidity<3 NTU, CODMn<3 mg/L) are below the limit values of the Slovak Republic Decree No. 91/2023, for drinking water, mechanical filtration would in principle be sufficient. Problems can be caused by cyanobacteria, living organisms, natural organic matter (humic acids), organic pollution, climate change, and changes in the temperature of the water in the reservoir. These problems need to be anticipated, and a suitable water treatment technology designed to obtain quality and safe drinking water is needed.
On the basis of the pilot tests, ultrafiltration and a filter with GAC will be proposed as two of the alternatives for the overall modernization of the WTP Rozgrund. The second option is to apply the conventional water treatment with a filter made of two materials – sand and anthracite, with the PAX-18 coagulant being used in both options.
In the case of a given water quality, it is also necessary to take into consideration a reduction in water aggressiveness and an increase in water hardness; UV radiation and chlorine gas dosing are proposed for disinfection.

