

Introduction
Heavy metals are ubiquitous and persistent in the soil environment [1]. Major sources of heavy metals in soils are organic and inorganic fertilizers, pesticides, in addition to sources such as industries, mining, irrigation water and atmospheric deposition [2-4]. Agricultural soil contamination has a negative effect on soil functions, plants, environment, food quality, and human health [5-10].
Greenhouse vegetable cultivation is widely applied in off-seasons production in many countries around the globe to meet the growing demands of vegetables while improving yield and reducing environmental impact and production cost [11, 12]. Relative to open-field cultivation, greenhouses are intensive, multi-cropping way of food production which involve excessive use of fertilizers, pesticides and irrigation water that may cause soil salination and acidification, nutrient imbalance, and heavy metal accumulation [13-16]. Acidification of greenhouse soils affects the mobility of heavy metals and accelerates their leaching to groundwater and increases their uptake by crops [17]. Animal manure is often used as organic fertilizers to increase soil organic matter, nutrient availability, cation exchange capacity and water holding capacity of soil [18], however, manure application is an important source of heavy metals in soil [19, 20]. Production of vegetables in greenhouses requires different types of fertilizers including water-soluble fertilizer, cattle manure, organic fertilizers, compound fertilizers, chemical fertilizers, and bacterial manure, leasing to variations in heavy metal pollution [21]. Sewage sludge and fertilizer are important sources of heavy metals [22-24].
In recent years, Jordan has observed a gradual shift in vegetable production from open fields to greenhouses. For example, the plastic-covered vegetables greenhouse accounted for 17.9% of the total vegetable cultivated lands in 2017 which has risen to 18.5% in 2018 and to about 19.2% in 2019 [25-27]. This is primarily triggered by increasing demand for food in response to the large population growth (especially due to fluxes of Syrian refugees) and higher net profit margins. Greenhouses in Jordan are simple tunnels covered with polyethylene plastic sheets, most of which are constructed in Jordan Valley (southwest) and in the northern highlands where the majority of fertile arable fields are located.
Excessive use of agrochemicals (including fertilizers and pesticides), animal manure and irrigation water (often treated wastewater) are common practices in greenhouse vegetable production in Jordan. These unsafe farming practices are largely driven by a lack of knowledge of health implications among farmers.
As such, consumer concerns are mounting in recent years about food quality and safety. Previous studies found eutrophicated greenhouse soils that are also contaminated with heavy metals. Assessing the potential ecological risk of heavy metals associated with greenhouse cultivation in relation to soil properties is necessary to develop sustainable greenhouses while minimizing environmental impact [28]. There are currently no published studies about heavy metal contamination of soils in greenhouse vegetable growing regions of Jordan. This study aims to measure the concentration of heavy metals (Cd, Cr, Cu, Ni, Zn, and Pb) in soils in an important greenhouse vegetable production area in northern Jordan and identify soil properties that may contribute to the observed heavy metal levels. It also intends to assess the potential risk and sources based on a variety of widely used pollution and ecological risk indices.
The Study Area (Location, Geology, and Soil)
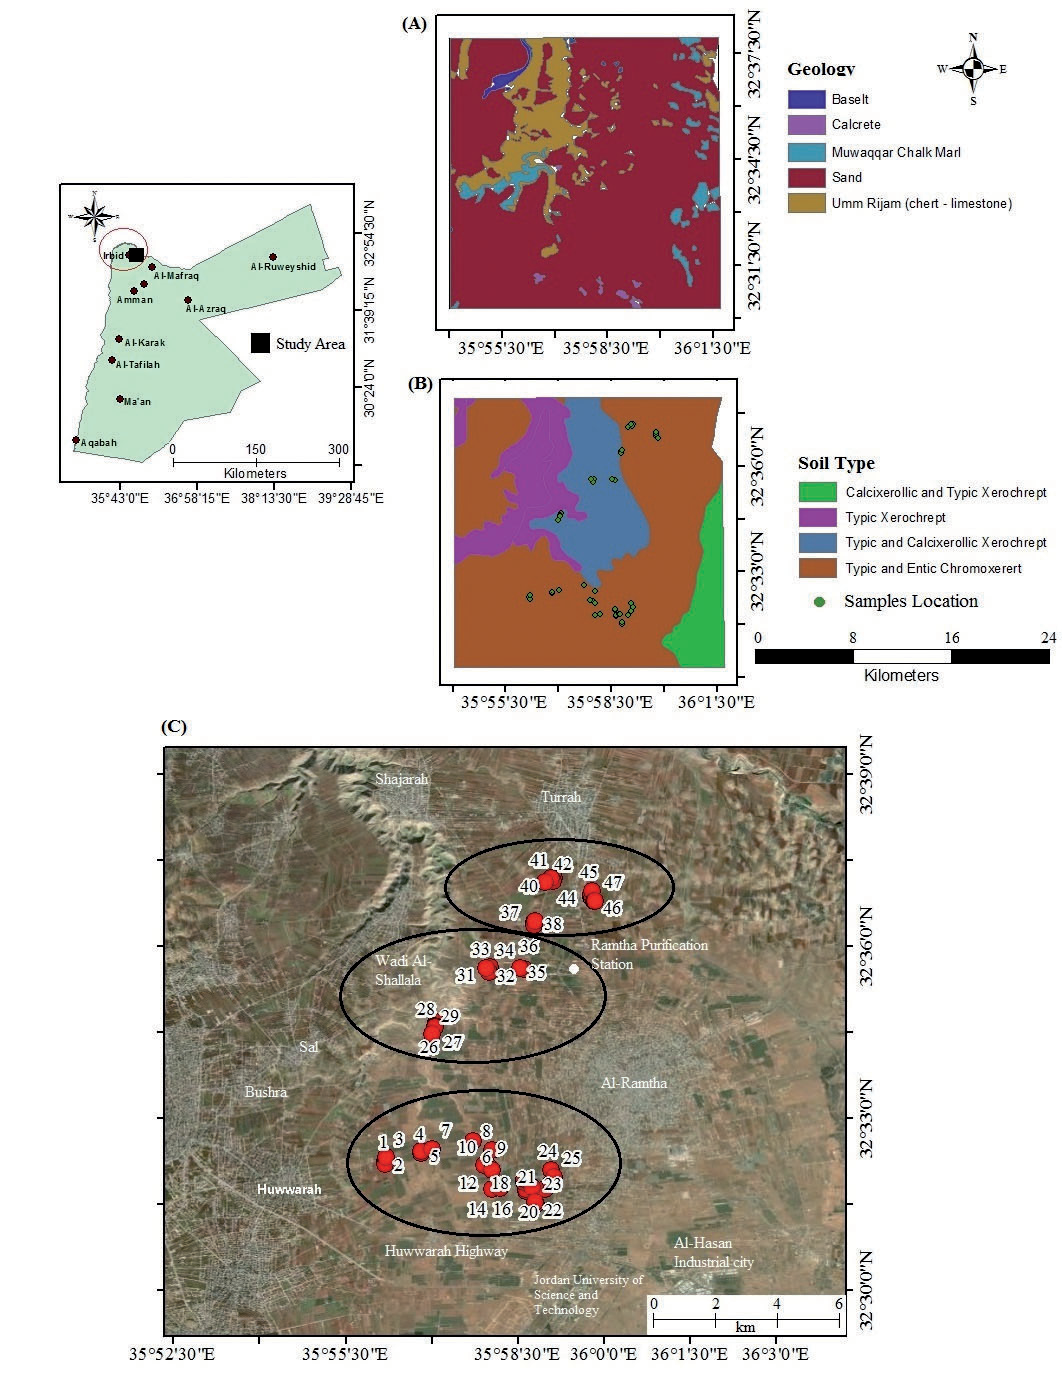
The study was performed in greenhouse vegetable cultivation area (170 Km2) located in the fertile flat lands of Ramtha district, northern Jordan. The soil sampling points were selected in the area between the city of Ramtha and At-Turrah to the east, and the city of Irbid, Huwwarah and Wadi shallala to the west with Huwwarah highway bordering the area from the south (Fig.1). The study area is dominated by mid-latitude dry semiarid (Steppe) climate where evapotranspiration exceeds precipitation. July is the warmest month, with an average high temperature of 33ºC and the coldest is January, with a mean high temperature of 14ºC. The annual rate of precipitation is about 250 mm with the largest amounts occurring in December, January, and February, peaking in January. The relative humidity is highest in February (70%), and lowest in May (35%) [29]. The geology of the study area shown in Fig. 1 is characterized by sedimentary rocks deposited in warm shallow marine environment. All formations belong to Belqa group which is composed of (1) Muwaqqar chalk marl formation, which consists of fossil rich rocks of soft chalk, chalky limestone, and clayey marl with hard limestone concretions, (2) Umm Rijam chert limestone formation of chalky, marly and kerogen limestones in addition to beds and concretions of chert, and (3) Wadi Shallala chalk formation that is made up of massive grey-white chalk found to the north of Wadi Shallala and Shajara-Turrah area [30, 31]. Pleistocene-Recent sediments are found as soil and Pleistocene gravel. The study area is an agriculturally important region containing wide ranges of soil types, reflecting different physical characteristics. Vertisols and Inseptisols of Xerochrepts, Chromoxererts and Calcixerollic are the major soil great groups, covering 4.31% of Jordan [32, 33] (Fig. 1). Soils of this region are mainly clay with high cation exchange capacity and high carbonate content and are considered as the most productive rainfed soils in Jordan [34].
Fig. 1.
Location map of the study area showing (A) the geological settings, (B) the soil types, and (C) the soil sampling points.
The study area is intensively cultivated with rainfed agriculture as the main land use. It hosts a variety of industrial activities as well. According to the Irbid Agricultural Directorate survey [29] the actual cultivated land in Ramtha district is 137,242 donum (1 donum = 1000 m2) out of a total arable land of 233,633 donum, of which 42,550 donum are planted with olives and fruit trees, 49,105 donum with summer and winter vegetables, and 36,845 donum used to produce winter field cereal crops (wheat, barley, lentils, and broad beans). Fertile plains occupy a large percentage of the study area. This region has historically served as the nation’s breadbasket but has been encroached by urbanization [35].
Due to the scarcity of freshwater resources in Jordan and particularly in this region, agriculture relies mainly on highly variable rainwater which affects production and yields of the rainfed lands, livestock, and irrigated crops in Ramtha area. The agricultural sector adopted several strategies to control agricultural practices in terms of irrigation methods through greenhouse vegetable cultivation, which brought financial and economic security to farmers of this region. The number of greenhouses in Ramtha is 11650, with a total cultivated area of about 5825 donum.
Materials and Methods
Sixty-one composite top-soil samples (0-20 cm) were obtained from the study area during the vegetable cultivation season in October 2022 (Fig. 1), of which forty-seven were collected from plastic-covered greenhouse area and fourteen were sampled from the adjacent open-field land, with both are designated for vegetable production. A GPS global position system (GARMEN) was used to obtain the coordinates of soil sampling points. During the time of sample collection, the greenhouses were cultivated with tomato, cucumber, green beans, bell paper, lettuce, and strawberry. Each composite soil sample collected represents a mixture of three samples (200 g each) from greenhouse group cultivated with the same crop under the same agricultural conditions.
The samples were air-dried, hand-crushed, well-mixed, and sieved through a 2 mm sieve, and were stored in polyethylene plastic bags for chemical analyses. Heavy metal concentration (Cd, Cr, Cu, Zn, Ni, Pb) was measured as follows: 1 g of sieved soil fractions were digested with 4ml HNO3, 4 ml HCl and 2 ml HF. After heating, the samples were filtered through a Whatman filter paper (no. 42), and the digest was diluted to 50 ml with deionized water and analyzed using novAA 800 D-Flame- and Graphite Furnace AAS. The instrument was calibrated using a multi-element stack solution (1000 ppm) for the preparation of standard solutions (0, 2, 4, 8, and 12 ppm). The accuracy of the instrument was represented by a linear calibration curve of R2˃0.99. Instrumental precision was verified by testing the concentration of the standard solutions after every ten samples. To ensure data quality triplicate sample, deionized water, and blank sample analysis were performed. Soil pH and electrical conductivity (EC) was measured for a soil/water suspension (1w:5v) using a digital calibrated pH and conductivity meters. Soil organic matter was determined by oxidation method according to Walkley and Black [36], Loring and Rantala [37], using potassium dichromate (K2Cr2O7) and sulfuric acid (H2SO4). The CaCO3 soil content was determined using the calcimeter in which the volume of CO2 released from the sample is measured relative to the volume released from a similar weight of pure CaCO3 (standard). Microsoft Excel was used for statistical calculations and performing Spearman’s correlation coefficients. ArcGIS 10.3 software was used to generate the location map.
The assessment of heavy metal concentrations was performed by calculating the contamination levels and degree of pollution using variable pollution indices, as follows:
Enrichment factor (EF) is used to evaluate the contamination level of heavy metals using the equation [38]
EF = (M/Fe) sample/ (M/Fe) background
Where (M/Fe)sample is the ratio of metal to Fe concentrations in the sample and (M/Fe)background is the ratio of metal to Fe concentrations in the background. The background metal concentrations in the present study are determined using the Turekian and Wedepohl [39] crustal shale background concentrations. Enrichment factor classification is listed in Table 1.
Geo-accumulation index (Igeo) is widely used for the evaluation of contamination levels derived from anthropogenic activities using the equation [40]:
Where Cn represents metal contents in the soil, Bn the geochemical background value in shale [39], and 1.5 is a factor used for possible changes in the background data due to lithological variations. The Igeo contamination categories are represented in Table 1.
Contamination Factor (CF) was calculated using the following equation [41]:
CF = Ci/Cin
Where (Ci) is the concentration of metal in the studded soil and (Cin) is the crustal shale background value of the metal. Categories of contamination factor are listed in Table 1.
Pollution load index (PLI) was calculated using the (CF) of each heavy metal according to the following equation [42]:
Table 1.
Classification of soils based on different pollution indices.
PLI = (CF1 × CF2 × . . . × CFn) 1/n where (n) is the number of heavy metals measured in the current study. The (PLI) contamination categories are represented in Table 1.
Total potential ecological risk index (RI) is calculated by using the equation [41]:
RI = ∑ Ei
Ei = Ti × (Ci/Bi)
Where (Ei) is the individual ecological risk factor, (Ti) is the toxic-response factor for heavy metals (Cd = 30, Cu = Pb = Ni = 5, Cr = 2, Zn = 1), (Ci) is the metal concentration in the studied soil samples, and (Bi) is the shale background metal concentration. The categories of individual potential ecological risk (Ei), and total ecological risk index (RI) are represented in Table 1.
Results and discussion
Summary statistics of heavy metals and soil properties for 47 greenhouse samples and 14 open-field agricultural land samples are tabulated in Table 2. The concentrations of Cr, Cu, Cd, Pb, Ni and Zn ranged from 7.4-59.5, 17.9-51.7, 0.0-2.2, 33.4-71.1, 32.2-69.23, 90.5-318.3 mg/kg for greenhouse soils and from 5.7-40.6, 11.9-27.8, 0-2, 26.5-67.7, 30.7-69, 56.1- 151.2 for open-field soils (Table 2). Based on heavy metal abundance, both soils revealed a similar ranking with few exceptions. The greenhouse soil showed the descending order Zn>Pb>Ni>Cu>Cr>Cd and open-field soil follow the ranking Zn>Pb>Ni>Cr>Cu>Cd. However, the accumulation of heavy metals was consistently higher in greenhouse than in open-fields. The average concentrations of Cr, Cu, Cd, Pb, Ni and Zn were 26.1, 26.8, 0.81, 53.0, 49.3 and 139.1 mg/kg 19.1, 19.3, 0.66, 49.7, 46.7 and 104.9 for greenhouse and open-field soils, respectively (Table 2).
The pH values for greenhouse soil samples range from moderately acidic (5.47) to moderately alkaline (7.94) with an average of 6.86 indicating a generally slightly acidic soil (with low coefficient of variation (CV = 9.56)). Whereas open-field soils demonstrated pH levels that varied from 6.2-7.93 with a mean value of 7.26. Greenhouse soils revealed relatively lower average pH value with higher variabilities. The pH is one of the most important soil parameters controlling heavy metal adsorption, availability, and uptake by plants [43-45]. While several studies have reported a significant decline in soil pH [46, 47], in this study minor decreases in pH values were observed for greenhouse compared to open-field top-soils. This suggests that the intensive cultivation practices probably have small impact on pH values and consequently on the observed heavy metals contents.
While the variability of soil pH can be linked to the use of agrochemicals (fertilizers and pesticides), manure, organic fertilizers, a significant contributor to pH values is the geology of the study area with abundance of carbonate rocks (Fig. 1). Both soils appear to be of relatively higher buffering capacity, due to high concentrations of CaCO3. In greenhouse cultivated soils, CaCO3 content ranged from 15% to 39% with an average amount of 21.4%, compared to 12.4-39% measured in open-field soils and a mean amount of 23% (Table 2). Open-field soils are highly exposed to atmospheric deposition of mineral dust containing CaCO3, where higher average has been observed.
The greenhouse cultivation in the study area is limited to the summer season. The unsustainable agricultural practices in greenhouses, of intensive use of agrochemicals, manure, and irrigation water, where treated wastewater is an important source of irrigation water, may cause soil nutrient imbalances and heavy metals accumulation [16]. By the end of the growing season, plastics covering greenhouses are dismantled and removed, where soils are exposed to the ambient environment for the rest of year, especially windblown dust containing CaCO3, salts and heavy metals, among others [48, 49].
Soil salinity (EC) revealed relatively greater values for greenhouse samples (averaging 1118.6 µs/cm) than those observed in open-field agricultural soils (with a mean of 503.6 µs/cm). These average values indicate non-saline soils. However, in some locations, greenhouse soil salinity levels demonstrated weakly saline soils, with a maximum value observed in greenhouse was 3170 µs/cm compared to 1261 µs/cm in open-field soils (Table 2). The highest EC value measured in site 2 (greenhouse) is largely attributed to the irrigation treated wastewater where this site is close to Ramtha wastewater treatment plant (Fig. 1). In addition to the excessive use of fertilizers and pesticides are sources of salinity to soils [50].
The soil organic matter (TOM) shows values in the range of 1.06 to 3.35% with an average of 1.87% relative to 0.59-2.41% found for open-field area. About 50% of the greenhouse soil samples are within the medium organic matter category [51]. The TOM is linked to decomposition of plant residues in greenhouses and use of organic fertilizers. Soil organic matter has been reported to affect the heavy metals mobility and availability [52-54]. The increasing soil organic matter may reduce availability of heavy metals within the organic fraction of the soil and lower the risk of adsorption by plants [55, 56]. Despite the relatively higher content of TOM in greenhouse soils compared to open-field lands, this is generally lower than expected. The relative low TOM content for greenhouse soils is likely related to the use of chicken manure along with plant residues [57]. Liu et al. [57] observed low soil organic matter for greenhouse soils of about 1% in the topsoil that raises nutrient leaching due to decreases in the retention capacity of soil for nutrients.
Table 2.
Summary statistics of the chemical parameters and selected heavy metals of soil samples collected from greenhouses and openfields in the study area.
For better characterization of heavy metals distribution, the greenhouse soils were grouped into 3 clusters (Fig. 1). Data tabulated in Table 3 show the average values of heavy metals for the three clusters, where cluster 1 includes samples from the southern area (1-25), cluster 2 contains samples from 26 to 35 located in central part of study area, and cluster 3 in the northern area which encompasses samples 36-47.
The spatial distribution of heavy metal concentrations for greenhouses soils revealed the following ranking of metals for cluster 1 Zn˃Pb˃Ni˃Cu˃Cr˃Cd with average concentrations of 127.30, 52.82, 39.36, 22.54, 13.26, and 0.65 mg/kg respectively. The highest variability of distribution was observed for Cd (0-2.2 mg/kg) with a coefficient of variation exceeding 50% (57.88%). Cluster 2 exhibited a slightly different descending order Zn˃Ni˃Pb˃Cr˃ Cu˃Cd with the average values of 149.03, 57.35, 54.30, 31.53, 28.34, and 0.71 mg/kg, respectively. The highest variability of distribution of heavy metal concentration in this cluster is also for Cd (CV = 72.85%). For cluster 3, heavy metal contents follow the ranking of Zn˃Ni˃Pb ˃Cu=Cr˃Cd with mean amounts of 156.30, 60.83, 57.47, 33.09, 33.06, and 0.75 mg/kg and highest variability of distribution observed for Cd (CV = 61.79%).
In all clusters, Zn was the most abundant heavy metal in soils whereas Cd was consistently the least. Cluster 3 showed the highest contents of heavy metals, whereas cluster 1 had the lowest averages of metals. Cd appeared to be the highest variable in greenhouse soils for all clusters, while Ni showed the least variations. Cluster 1 showed the lowest contents of heavy metals with identically a similar order of metals to that of open-field soils (Table 2 and Table 3). Relatively lower Cr and Ni values were observed for cluster 1 compared to open-field soils.
Spearman’s correlation coefficients were calculated for the metals determined in the greenhouse soils (Table 4). The results showed strong correlations between the following pairs of metals Ni-Cr, Pb-Cd and Zn-Cu (coefficient>0.5), positively moderate correlations were also observed between Ni-Cu, and low correlations were found between Pb-Ni, Pb-Cr and Ni-Zn. Associations among Ni-Cr, Pb-Cd, Zn-Cu and Ni-Cu suggest that they may have originated from similar sources. It should be noted that soil heavy metal concentrations did not correlate well with any of the greenhouse soil parameters. The soil pH was negatively and weakly correlated with all heavy metals. Similar observations were reported by Kim et al. [58] and Zhang et al. [59] for Cu, Ni, Pb, and Zn availability.
Table 3.
Heavy metal concentrations for collected soil samples from plastic greenhouse soils (cluster 1, cluster 2, cluster 3) in the study area.
Table 4.
Spearman correlation among heavy metals in greenhouse soils of the study area.
| Cu | Cd | Pb | Ni | Zn | |
|---|---|---|---|---|---|
| Cr | 0.000 | -0.260 | 0.220 | 0.841 | 0.075 |
| Cu | -0.114 | 0.034 | 0.491 | 0.528 | |
| Cd | 0.568 | -0.073 | -0.050 | ||
| Pb | 0.218 | 0.003 | |||
| Ni | 0.324 |
Soil pollution indices are tabulated in Table 5. While the average values of pollution indicators revealed broadly uncontaminated-moderately contaminated soils, the greenhouse exhibited slightly higher contamination degrees relative to open-field soils. All EF averages showed values less than 3, indicating a minor contamination of these metals. The EF results showed that 23.4% sampling sites had EF values above 3 (moderate contamination) for Pb, and only 5.3% for Zn. Whereas 38.3% of sampling points exceeded EF value of 3 for Cd, of which 8.5% were above 5 indicating moderately severe contamination. Greenhouse soils exhibited considerable enrichment for Cd. A widespread Cd pollution in greenhouse soils was reported in Wuwei (China) and Çanakkale (Turkey) [16, 60].
Based on the average Igeo values, greenhouse soils appear to be mostly unpolluted to moderately polluted (Igeo values<1). Cr, Ni and Cu are categorized as unpolluted, whereas the remaining heavy metals indicate unpolluted-moderately polluted soils. Around 25.5% of greenhouse soils showed Igeo values above 1 for Pb, and 38.3% for Cd (with one sample exceeding 2), and only one sample exceeded 1 for Zn. These results indicate that some soil sampling points were moderately (Pb and Zn) to heavily (Cd) polluted, where greenhouse cultivation is more intensive in these points resulting in increased Cd, Pb, and Zn accumulation.
The CF exhibited moderate contamination (Pb, Cd and Zn) and low contamination (for Cr, Ni and Cu). However, 25.5% of greenhouse sampling soils revealed CF values above 3 (considerable contamination) for Pb, 38.3% above 3 for Cd, of which 2% indicate very high contamination (site 16) and only 2 % showed considerable contamination for Zn. PLI indicates that only two sampling sites (31 and 33) are polluted as the PLI values are greater than 1. The remaining greenhouse soils showed varying degrees of PLI values but below 1.
The ecological risk assessment showed low Ei values for all heavy metals (below 30) indicating slight risks, except for Cd (Table 5). Heavy metals ranked in the following order: Cd>Pb>Ni>Cu>Zn>Cr. The average Ei values for Cd indicate strong risk (Ei = 80.79) (Table 5). Based on Ei values for Cd, about 29.8% of greenhouse soils are of medium risk for Cd, 34% with strong risk and 23.4% showed a very strong risk for Cd. Cadmium has a higher ecological risk than other heavy metals in greenhouse soils [61]. The results suggest that greenhouse soils are at a greater risk of Cd contamination than open field soils, which are consistent with others [60].
Total potential ecological risks values showed low risk (100.82) to the local environment. About 17% of soil sampling locations in greenhouse revealed very strong risk with RI above 150. All clusters revealed low ecological risks, in which cluster 1 showed the highest potential ecological risk value and cluster 3 had the lowest (77.3) (Table 5). The percent contribution of individual heavy metal to overall RI is presented in Fig. 2, which reveals that Cd accounts for most of the total risks (72.27-82.67%), followed by Pb which is responsible for 11.49-14.87% of the risk. These results indicate that the high ecological risk is mainly posed by Cd and Pb, with minor contributions from Ni>Cu>Zn>Cr.
Fig. 2.
The percentage of heavy metals individual ecological risk (Ei) to the total potential ecological risk (RI).
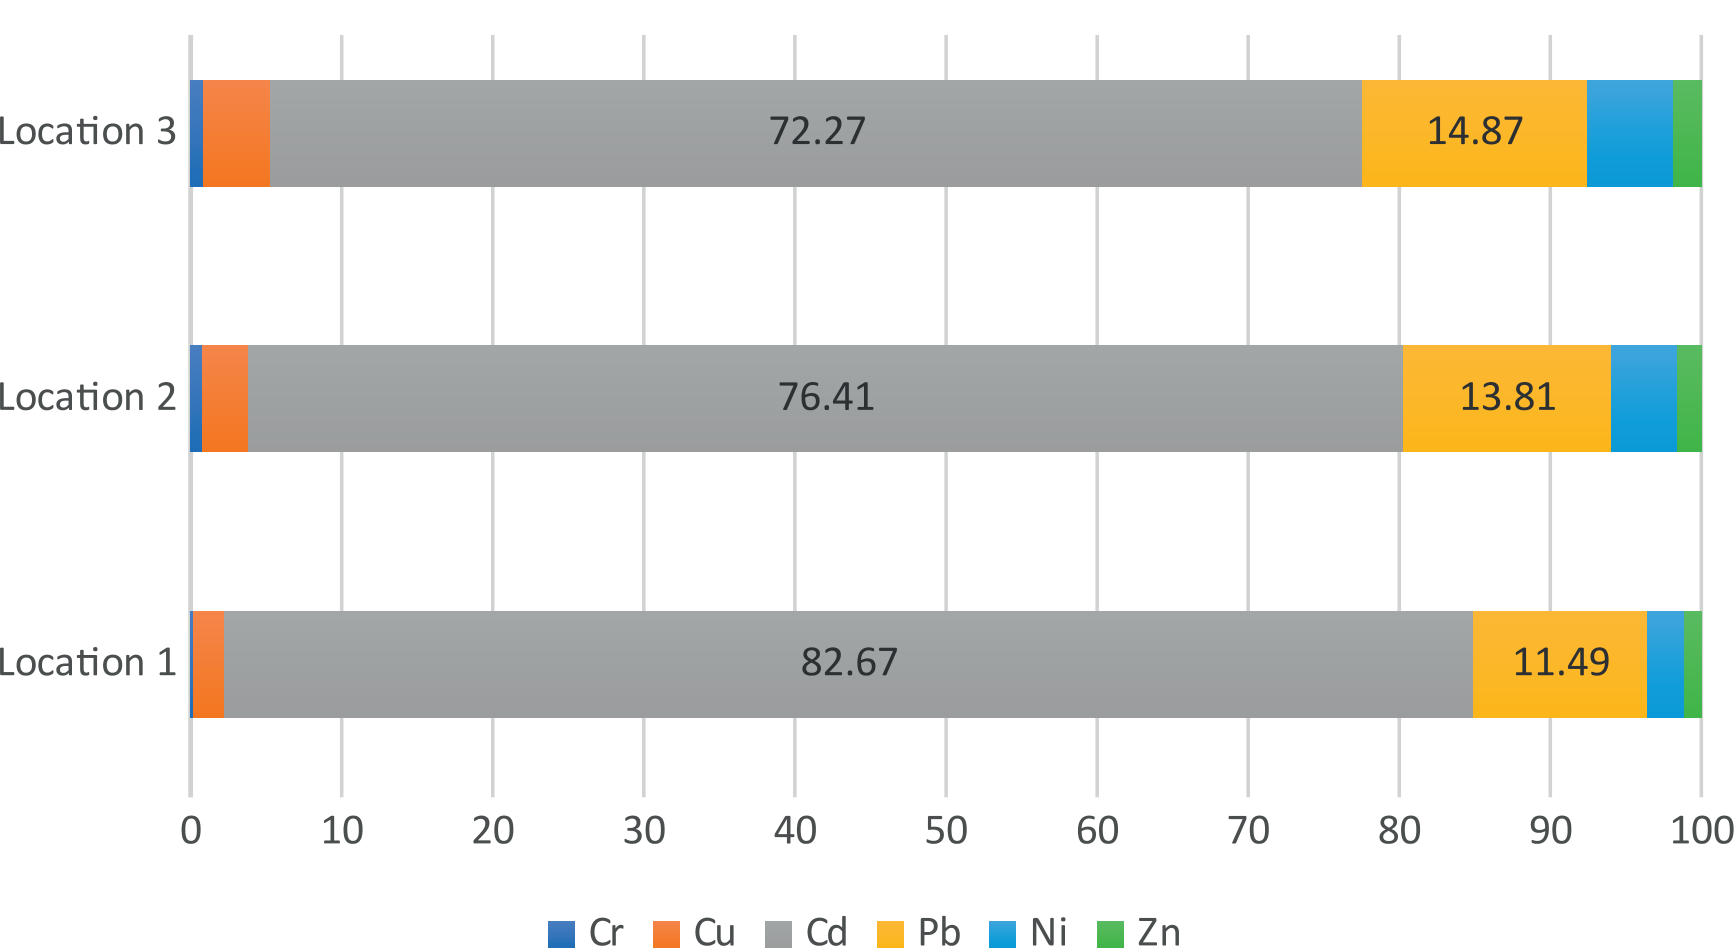
Table 5.
A variety of pollution indices and ecological risk calculations for greenhouse soils (and its clusters) collected from northern Jordan.
The comparison of the observed concentrations of heavy metals in greenhouse soils with the environmental quality evaluation standard for farmland of greenhouse vegetable production (EQESFGVP), and the Canadian soil quality guidelines of environmental health (SQGEH) (Table 6) revealed that Cr, Cu, and Zn in greenhouse soils are within the reported limits of SQGEH and EQESFGVP. The soil’s average Cd content is below the threshold of SQGEH but in excess of EQESFGVP. The average level of Ni in greenhouse soils is around the upper limits of both SQGEH and EQESFGVP. However, the concentration of Pb is slightly higher than the limit set by EQESFGVP but within the Canadian soil quality guidelines (SQGEH). Only Pb, Cd and Zn contents in greenhouse soils exceeded their respective concentrations in the crustal shale.
However, approximately 25.5% of greenhouse samples had Pb concentrations ranging between 60 and 71 mg/kg and exceeding the EQESFGVP limit, of which one is non-compliant with SQGEH. Additionally, 87.2% of soil samples were found with Cd concentrations of greater than 0.3 (in excess of EQESFGVP), 8 of them showed values above 1.46 mg/kg for Cd (above SQGEH standards for Cd). Zn levels in 3 locations (6.4%) surpassed the SQGEH limit of 200 mg/kg, one of which reported a value above 250 mg/kg (exceeding EQESFGVP guideline for Zn). 20 samples (42.6%) revealed Ni content above 50 mg/kg, that are higher than the Ni limits set by both soil quality standards. Nonetheless, no greenhouse soils exceeded any of the soil quality guidelines for Cr nor Cu. Based on average values, none of the open-field soils exceeded the soil quality standards for heavy metals, except for Cd which is slightly in excess of EQESFGVP.
Possible Heavy Metal Pollution Sources in the Study Area
The concentration of heavy metals in the study area and their correlation indices reflect their multiple sources. Heavy metal concentrations in soil are increasing with the growing industrial and agricultural activities and influenced by local contamination and long-range transport of pollutants [2]. The long-term application of pesticides (insecticides, herbicides, and fungicides), phosphatic and nitrogen fertilizers in addition to chicken manure contributes to the accumulation of Cd, Pb, Zn, Cu, Ni and Cr in agricultural soils [64-70]. Our multiple field visits to the study area and through questioning the local farmers, it was found that chicken manures are widely used as organic fertilizer due to the abundance of chicken farms in the region, where farmers placed these chicken manures in ponds covered with plastic sheets (for fermentation) and mixed with water before they were pumped to greenhouses with irrigation water. Zn, Pb and Cd (which are higher than the crustal background shale (Table 6)), phosphatic fertilizers [71] and chicken manure are important anthropogenic sources of these metals in the study area. Cd, Pb, and Zn in greenhouse soils are mainly derived from agricultural activities [72]. Application of manure is thought to be the primary source Cd, Zn, and Cu contamination in greenhouse soils [12], where the availability of heavy metal in soil is linked to the organic matter, cation exchange capacity, salinity, and other factors [73-75]. Soil fertilized with regular manure tends to have higher soluble Cu, Zn, and Mn concentrations than soil fertilized with mineral fertilizers due to higher contents of Cd, Cu, and Zn in manure [72, 76]. Wierzbowska et al. [77] found that the application of fertilizer and manure to soils increased the levels of soluble forms of heavy metals such as Cu, Ni, Pb, and Zn.
Another potential source of heavy metals in greenhouse soils is the application of sewage sludge to the soil and wastewater irrigation obtained from Ramtha wastewater treatment plant, located in the eastern side of the study area (closer to cluster 2), as wastewater is an important source of irrigation water, especially in arid and semiarid regions [78]. Many studies have reported that sewage sludge and fertilizers are important sources of heavy metals [22-24]. Many recent studies observed that the use of sewage sludge increases the soil levels of Zn, Cu, Ni, Cr, Pb, Cd, and Hg [79-83]. Xu et al. [84] reported that elevated levels of Cd were related to the application of manures and fertilizers and that elevated Cr concentrations were originated from wastewater irrigation.
Table 6.
Average heavy metals concentration in the study area (mg/kg) compared with average crustal background shale, the Canadian agricultural soil quality guidelines of environmental health (SQGEH) and the environmental quality evaluation standard for farmland of greenhouse vegetable production (EQESFGVP).
| Current study Greenhouse soil | SQGEH (1) | EQESFGVP (2) | Crustal Shale (3) | |
|---|---|---|---|---|
| Cr | 26.1 | 64 | 200 | 90 |
| Cu | 26.8 | 63 | 100 | 45 |
| Cd | 0.81 | 1.4 | 0.3 | 0.3 |
| Pb | 53.0 | 70 | 50 | 20 |
| Ni | 49.3 | 50 | 50 | 68 |
| Zn | 139.1 | 200 | 250 | 95 |
Table 7.
Average concentration of heavy metals (mg/kg) in greenhouse soils in the current study compared with their respective contents in other countries.
The study area is bordered by Huwwarah highway from the southern side (Fig. 1) connecting the city of Irbid and Ramtha with Al-Mafraq directorate in addition to other secondary roads cutting through the study area to facilitate transportation of goods and products and mobility of people between small towns and villages. Combustion of leaded gasoline on this network of roads is a contributing source to Pb, Cd, and Zn, especially in cluster 1 which is the closest to Huwwarah highway. Other sources in relations to traffic related activities including the corrosion of metal vehicle parts, tires, batteries, pigments, and lubricants from motor vehicles [1, 62, 85, 86].
Plastic materials used in constructing plastic greenhouses, waterpipes for irrigation, sheets covering the irrigation ponds, sheets covering the seedlings root inside the greenhouses. In addition, they are used as plastic packages to collect agricultural products to be transported to the market. Plastic materials gradually release pollutants to soil and the environment [87]. Besides, the plastics additives (usually contain heavy metals such as Pb, Cd, Cr, Cu and Zn) are used as inert fillers, pigments, stabilizers, biocides, antimicrobial agents, lubricants, and flame retardants [88, 89]. These materials can be a source of heavy metals to greenhouse soils when exposed to sunlight or because of tear and wear.
Despite being a center for greenhouse vegetable cultivation, the study area hosts factories for detergents, concrete, and dairy products, along with Al-Hassan Industrial City (mainly textile industries) located in the eastern side of study area (Fig. 1). Many studies confirmed the anthropogenic impact of these industries on the concentration of heavy metals in soils as a point source and by atmospheric deposition of transported industrial dust and emissions [69, 90-94]. Cd and Pb in greenhouse soils in the study area are likely originated from industrial activities and are influenced by intensive agricultural practices, through livestock and poultry manure, sludge, organic fertilizer, phosphatic fertilizer and irrigation wastewater.
The heavy metals in greenhouse soils reported in this study were compared to other studies conducted in other regions (Table 7). Overall, the observed concentrations of heavy metals from this study are comparable to those measured in other countries. Zn is slightly greater than those concentrations measured in all other countries. Except for Spain, Cd observed in the current study showed higher levels relative to other countries. Similarly, Pb is higher than those found in greenhouse soils in other regions, except for Spain. Ni average level is the second highest after those reported from Turkey. However, Cr and Cu contents exhibited relatively the least among all other greenhouse soils.
Conclusions
This study provides valuable data and results of heavy metal concentrations in greenhouse soils in one of the most important vegetables cultivated area north Jordan. The average concentration of heavy metals is in the order Zn˃Pb˃Ni˃Cu˃Cr˃Cd. The analyzed greenhouse soils are generally more impacted with heavy metals than the soils collected from agricultural open-field soils. The greenhouse soils heavy metal concentrations are higher than the crustal background for Cd, Pb, and Zn and within the reported limits of environmental quality evaluation standards for farmland of greenhouse vegetable production (HJ333- 2006) except for Cd. Pollution indicators showed that greenhouse soils are particularly contaminated with Pb and Cd. The ecological risk assessment revealed low risks, except for Cd.

