


Introduction
The government of Indonesia has decided to move the capital city from Jakarta to Nusantara City in East Kalimantan, located in the semi-enclosed water of Balikpapan Bay [1]. The ocean dynamics of the Makassar Strait and river runoff around this area influence the water mass dynamics in Balikpapan Bay. The Makassar Strait provides relatively highly saline water and river discharge contributes fresh water to the Balikpapan Bay. In addition, this area has robust seasonal and diurnal rainfall variations that contributes to the freshwater input to the river and Balikpapan Bay. The peak of the wet season occurs from November to December and March to April, whereas the driest period occurs from August to October [2, 3]. Thus, the water mass dynamics in Balikpapan Bay vary over tidal to seasonal timescales [1, 4-7] and influencing the water quality, phytoplankton community abundance and diversity, and other marine bio-geophysical parameter [8-12] Balikpapan Bay has a mixed prevailing semidiurnal tidal type [13-15]. The tides usually stir the water mass and nutrients within the water column and increases the phytoplankton abundance, mostly occurs during the days after the spring tide until the neap tide [16-18]. In addition, the bay is highly influenced by human activities, resulting in various types of pollution such as oil spills [19, 20], industrial and domestic pollutions, and pollution from agriculture activities.
A study by [21] identified approximately 17 species of algae in the waters of the Balikpapan Bay. Five of these species can potentially become harmful algal blooms (HAB) [22], which occur if environmental conditions are favourable, such as changes in the composition of nutrients in the body of the water [23-25].
Although HAB in Balikpapan Bay have yet to be recorded, phytoplankton diversity and its community structure should be assessed, especially concerning the development plans of the new capital city of Indonesia. This development will potentially increase the environmental load; hence, feedback should be provided on the growth of aquatic biota, particularly phytoplankton [23-26]. However, the study concerning water quality effects on the phytoplankton community in Balikpapan Bay does not yet exist. Therefore, this study aims to assess the correlation between water quality, phytoplankton abundance, and diversity in Balikpapan Bay. Results of this study is expected to be used as a reference on identifying ecosystem changes that potentially occur in the next few years due to rapid development that will be carried out.
Materials and Methods
The Study Area
The bay has a north-south orientation and narrows upstream. The length of the bay is approximately 35 km and the width varies from <1 km upstream to ~6 km at the mouth of the bay [1, 4-7, 27]. The mangrove area upstream and downstream of the swamp dominated coastal morphology. Settlement, industry, and other permanent infrastructure cover almost all the swamp areas in Balikpapan.
The Balikpapan Bay is influenced by seawater from the southern Makassar Strait. River runoff then occurs in the upper and middle areas. Significant river runoff comes from Sepaku, Semo, Wain, and Riko Rivers, with average discharges of 42.189 m3·s−1, 83.496 m3·s−1, 2.477 m3·s−1, and 16.852 m3·s−1, respectively [5-7, 28]. In addition, the Balikpapan Bay inland area experiences mean rainfall of 230.24±53.45 mm·month−1. Rainfall varies from 108.51 mm·month−1 to 317.00 mm·month−1, with two peaks during November-December, and March-April. The dry months occur in August to October [3].
Data Collection and Sampling Process
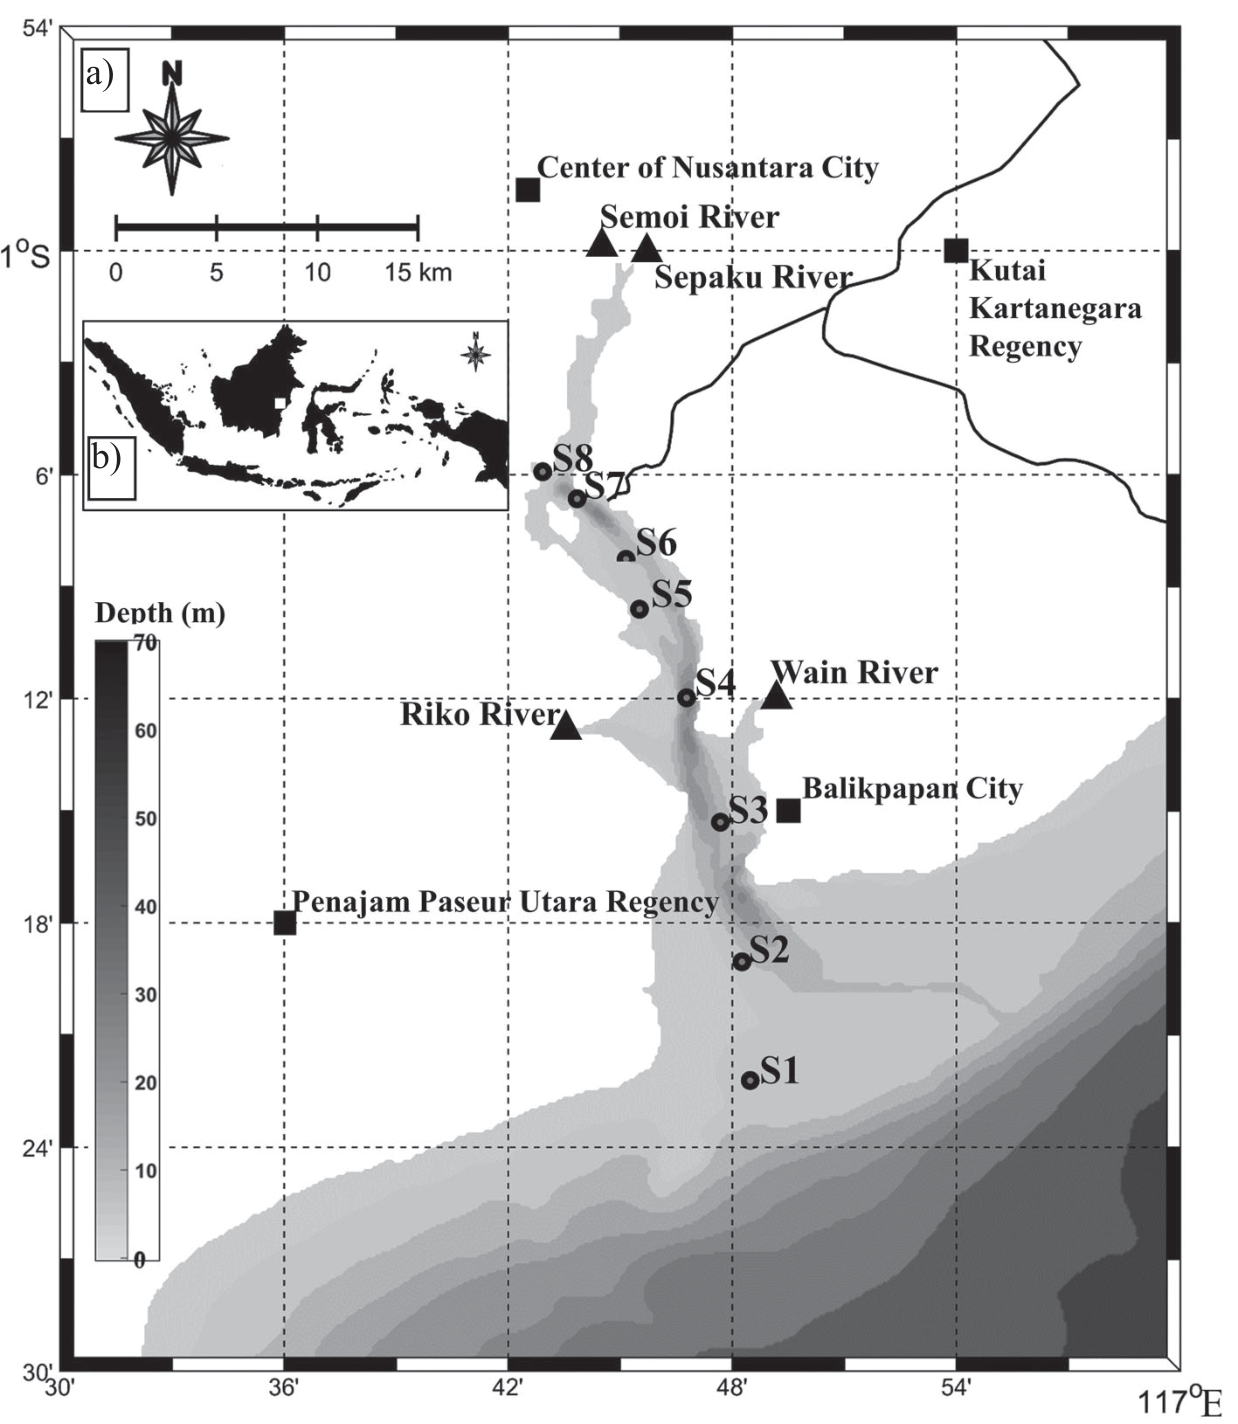
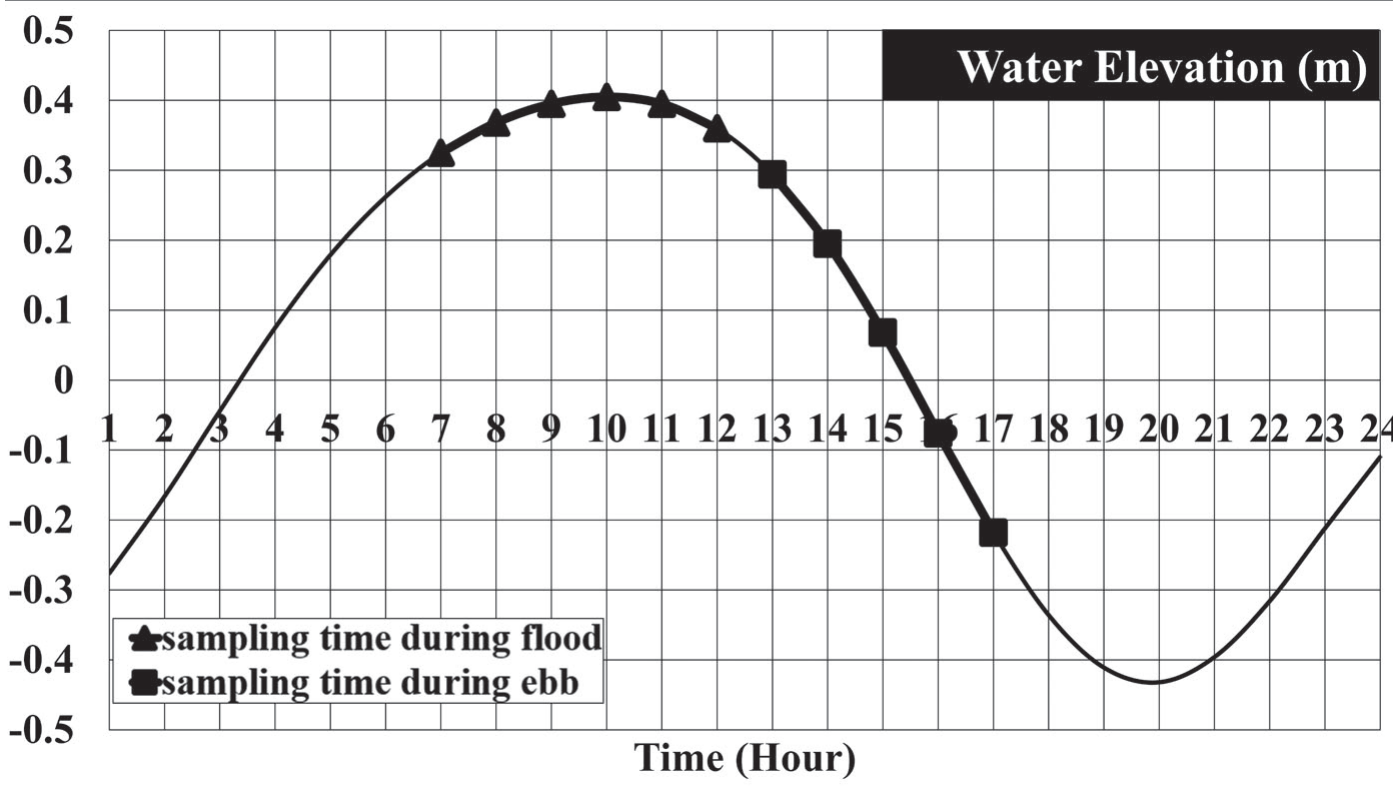
The observations were conducted on October 14, 2021. This study focused on eight stations in the Balikpapan Bay (Fig. 1). The in-situ measurements and sample collection were performed at each station during the flood (07.00-12.00 local time) and ebb tides (13.00-17.00 local time) (Fig. 2).
The Conductivity Temperature Depth (CTD) profiler ALEC ASTD 678 and electromagnetic current meter (ECM) were vertically lowered at eight stations to measure temperature, salinity, turbidity, chlorophyll-a fluorescence, depth pressure, and current speed. The accuracy ranges of temperature, salinity, turbidity, chlorophyll-a fluorescence, and depth pressure were –3-45ºC, 2-42 PSU, 0-1000 NTU, 0-0.4 ppm, and 0-600 m, respectively. The current speed accuracy ranged from 0 to 500 cm·s−1 and from 0° to 360° for the direction. The CTD and ECM were set to record data every 0.5 seconds.
The 3.5 l Nansen bottle was used to collect surface water samples from eight stations. Then, 2 l water was placed in the bottle for laboratory analysis of nitrate (NO3–N), phosphate (PO43−), and ammonia (NH3).
A 30-micron plankton net with was used to filter 10,000 ml of water to a volume of 60 ml. The plankton sample was placed in a bottle and stored in a cool box.
In this study, all surface water parameters were analyzed, which included ocean dynamics (current speed and direction), physical parameters (temperature and turbidity), chemical parameters (salinity, nitrate (NO3–N), ammonia (NH3–N), and phosphate (PO43−)), and biological parameters (phytoplankton abundance and chlorophyll-a fluorescence).
Fig. 1a).
Bathymetry map of Balikpapan Bay and its surrounding area. The sampling station shows in gray-black dots, Center Nusantara City, Penajam Paseur Utara Regency, Kutai Kartanegara Regency, and Balikpapan City are offered in a solid black box, Sepaku, Semoi, Wain, and Riko Rivers are shown in a solid black triangle. b) The inset map is the area of Indonesia, with the study area indicated by a white box.
Plankton and Nutrient Sample Analysis
Plankton and nutrient (NO3–N, NH3–N, and PO43−) samples were analyzed at the water quality laboratory belongs to Samarinda Industrial Research and Standardization Centre, Ministry of Industry of the Republic of Indonesia. Phytoplankton samples were identified under a light microscope using a Sedgwick Rafter Counter Cell (SRCC), where cell morphology and color were observed. In addition, cell counts were analyzed for abundance and biodiversity data. Phytoplankton species were identified according to Indonesian standard method SNI 06-3963-1995. This method is equivalent to the standard methods for examining water and wastewater part identification of the type and counting phytoplankton abundance part 1002 F.2 [29].
The nitrate (NO3–N) concentration was measured using a spectrophotometric method. The Brucine method was applied using a spectrophotometer at a wavelength of 410 nm. This study followed the Indonesian standard method for measuring nitrate concentrations in open water SNI 06–2480–1991. The procedure was similar to the standard method for examining water and wastewater part 419D [30]. Ammonia (NH3–N) was analyzed using the indophenol blue method with a spectrophotometer at 640 nm. These steps were based on the Indonesian standard method for measuring ammonia concentration in open seawater (SNI 19–6964.3–2003). This technique was adopted in the standard method for examining water and wastewater Part 3112 [31]. Subsequently, the phosphate (PO43−) concentration was analyzed using the ascorbic acid method with a spectrophotometer at a wavelength of 880 nm. This procedure was based on the Indonesian standard method for measuring phosphate concentrations in open water and wastewater (SNI 06–6989.31–2005). The SNI 06–6989.31–2005 standard is equivalent to the standard methods for examining water and wastewater [32].
Data Analysis
Phytoplankton Composition and Abundance
Phytoplankton abundance was calculated using the Sedgwick-Rafter chamber method [33]. The concentration of cells per liter was calculated using Equation (1) [31].
Where N is the abundance of phytoplankton (cells·l−1), Vd is the initial volume of filtered water (l), Vt is the volume of filtered water (ml), Vs is the water volume in the Sedgwick River after counting cells (ml), and P is the number of observed phytoplankton individuals (cells).
Phytoplankton Diversity
Phytoplankton diversity was analyzed using the Shannon Wiener (H') index [34] and Sampson′s index (C) for species dominance [35]. Both H' and C are expressed in Equations 2 and 3, respectively.
where ni is the number of individual species i, and N is the total number of individuals per station.
Bray-Curtis differences were used to calculate the abundance and diversity of phytoplankton at each station during ebb and flood tides:
Where Cij is the sum of the lower counts of each species found at both sites; Sj is the total number of specimens counted at site j, Sj is the total number of samples counted at site i, and i,j are the two observation sites.
Principal Component Analysis
Principal component analysis (PCA) was used to evaluate the relationship between the ocean dynamics, physical, and chemical parameters of marine water and the abundance and diversity of phytoplankton. This analysis identified the vigorous physical and chemical parameters that affected the abundance and diversity of phytoplankton at all observation stations during ebb and flood tides. The XLSAT 2019 v.3.2 software is used to perform PCA.
Results
Water Quality Parameters and Ocean Dynamics
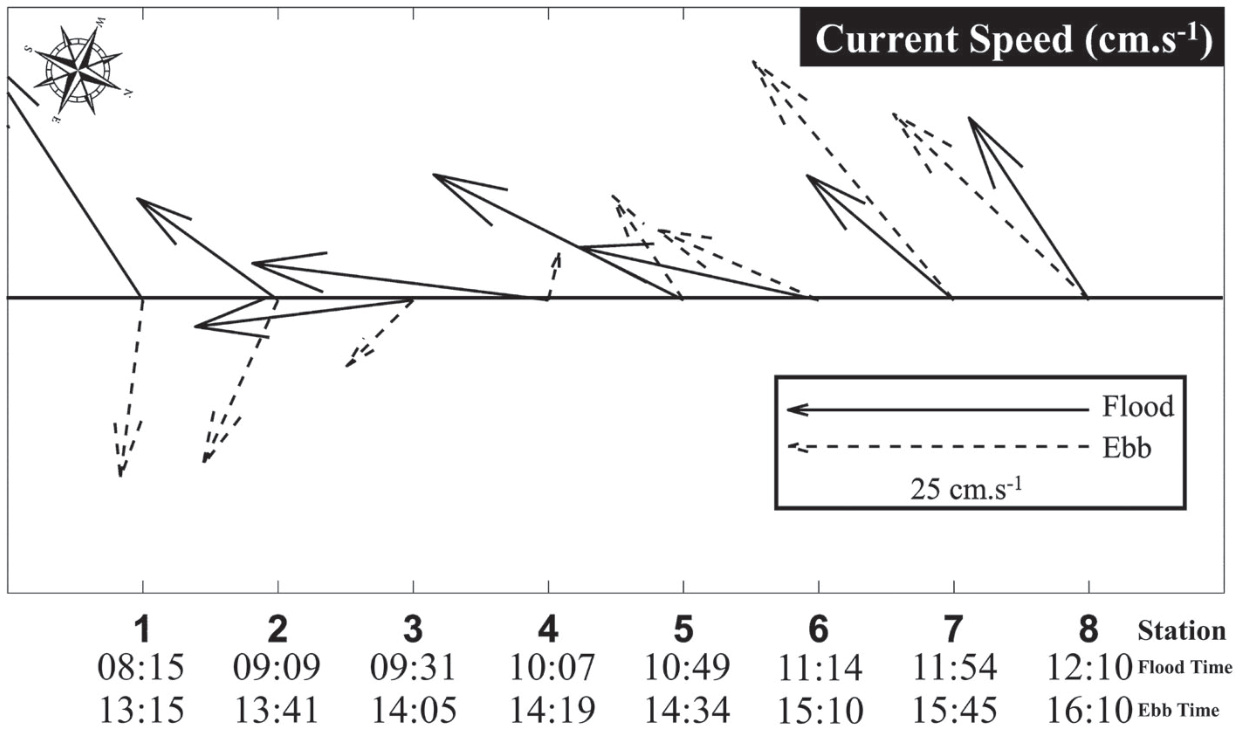
The Balikpapan Bay area in general can be divided into three sub-areas, that is downstream (S1, S2, and S3), middle (S4, S5, and S6), and upstream (S7 and S8). The average sea surface current velocity was 0.022±0.101 m·s−1 (0.088±0.069 m·s−1) for the u-component and -0.079±0.062 m·s−1 (-0.177±0.075 m·s−1) for the v-component during flood (ebb) tides. The highest and lowest current speeds were observed at S4 in front of the Riko and Wain Rivers. The highest is 0.27 m·s−1 southward during the flood, and the lowest is 0.04 m·s−1 westward during the ebb. In the upstream and some of the middle sub-areas, the surface current direction is almost similar during flood and ebb tides. Meanwhile, in the downstream sub-areas, the surface current direction was significantly different and almost in the opposite direction, namely southwestward during flood and southeastward during ebb tide. However, at all stations, the path moved permanently downstream (Fig. 3). The lower dominance of tidal effects during the neap tide may have caused this movement. Thus, river discharges were more dominant than tides during neap tide, especially in the upstream and middle sub-areas.
Water quality parameters measured in Balikpapan Bay are shown in Fig. 4. The average temperature, salinity, turbidity, and concentration of chlorophyll-a, nitrate, ammonia, and phosphate during flood (ebb), respectively are 29.89±0.28°C (30.47±0.32ºC), 28.28±2.24 PSU (27.41± 1.76 PSU), 5.24±1.8 NTU (4.91±1.7 NTU), 44.83±14.4 ppm (43.68±14.8 ppm), 0.368±0.21 mg·l−1 (0.352±0.13 mg·l−1), 0.004±0.004 mg·l−1 (0.023±0.054 mg·l−1), and 0.003±0.002 mg·l−1 (0.002±0.002 mg·l−1. The standard deviation revealed that variations during the flood and ebb tides were generally the same. Variations during floods and ebbs exhibited spatially similar patterns. These patterns indicate that the water quality during the flood and ebb tides did not change significantly. This state may prevent the dynamically driven current from being dominated by tides during the neap tide.
The sea surface temperature (SST) ranges from 29.59ºC to 30.56ºC during flood tides and 29.85ºC to 30.97ºC during ebb tides. The bay SST in the downstream and middle sub-areas was higher during the ebb tide and lower during the flood periods. However, in the upstream sub-area, there is almost no gap. The differences in the SST in the downstream, middle, and upstream sub-areas were approximately 0.90ºC, 0.52ºC, and 0.15ºC, respectively. The sea-air interactions likely caused the difference in SST during flood and ebb tides. The measurements were performed in the morning during flood tide, while the ebb tide occurred in the afternoon. The effect of sunlight dominantly influenced the SST. However, the stations located in front of the river (S4), near the floating settlement (S5), and under the vast bridge (S7 and S8) had small SST gaps, with values lower than the other stations. The direct effects of various water inputs and the amount of protection from sunlight might have contributed to these conditions.
The sea surface salinity (SSS) gradually decreased from downstream to upstream, from approximately 33.00 PSU (30.20 PSU) in the downstream sub-area, 28.30 PSU (27.70 PSU) in the middle sub-area, and 24.70 PSU (24.40 PSU) in the upstream sub-area during the flood (ebb) tide. The SSS during the flood tide was always higher than during ebb tide at all stations. This finding indicates that the effect of the tidal cycle on SSS persisted. However, the difference was moderate.
The differences in SSS during the flood and ebb tides in the downstream, middle, and upstream sub-areas are 1.23, 0.53, and 0.8 PSU, respectively. The SSS gap in the downstream sub-area was relatively high. This condition may have caused the seawater during the flood in the morning and the freshwater effect during the ebb tide in the afternoon. As seen in Fig. 2 and Fig. 3, SSS in S1 during the ebb tide measured at 14:10 local time with a decreasing water level. Thus, a freshwater effect was induced until S1. In contrast, the SSS differences between flood and ebb tides in the upstream sub-area were relatively small. This condition corresponds to a surface current variation that mostly flows southward but at a greater speed during ebb tide. Therefore, the influence of fresh water is more dominant and lowers SSS. However, along the middle to upstream sub-areas, SSS at S7 is the lowest, which is also related to surface current during ebb tide. At S7, the surface current speed during ebb tide is the highest; therefore, the influence of fresh water from the Semoi and Sepaku Rivers is stronger compared to S8.
The turbidity from upstream to downstream sub-areas is almost steady during both ebb and flood tides. However, at station S4 a significant increase was found, from approximately 4 to 7 NTU. This increase occurred during flood tide and is likely due to the interaction between tidal current and river flow, which potentially lifts the sediment in front of the shallow and muddy Riko River.
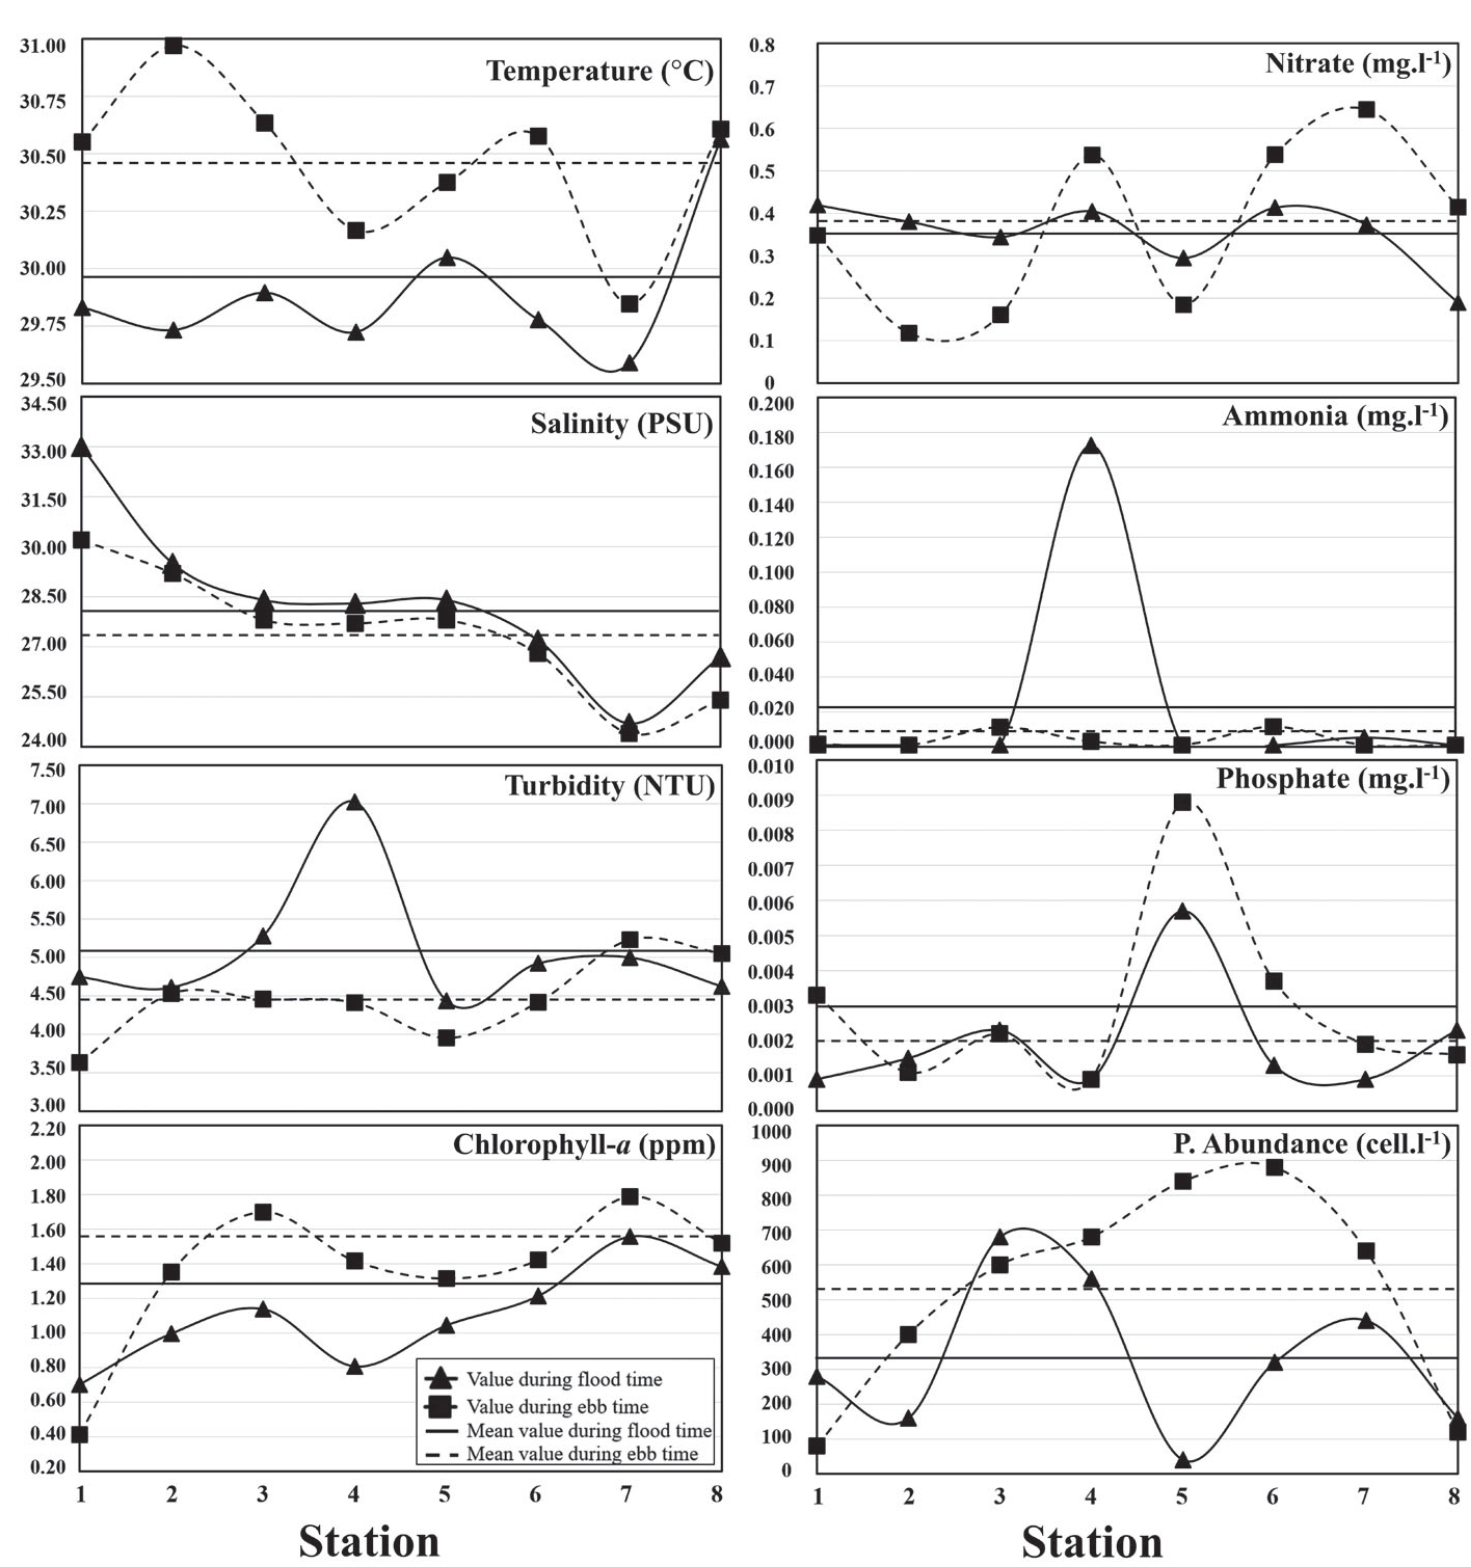
Nutrients (nitrate, ammonia, and phosphate) exhibited unique patterns. However, only nitrate showed a significant difference between flood and ebb tides. The nitrate concentration during ebb tide was significantly above the average in S4 (0.53 mg·l−1), S6 (0.54 mg·l−1), and S7 (0.65 mg·l−1), which means that these areas received more input from the rivers. In the downstream sub-area, the nitrate concentration during ebb tide is lower than during the flood tide due to significant differences in the surface current direction. The interaction between tides and river runoff spread nitrate concentrations throughout this sub-area.
Ammonia exhibited different patterns. Plateaued, from downstream to upstream. Ammonia concentrations at each station during the ebb and flood periods were almost similar, except at S4. The highest ammonia concentration of 0.17 mg·l−1 was observed at S4 during the ebb tide; meanwhile, the concentration at other stations was approximately 0.001 mg·l−1. We found that high concentration of ammonia at S4 was strongly associated with high turbidity observed at that station. Phosphate showed a persistent pattern during ebbs and floods at all stations. The highest concentrations were recorded at S5, with values of 0.009 mg·l−1 during the flood tide and 0.006 mg·l−1 during the ebb tide. The other stations varied from 0.0009 mg·l−1 to 0.0037 mg·l−1. S5 is in the vicinity of floating fishing settlements, which are thought to be the source of high phosphate concentration.
Chlorophyll-a concentration gradually increased from downstream to upstream, varying from 0.41 ppm to 1.52 ppm during the flood and 0.70 ppm to 1.38 ppm during the ebb tide. On average, the chlorophyll-a concentration during flood tide was lower than ebb tide and increased from downstream to upstream sub-areas. The differences in concentration during flood and ebb tides in the downstream, middle, and upstream sub-areas were approximately 0.21 ppm, 0.36 ppm, and 0.18 ppm, respectively. The chlorophyll-a concentrations in the downstream and upstream sub-areas were lower than that in the middle sub-area. Generally, the concentration of chlorophyll-a is related to phytoplankton abundance. However, this is not well illustrated from observations. The correlations between the chlorophyll-a concentration and phytoplankton abundance during the flood and ebb tides were 0.001 and 0.5, respectively. This condition revealed that chlorophyll-a concentration could be used as a proxy for phytoplankton abundance only during the ebb tide. Meanwhile, it failed as a proxy during flood tide as shown in Fig. 4.
Structure of Phytoplankton Community in Balikpapan Bay
The phytoplankton community in Balikpapan Bay consisted of 12 species with two classes during flood tide and 13 species with three classes during ebb tide (Fig. 5). The class identified during flood were Bacillariophyceae (diatoms) (93.94%) and Dinophyceae (6.06%). In contrast, diatoms (88.68%), Dinophyceae (9.43%), and Chlorophyceae or green algae (1.89%) were identified during ebb. The diatom was the most dominant class both during flood and ebb tides, with 10 species, of which three potentially caused HAB. The species identified were Chaetoceros sp., Nitzschia sp., and Pseudo-nitzschia sp. The composition of these three species was 42.5% during the flood and 21.6% during the ebb tide. The Dinophyceae class consists of two species that have the potential to cause HAB, namely Ceratium sp. and Dinophysis sp., with a total composition of 6.0% during flood and 9.4% during ebb. The green algae class existed only in Balikpapan Bay during ebb, with only one species, Spirogyra sp. (1.9%). Known as a freshwater saline algae, Spirogyra sp. has probably been transported by the river flow to Balikpapan Bay. This state was also observed for S4 (Table 2), which is in front of the Riko and Wain Rivers.
Phytoplankton Abundance and Diversity in Balikpapan Bay
The average phytoplankton abundance was 85±79 cells·l−1 during flood, and 125±133 cells·l−1 during ebb. This indicates that phytoplankton abundance varied significantly, with approximately 40 cells·l−1 to 680 cells·l−1 during flood and 80 cells·l−1 to 880 cells·l−1 during ebb. The highest abundance was observed at S4 (680 cells·l−1) during flood, and S6 (880 cells·l−1) during ebb. The lowest abundance was observed in S5 (40 cells·l−1) during flood and S1 (80 cells·l−1) during ebb. This finding indicates that during ebb tide, the abundance is more varied compared to flood tide.
Individual abundance varied among the 40 cells·l−1 to 480 cells·l−1 in each station. During the flood tide, only one species phytoplankton was identified in S1, namely Ceratium sp. However, Ceratium sp. was observed also in S4 and S6 but only during ebb tide. The species that was observed at almost all stations was Cyclotella sp., except in S1. Furthermore, the species that only existed once at S6 were Gyrosigma sp. and Nitzschia sp., while in S7, Pseudo-nitzschia sp. was observed.
The highest abundance species over stations was Cyclotella sp., with a total abundance of 2,000 cells·l−1. The lowest abundance was Ceratium sp. with a total abundance of 40 cells·l−1. The species with the highest number of cells were Chaetoceros sp. (760 cells·l−1) and Dinophysis sp. (360 cells·l−1).
Generally, the phytoplankton species and abundance change more significant during the ebb tide. The abundance in S1 included four species with a total of 320 cells·l−1. S1 had only one species during the flood tide with an abundance of 40 cells·l−1. S5 contained only one species, with an abundance of 40 cells·l−1. Nitzschia sp. was not present during the flood tide. Overall, the highest abundance at all stations was observed for Chaetoceros sp. and Cyclotella sp., with total abundances of 720 cells·l−1 and 720 cells·l−1 respectively.
Fig. 5.
Percentage of phytoplankton class a) and species b) in Balikpapan Bay during flood and ebb on neap tide.
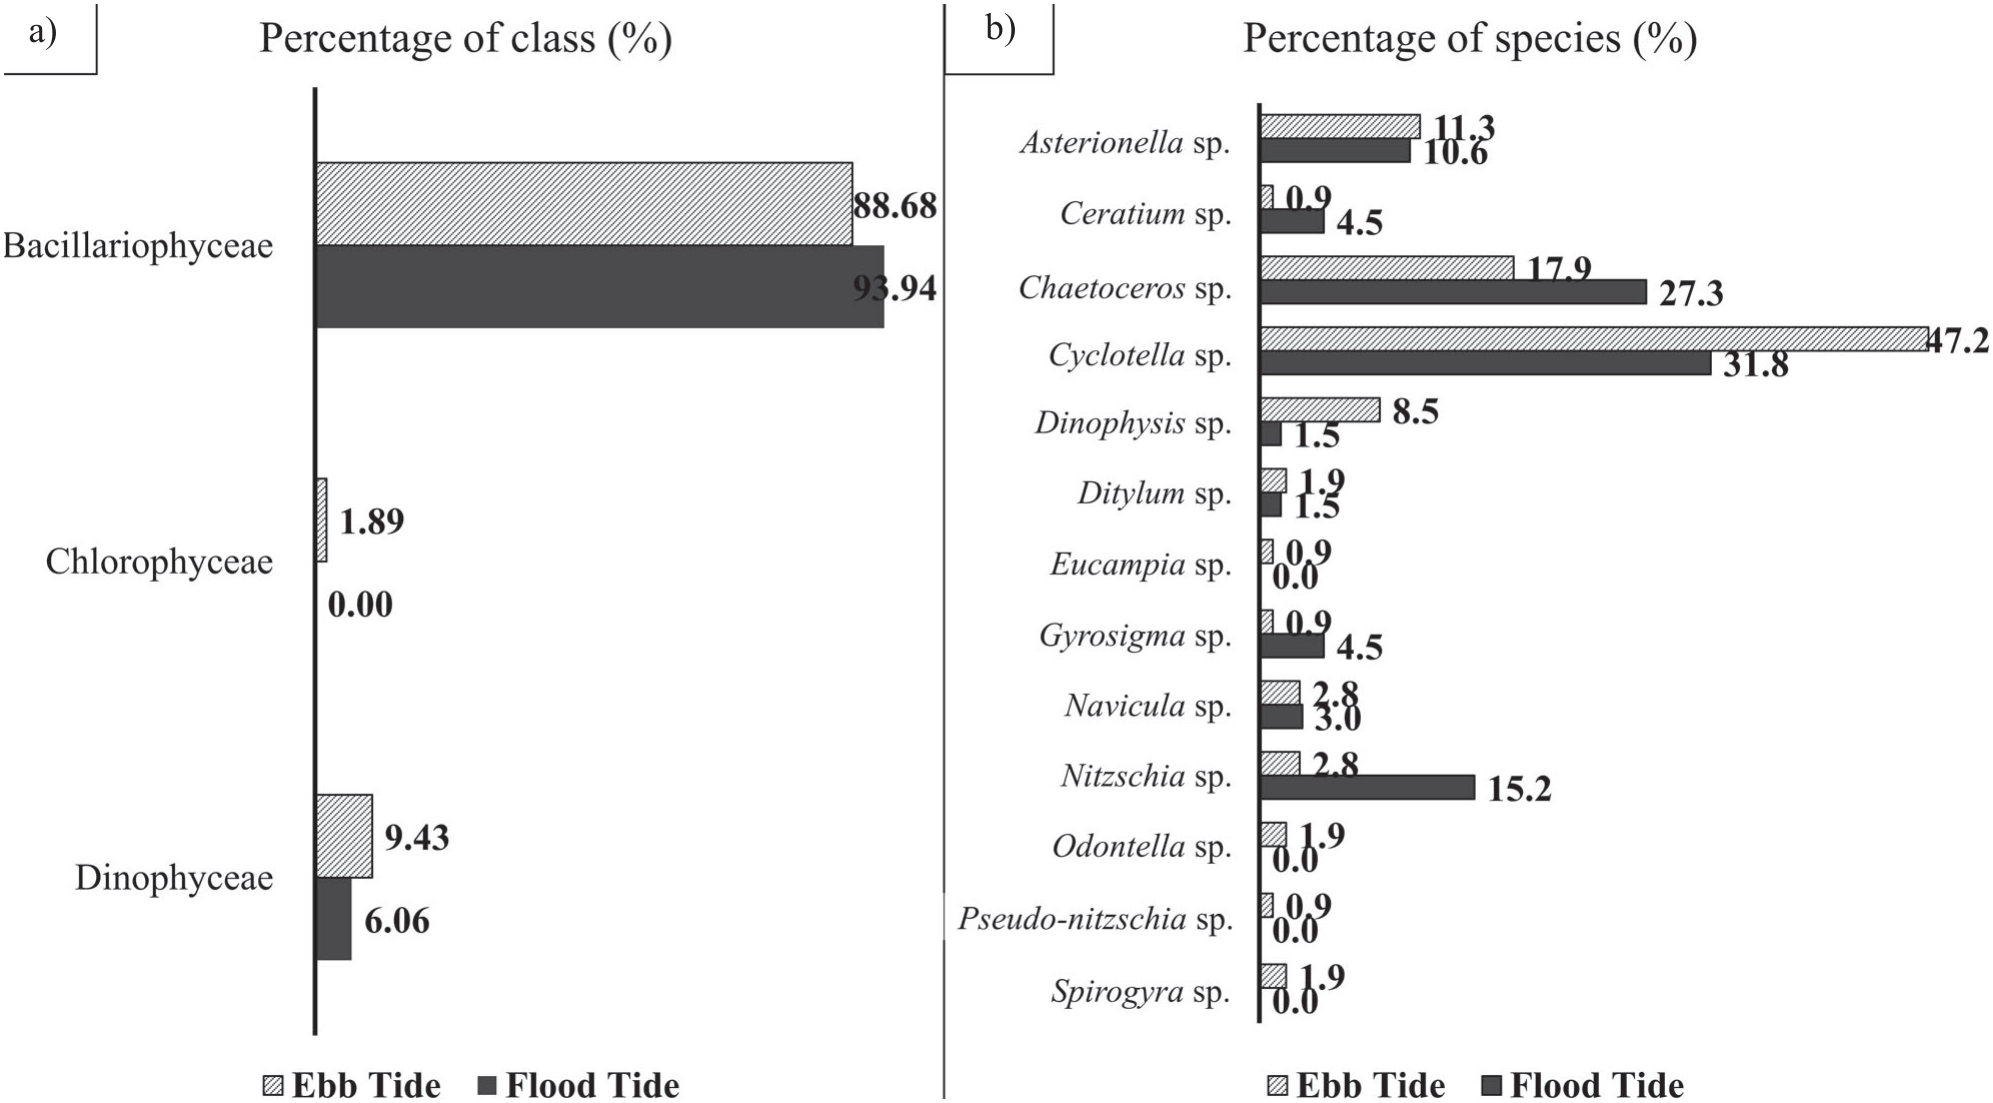
Table 1.
Phytoplankton species abundance in Balikpapan Bay during flood and ebb on neap tides.
The phytoplankton diversity index (H′) was generally greater than 1 for both flood and ebb tides, except in S1 during flood and ebb tides and S5 during ebb tide only (Fig. 6). This result indicates that phytoplankton diversity in the Balikpapan Bay is low and has a small community size. The dominance index (C) indicates that there are dominant species (C>0.5) found at S1 and S7 during both flood and ebb tides, and S5 during the ebb tide only. The stress quality also might affect the survival of phytoplankton species.
Relationships between Seawater Parameters and Phytoplankton Abundance and Diversity
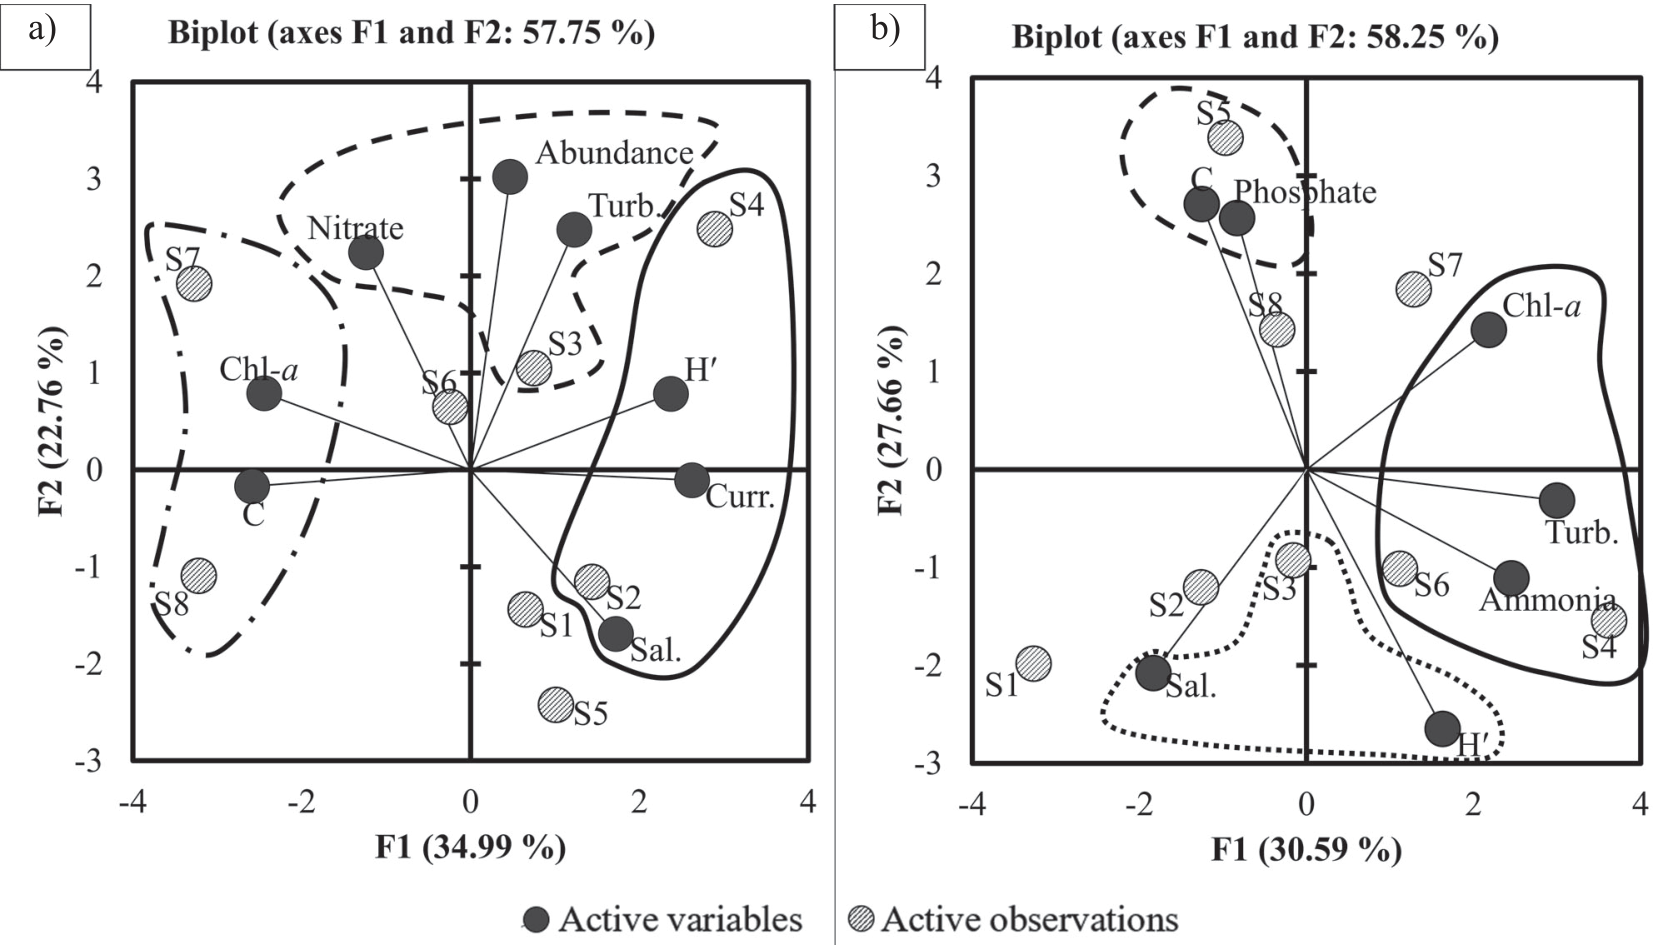
Based on PCA, cumulative eigenvalues of 57.75% (58.25%) during flood (ebb) tides and a variable minimum of 0.5 squared cosines illustrated that there were three groups of data observed. The three groups were in axes F1 and F2, positive for both flood and ebb tides, F1 was negative at flood tide, and F2 was negative at ebb tide (Fig. 7). The first group included S4, S2, salinity, current speed, and H′ during flood tide, and S4, S6, ammonia, turbidity, and chlorophyll-a at ebb tide. This finding is shown in Fig. 7 as a solid black line. The dash line represents the second group, consisting of S3, turbidity, phytoplankton abundance, and nitrate concentration during flood tide and S5, phosphate concentration and dominance index during ebb tide. The dot dash line marks the third group, which consists of S7, S8, chlorophyll-a, and dominance index during floods (Fig. 7a). The dot line consists of S3, salinity, and diversity index (Fig. 7b) during ebb tide.
Fig. 6.
Phytoplankton diversity (H′) and dominance (C) indexes during flood and ebb at neap tide at Balikpapan Bay.
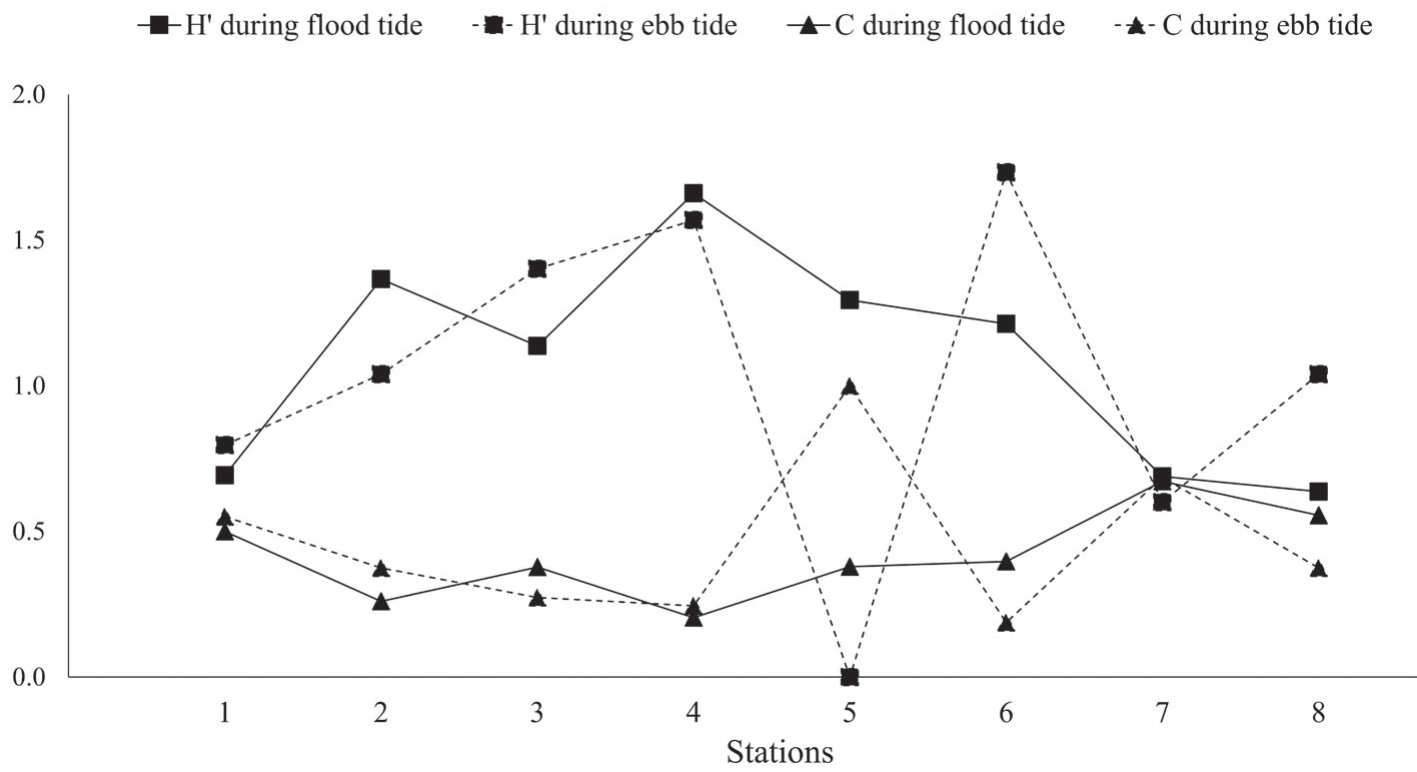
Fig. 7.
Correlation between physical parameters with phytoplankton abundance at Balikpapan Bay during the flood a) and ebb b) on neap tide.
Dissimilarity analysis was performed based on the Bray-Curtis dissimilarity index (Fig. 8), which was determined by the diversity (H′) and abundance of phytoplankton at all stations for each flood and ebb tide. The results were significantly similar to those of the strong flood and ebb tides. A dendrogram of the eight observation stations is shown in Fig. 8a) during flood and Fig. 8b) during ebb. The three classes (C1, C2, and C3) obtained from the analysis showed a similarity level of approximately 96.50% (93.25%) during flood (ebb) tides.
Fig. 8.
Bray-Curtis′s dissimilarity index of phytoplankton abundance and diversity (H′) at Balikpapan Bay during the flood a) and ebb b) on neap tide.
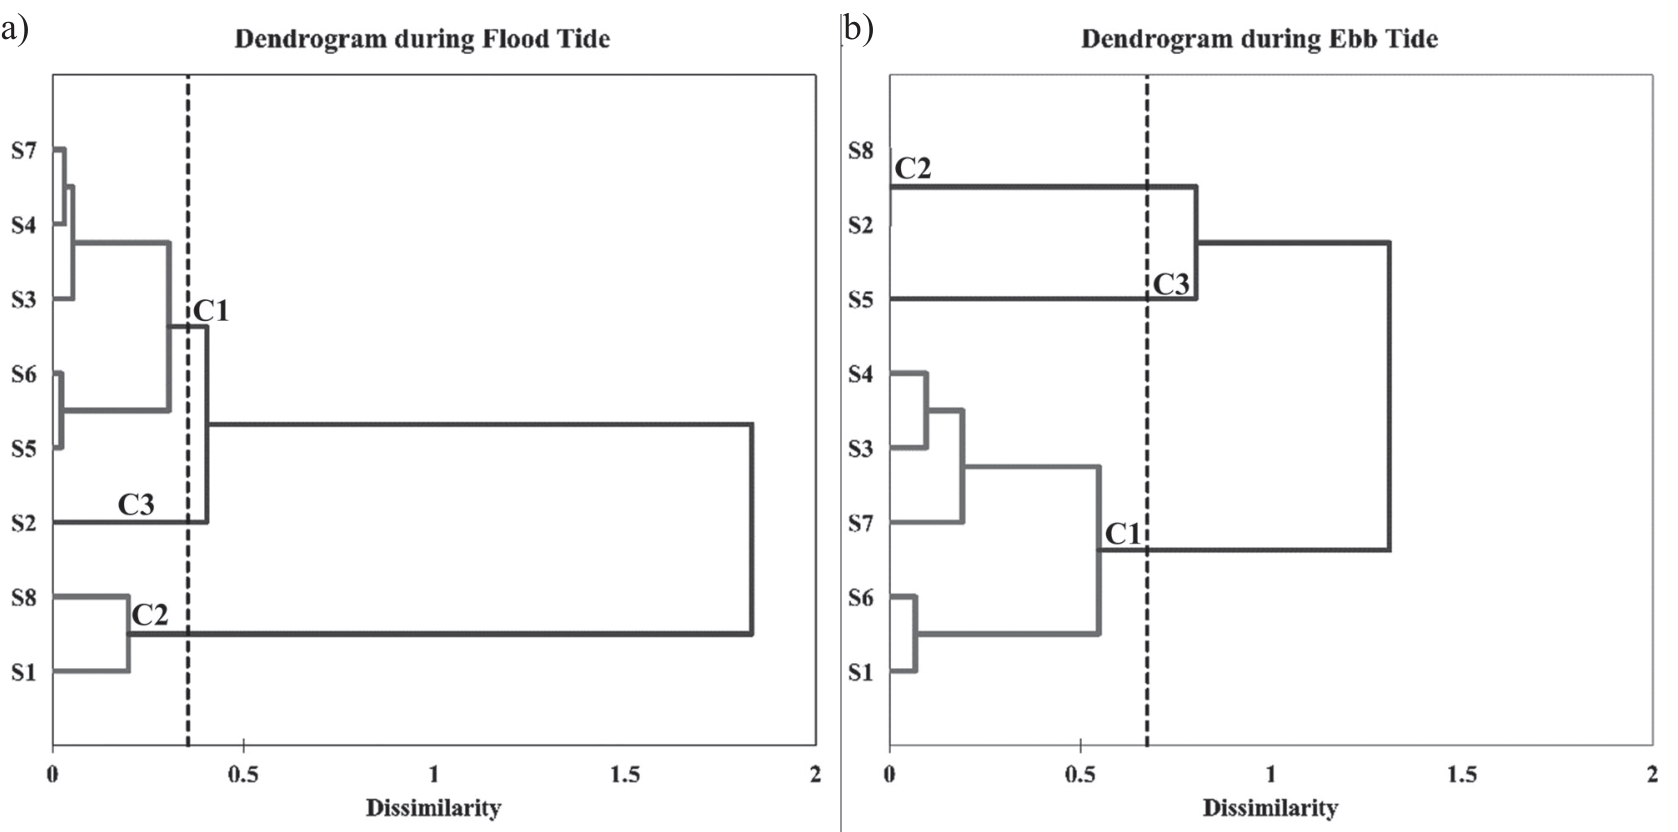
The highest values were observed in C1 during the flood tide (98.02%) and C2 during the ebb tide (100%). The C2 class followed this trend during the flood (96.95%) and C1 during the ebb (94.52%) tides. The lowest values were observed for C3 (95.96%) and ebb (91.98%) tides. During the flood tides, C1 class was observed in S1 and S8. The C2 class was found in S3, S4, S5, S6, and S7. The next class was C3 in S2. During ebb tide, the C1 class was found in S1, S3, S4, S6, and S7. The C2 class was found in S2 and S8. The last class was C3, which was found in S5. These results are highly similar in almost all stations. Environmental conditions influenced the similarity of the source of phytoplankton diversity (H′) and abundance in Balikpapan Bay.
Discussion
Generally, as a dynamic parameter during ebb and flood tides, sea surface current shows insignificant change during neap tide. Meanwhile, in the spring tide, surface current speed and direction change significantly between flood and ebb tides. This situation is consistent with previous findings for Balikpapan Bay [1, 4-7, 27, 28, 36]. The variability in ocean water quality and phytoplankton abundance followed ocean dynamics. Thus, the temperature, salinity, turbidity, chlorophyll-a, and nutrients did not change significantly during the flood and ebb on neap tide. This condition is common in estuaries.
The SST and SSS ranges agreed with those of other studies conducted in Balikpapan Bay [1, 27]. It ranges from 29ºC to 31ºC and 24-33 PSU, respectively. The SST increases from downstream to upstream sub-areas during the flood tide and vice versa during ebb tide [27]. In comparison, the SSS decreased from downstream to upstream sub-areas extent for both flood and ebb tides. This condition is suitable for phytoplankton to grow in tropical seawater and is affected by freshwater [11, 37].
The turbidity in Balikpapan Bay is relatively high. Water clarity decreases from downstream to upstream sub-areas [38]. This decrease mainly occurred due to a high supply of suspended material from the mainland transported by the river and ending in the bay [39]. The turbid water potentially disturbed the phytoplankton photosynthetic process and interrupted the growth rate. This condition is often observed in tropical estuarine waters [11, 12, 37, 40].
The nitrate, ammonia, and phosphate concentrations varied in time and space, with higher concentrations at the river mouth, tending to decrease near the open ocean. Note that increasing nitrate and phosphate concentrations can affect phytoplankton growth [11, 12, 41, 42].
Thirteen phytoplankton species classified into three groups were identified in Balikpapan Bay. The number of species was similar to that reported in [21] but differed in their names. Budiarsa and Rafii [21] found more Chrysophyceae species, whereas the present study identified more Bacillariophyceae. Differences in sampling areas probably caused this result. Sampling was conducted at three locations in Balikpapan Bay, from the outside to the inside of the bay. Furthermore, the Bacillariophyceae class is thought to be more tolerant of fluctuations in the water quality [12].
The phytoplankton abundance in Balikpapan Bay was up to 900 cells·l−1. This value was higher than that reported in [21]. The most abundant phytoplankton species were Chaetoceros sp. and Cyclotella sp. from the diatom class. During both flood and ebb tides their percentage was larger than 20%. This condition differs from that reported in [21], which was dominated by the Chrysophyceae class. Meanwhile, the Chrysophyceae class was not found in this study.
The PCA results showed a significant correlation between water quality parameters and phytoplankton abundance, diversity, and dominance. Water quality parameters included temperature, salinity, turbidity, nitrate, ammonia, phosphate, and chlorophyll-a concentrations. Freshwater discharge affects environmental parameters and changes the distribution of phytoplankton abundance, diversity, and dominance. The diversity index of phytoplankton in Balikpapan Bay can categorized as moderate, which was thought to be caused by the estuarine area. The diversity index was observed both during flood and ebb on neap tide.
The abundance of phytoplankton increased from downstream to upstream sub-areas, where this location had influential parameters, such as chlorophyll-a during flood and nitrate during ebb. Turbidity reduces the quantity of phytoplankton in Balikpapan Bay. This state reduces sunlight for phytoplankton photosynthesis [43]. Based on the distribution of phytoplankton and its relationship with water quality, phytoplankton abundance, diversity, and dominance are related to the ocean water mass dynamics during flood and ebb tides, though it was small during the neap tide.
Conclusions
The water mass dynamics in the Balikpapan Bay during flood and ebb tides led to a stable diversity (H′), dominance (C), and the similarity indexes of phytoplankton. Results shows that the average value of H′ is 1.08±0.35 (1.02±0.53), C is 0.42±0.14 (0.46±0.25), and similarities are 96.50% (93.25%) during flood (ebb). The range of abundance more varied during ebb tide, with the most dominant species is Cyclotella sp. (diatom class), whose percentage during flood (ebb) was 31.8% (47.2%). PCA showed that salinity, temperature, turbidity, current speed, and chlorophyll-a were significant factors in Balikpapan Bay. This condition also indicates that the H′ and C of phytoplankton are influenced by current speed and chlorophyll-a concentration, with different salinity and turbidity or H′ and temperature for C. Thus, the dynamics of water mass conditions are critical factors in phytoplankton diversity and abundance dynamics in Balikpapan Bay.

