

Introduction
Chemical fertilizers confer a significant impact to crop production and about 55% of the increase in food production is directly linked to fertilizer application in developing countries [1-3]. Declining soil fertility is one of the barriers to sustainable agricultural production in subtropics mostly prevailing in this region. Possible reasons of the decline in soil fertility include inappropriate land use systems, mono-cropping, intensive cultivation, imbalanced fertilization, especially low applications of P and K, deficiencies of secondary and micronutrients, low soil organic matter, soil degradation and inappropriate irrigation water. Nevertheless, soils of this region are inherently low in macronutrients like nitrogen (N) and phosphorus (P) and micronutrients, particularly zinc (Zn) and iron (Fe) [4]. However, crop response to fertilizer application is inconsistent owing to various reasons [5]. Higher crop production along with lower environmental footprints can be achieved by improving fertilizer use efficiency and decreasing losses of applied fertilizers to agroecosystem.
Besides other mineral nutrients, nitrogen (N) is the most yield limiting nutrient in crop production under the most agro ecological conditions [6, 7]. It accounts for nearly 80% of the total mineral nutrients absorbed by the field crops [8]. The chemical N fertilizers are applied to meet crop demand and enhance the global food production as much as 30-50% [2, 3]. The global fertilizer demand has therefore surged to 6.67% between 2016-2022 [8]. Urea is the most commonly used N fertilizer during the past four decades (73.4% of the N fertilizers) [10, 11]. However, the dynamic nature of urea and other N fertilizers makes it susceptible to environmental losses; causing 70% losses of applied N as NH3 volatilization, nitrification-denitrification, nitrate leaching and runoff [12]. Therefore, effective fertilizer management is required to sustain N availability in the soil-plant system. The earlier studies reported 50% N losses as NH3 volatilization [13], 30% as NO3 leaching/ runoff [14] and >30% as denitrification [15]. The crop plants utilize only 30-60% of applied-N as urea [14,16] and hence N use efficiency (NUE) of crops varies accordingly [14,16,17]. The low NUE could lead to economic losses to farmers as well as environmental hazard. Therefore, efficient management of N fertilizer is crucial in respect of farmer economy and environmental sustainability [6].
The farmers prefer applying primary nutrients due to their enormous yield contribution while show little interest to the secondary and micronutrients due to their predominant role in quality traits. Among the micronutrients, zinc (Zn) is essential for plants, animals and humans. The paucity of dietary Zn has been quite common in developing countries since the past century and it is now recognized as the 5th leading risk factor in developing Asian countries. Its deficiency has affected almost 33% of the human population, typically, the non-urban communities and has resulted in almost 116,000 deaths per year worldwide [18, 19]. The soils in this region are mostly alkaline calcareous, exhibit Zn deficiency (<0.5 mg Zn kg-1 DTPA-extractable) [20, 21], and disturb physiological processes of plant [22]. The Zn fertilization improves crop yields and increases Zn concentration in crop produce [19]. However, the availability of applied-Zn is severely affected in alkaline calcareous condition due to rise in soil pH above 5.5 [23]. The major reason of Zn deficiency in cultivated soils is attributed to low solubility of Zn containing minerals in alkaline soil [24]. Other factors limiting Zn supply in soil include low Zn bearing minerals, very low or high organic matter (<0.5 to >3%, respectively), soil alkalinity, water-logging, lime content, cations (Mg+2, Na+1, Ca+2, etc.) and higher phosphate content in soil [25]. The low Zn availability decreases quality of food crops, especially wheat and rice which contain less amount of Zn to meet the demand of human body [8]. Therefore, biofortification strategy is gaining more attention as being economical, immediate and effective in improving micronutrient status of food crops.
Zinc is conventionally applied through soil as zinc sulfate heptahydrate (ZnSO4.7H2O) [26]; which is not economical for small farmers. Moreover, uniform distribution and crop utilization of Zn-fertilizer remains very low when a little amount of fertilizer is conventionally applied to larger surface area under field condition [27]. The problem is further aggravated due to lack of farmers’ interest in spending labor charges on Zn application merely to improve qualitative traits of crop. Hence, the incorporation of micronutrients with macronutrient fertilizers, especially bioactive zincated urea (ZU) seems viable approach to address Zn deficiency while the split application of ZU further enhance its uptake. The fertilizer industry in Pakistan intended to produce bioactive zincated urea, which would supply Zn along with the mineral N without additional expenses on fertilizer application.
Coating materials generally provide physical barrier on the surface of the fertilizer granule and control instant dissolution of the fertilizer [28]. Many of these materials are costly, non-resilient, and do not offer any additional benefits to the soil or plants [29, 30]. Micronutrients coating such as Zn salts using dry/wet coating procedure and solution dispersion technique have been reported in the literature [23]. For coating urea, zinc sulfate monohydrate (ZnSO4. H2O; 33% Zn) and zinc oxide (ZnO; 80% Zn w/w) have been used successfully [26, 31]. Although, ZnO is relatively economical source with higher Zn content; its direct use in calcareous soils is inefficient due to its insolubility. Different Zn solubilizing bacterial (ZSB) strains could help solubilize this insoluble Zn [32, 33]. The available Zn concentration due to solubilization activity of ZSB strains is named as bioactivated Zn which has higher Zn use efficiency than the conventional ZnSO4 fertilizers [34, 35]. The higher zinc and nitrogen supply from Zincated-urea may result in the higher productivity and quality of field crops. Therefore, the present investigation was aimed at studying the relative efficiency of bioactive zincated-urea for nitrogen use efficiency and zinc biofortification in rice and maize crops grown under field conditions.
Materials and Methods
Field studies regarding evaluation of bioactive zincated urea for NH3 volatilization, crop growth, zinc accumulation by grains and grain yield of maize and rice were conducted at experimental farm area of Nuclear Institute for Agriculture and Biology (NIAB), Faisalabad.
Description of the Study Area
The experimental farm is located at 31°23′54.8″N and 73°02′02.1″E with an elevation of 184 mm above sea level. Mean rainfall in the study area ranges between 300-350 mm annually [36], whereas mean monthly temperature goes as high as 48ºC in June and drops down to 4.8ºC in January. According to World Reference Base (WRB) soil system, the studied soil is classified as Calcisol with protocalcic nature. The soil is also considered as Aridisol because of ecological phenomenon of the region having low rainfall and extreme temperature.
Before sowing of crops, composite soil sample were collected from 0-15 cm soil depth and were air-dried, ground to pass through a 2-mm sieve for analysis of different physicochemical properties (Soil texture, EC, pH, OM, N, Zn, P2O5, K2O). The experimental soil was alkaline in reaction (pHs 7.64), non-saline (electrical conductivity 2.89 dS m−1), low in organic matter (0.9%) and deficient in plant-available nutrients; i.e. Mineral N (9 mg NO3 kg soil) Olsen P (12.33 mg kg−1 soil, (NH4-OAc extractable K (120 mg kg−1 soil) and AB-DTPA Zn (0.37 mg kg−1).
Experimental Treatments
There were four treatments, comprising of commercial urea (CU) and Bioactive Zincated urea (ZU) which were arranged in RCBD with three replicates. The experimental treatments included:
– T0 = Control (No nitrogen)
– T1 = Commercial Urea (CU) @ 160 kg Nha-1(for maize) and 125 kg Nha-1 (for rice)
– T2 = Commercial Urea (CU) + Soil zinc application (equivalent to 5 kg ha-1 as ZnSO4.7H2O)
– T3 = Bioactive Zincate Urea (ZU) @ 160 kg Nha-1 (for maize) and 125 kg Nha-1 (for rice)
– T4 = Bioactive Zincate Urea (ZU) @ 90% of T3
– T5 = Bioactive Zincate Urea (ZU) @ 80% of T3
The experimental field was disk-ploughed twice and leveled. At final ploughing, 80 kg P2O5 ha−1 as Di-ammonium phosphate (DAP) and 60 kg K2O ha−1 as sulfate of potash (SOP) were broadcasted. Nitrogen (N) at 160 kg N ha−1 as CU and ZU was applied in two equal splits, i.e. half at 20 days after sowing (DAS) and the remaining half at 60 DAS. The zinc was applied in the required treatments as ZnSO4·7H2O on 20 days after sowing of crop.
Ammonia volatilization losses were assessed at different time intervals after each split application of urea fertilizer. Soil samples were collected from 0-10, 10-20 and 20-30 cm soil depth for NO3-N analysis after crop harvest. The NH3 losses from the cropped field were quantified using specialized structure for such measurements while NO3 leaching was measured after each split of urea application and harvest of crop.
An experiment under natural field condition was also conducted to collect required information from the bioactive zincated-urea applied as recommended dose to maize crop.
Urea Transformations
Urea transformations were determined in the same soil used for NH3 volatilization studies, at the end of each incubation period. In this regard, the soil in the vessel was analyzed for NH4 and NO3 contents using micro Kjehldahl apparatus [37]. The soil samples were shaken with 2 N KCl for 30 minutes and the suspension was allowed to settle down. The analysis was performed by distillation of aliquot with MgO (for NH4 determination) and devarda alloy (for NO3 determination).
Growth and Yield Measurements
At physiological maturity, 10 plants from each plot were harvested to record biomass and grain yield, plant height, biomass yield, cob length, cob weight etc. The plant height was recorded with meter rod as the distance between the lowest node of the plant up to the node bearing tassel while stover yield was recorded by drying shoot in the oven at 70ºC till constant weight. Data was also recorded on various yield attributes, including cob length (CL), cob weight (CW), hundred grain weight and grain yield (GY) on ten representative plants in each plot and averaged to calculate these traits on per plant basis.
Physio-Biochemical Characteristics
Chlorophyll Contents and Carotenoids
For determining the chlorophyll contents (chl. a, b and total Chl.), the youngest fully expanded leaves (0.1 g) were chopped, subjected to extraction using freshly prepared 80% acetone solution and kept at 4ºC for 24 h. Centrifuged at 14000 × g for 5 minutes. After filtration, the optical density of the supernatant was read at 645 and 663 nm using the spectrophotometer (HitachiU-2001, Tokyo, Japan). On the basis of OD reading, chlorophyll (a, b), total chlorophyll and carotenoids were calculated using the following formula and expressed in μgg-1 FW [38].
Leaf total Chl. = [20.2 (OD645)
−8:02(OD663)] × V/W × 1/1000 Chl. A = [12.7 (OD 663) - 2.69 (OD 645)] x V/1000 x W Chl. B = [22.9 (OD 645) - 4.68 (OD663)] x V/1000 x W
Total Chl. = [20.2 (OD645) - 8.02
(OD663)] x V/1000 x W
Total Carotenoids (mg g f.wt._1) =Acar/Em
Acar= OD480+0.114 (OD, 663) - 0.638 (OD, 645)
Em = 2500
V = Acetone (volume)
W = Sample Weight
Determination of Osmolyte Content (Total Soluble Proteins, Free Amino Acids, Total Soluble Sugars, and Proline)
Total Soluble Proteins (TSPs)
Total soluble proteins were measured by using the standard method [39]. The fresh leaf material (0.2 g) was taken and 10 ml chilled Na phosphate buffer (0.2 M, pH 7.0) was added for the extraction of total soluble proteins. The homogenate was then centrifuged at 5000 g for 5 min and the supernatant was used for quantifying TSPs on spectrophotometer (Jenway, 6700) by recording OD at 620 nm.
Total Soluble Sugar (TSS)
Total soluble sugars (TSS) were determined following the standard protocol [40]. Plant material (0.5 g) was extracted with 5 mL of 80% ethanol solution for 6 h at 60ºC. Plant extract of 0.1 mL was taken in 25-mL test tubes and added 6 mL anthrone (freshly prepared) reagent to each tube. We covered the test tube with aluminum foil and heated in boiling water bath for 15 minutes at 97ºC. Then we cooled down the test tubes in an ice bath for 10 min and incubated for 20 min at room temperature (25ºC). The OD reading was recorded at 625nm on a spectrophotometer (HITACHI U-2800). The concentration of soluble sugars was calculated from a standard curve developed by using different concentrations of glucose according to the above procedure.
Total Free Amino Acids (TFAs)
Total free amino acids (TFAs) were also determined [41]. The fresh leaves (0.5 g) were chopped and extracted with phosphate buffer (0.2 M) having pH 7.0. One mL of the extract was taken in a 50-mL volumetric flask. One mL of pyridine (10%) and 1 mL of ninhydrin (2%) solutions were added in the flask. The flasks containing the sample mixture were heated in boiling water bath for about 30 min. The volume of each flask was made up to50 mL with distilled water. A standard curve was drawn with Lucien and the OD was recorded at 570 nm using a spectrophotometer (HITACHI U-2800). The free amino acids were calculated using the following formula.
Total Free Amio Acids = Graph reading × volume of sample × dilution factor/ weight of tissue (g) × 1000
Estimation of Proline
The proline was extracted from leaf samples (0.1 g) using 5 ml aqueous sulfosalicylic acid solution (3%; w/v) and filtered the homogenate. To 1.0 mL of the filtrate was added 1.0 ml ninhydrin solution and 1.0 ml acetic acid (glacial) and heated at 97ºC for 1 hour in water bath. Then we added 5.0 ml toluene solution in it and passed through air stream for 1 minute. Two layers appeared in the test tube. We took the upper most layer and noted down the OD reading at 520 nm using a spectrophotometer (Hitachi U- 2001, Tokyo, Japan) [42].
Activity of Antioxidant Enzymes
For extraction of enzymes, 0.5 g of fresh leaf was ground in 10mL of ice-cold extraction buffer potassium phosphate (pH 7.5), and centrifuged at 4ºC for 20 minutes at 12,000g. After centrifugation, supernatant was taken and stored at -80ºC for measurement of antioxidant enzymes activities.
Superoxide Dismustase (SOD)
An established protocol was followed for the determination of SOD activity [43]. Each 3 mL of reaction mixtureconsisted of 13mM methionine, 1.3 mM riboflavin, 50 mM nitro-blue tetrazolium (NBT), 75mM EDTA (ethylene diamine tetra-acetic acid), 20 mM phosphate buffer and 50 µl of leaf extract. The reaction mixture was then irradiated for 15 minutes under white fluorescent light, alongside the control without enzyme extract. The absorbance of the mixture was recorded at 560 nm on a UV-visible spectrophotometer. The activity of SOD was expressed as Units mg_1 protein.
Peroxidase (POD)
The activity of POD was measured following Cakmak and Marschner [44]. The assay mixture was comprised of 0.1 ml of leaf extract, then added 1.0 ml of 40 mM H2O2, 1.0 ml of 20 mM guaiacol, and 1 ml of 50 mM potassium phosphate buffer (pH 7.8) were added to it. The changes in absorbance of the reaction solution were noted at 470 nm for 3 minutes, with every 20 s interval.
Catalase (CAT)
The activity for CAT was also measured by following the method of Cakmak and Marschner [44]. The assay mixture (3.0mL) was comprised of 100 μl enzyme extract, 1.0 ml of 40 mM H2O2 and1 ml of 50 mM potassium phosphate buffer (pH 7.8). The CAT activity was measured by the change in absorbance of the reaction at 240 nm after recorded every 20 s.
Ascorbate Peroxidase (APX)
The measurement of APX activity was performed using method adopted by Cakmak [45]. The mixture containing 100 μl enzyme extract, 100 μl of 0.5 mM ascorbic acid, 100 μl H2O2 (300 mM) and 2.7 mL 25 mM potassium phosphate buffer with 2 mM EDTA (pH 7.8) was used for measuring APX activity. The absorbance of the reaction was measured at 290 nm for 2 minute, with every 20 s interval.
Mineral Analysis of Grain and Straw
Mineral contents were determined following standard protocol by the Association of Official Analytical Chemists [46]. The dried and ground grain (1.0 g) and straw (0.5 g) were taken in digestion tubes and 10ml conc. H2SO4 was added to each tube and kept it overnight at room temperature. Next day, 0.5 ml H2O2 (35%) was added in the tubes and heated at 350ºC in a digestion block for 30 min till fumes appeared. Then, we removed the digestion tubes from digestion block, cooled down and again added 0.5 mL of H2O2. This step was repeated till the cooled digested material became colorless. The digested material was filtered and made the volume 50 ml by adding distilled water. The filtrate was used for the analysis of N through Kjeldahl Method and the protein percentage was measured by multiplying nitrogen concentration with conversion factor 6.25 while P and K were computed using a spectrophotometer (HITACHI U-2800) and a flame photometer (JENWAY PFP-7), respectively. Zinc in grain samples was analyzed using atomic absorption spectrophotometer.
Statistical Analysis
The experiment was conducted following randomized complete block design (RCBD) with three replications. All the data collected were statistically analyzed using computer software Statistix 8.1 (Analytical Software, Tallahassee, FL, USA) [47]. The comparison of the mean values of each treatment were tested using two-way analysis of variance while least significance difference (LSD) test at the 5% probability level (P≤0.05) was used to test the significance of the effects of treatments on the reported traits.
Results
Ammonia Volatilization Losses as Affected by Urea Treatments under Field Conditions
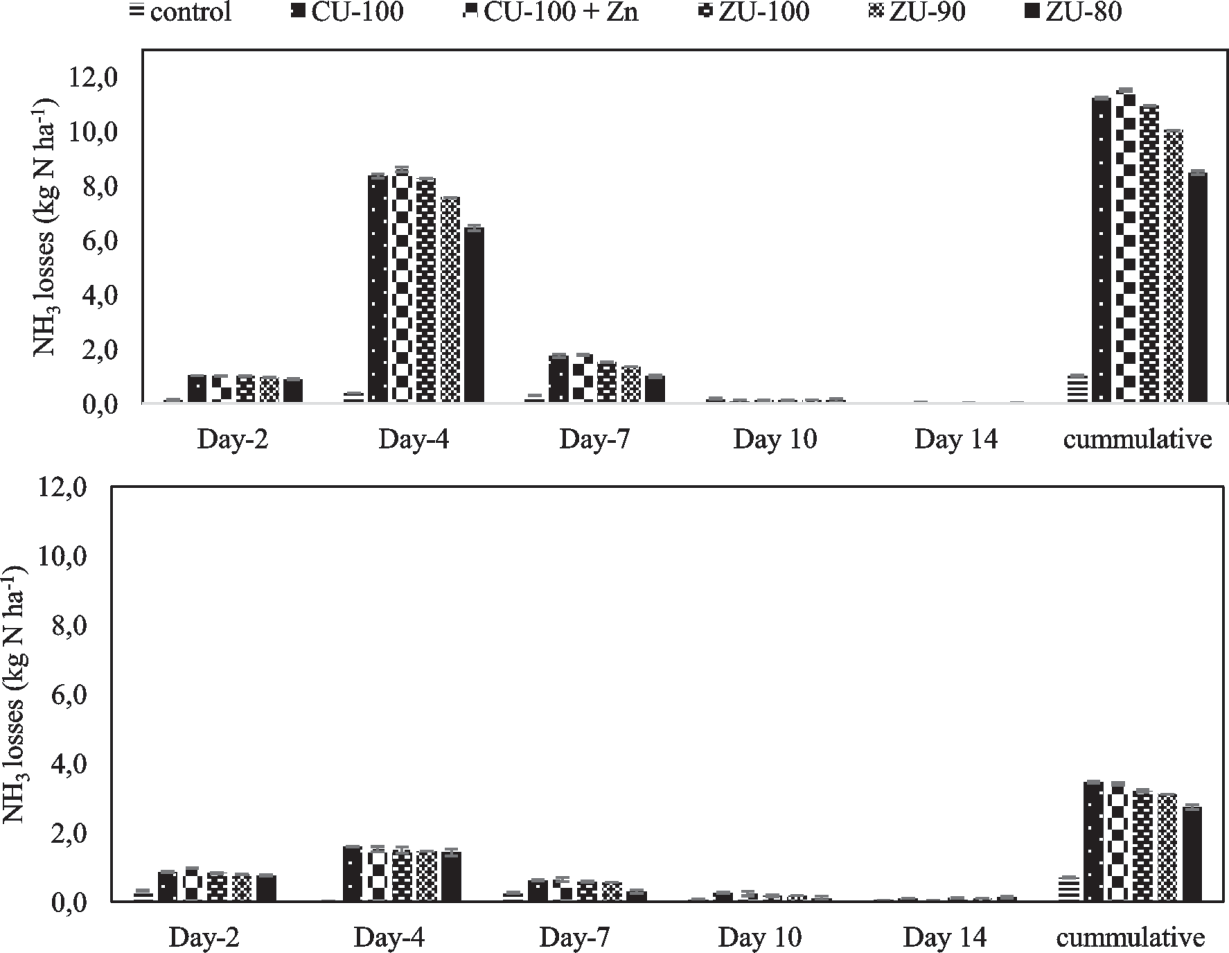
Under both split applications, higher losses occurred during first week of fertilizer application while the losses were gradually lowered down during the second week reaching to negligible level at day-14 of fertilizer application. The pattern of NH4+ release of ZU was somewhat different from CU. The rate of NH4+ disappearance was smaller in case of ZU irrespective of the fertilizer treatments, NH3 volatilization after first split of urea application was sharply surged during early days (2 to 4 days) and thereafter declined reaching to almost negligible level at 14 days (Fig. 1). Almost a similar trend of NH3 volatilization was observed for the second dose of fertilizer application; however, second split application encountered lower losses than the first split application particularly in rice crop where losses were observed tremendously higher in 1st split compared to 2nd split (Fig. 2). The reason of lower volatilization losses in 2nd split could be due to higher N uptake and accumulation by the actively growing crop and higher biomass at this stage.
In comparison with CU, the effect of ZU on NH3 volatilization was significantly lower at all ZU treatments at 100% of recommended N levels while the losses were decreased further at lower N application as ZU fertilizer. Ammonia volatilization losses in ZU treatments were found significantly lower when compared with CU in both maize (-5 to -14%) and rice (-2 to -24%). The earlier studies also witnessed similar trend in respect of NH3 volatilization as observed in the current study attaining higher losses during first week while decreasing gradually to minimum level after second week of N application. The cumulative NH3 volatilization loss was significantly higher after first split application when compared to the second split application. The NH3 volatilization was maximum on day-4 of urea application in all the treatments in both splits.
Fig. 1.
Nitrogen losses as ammonia (NH3) volatilization of applied fertilizers in maize (Zea mays L) as affected by commercial urea (CU) and bioactive zincated Urea (ZU) treatments and percent decrease in NH3 losses in ZU treatments compared to CU. Control (No nitrogen); CU-100, 160 kg N ha-1 (for maize) and 125 kg N ha-1 (for rice) as commercial urea; CU-100 + Zn, 160 kg N ha-1 (for maize) and 125 kg N ha-1 (for rice) as commercial urea alongwith soil zinc application (equivalent to 5 kg ha-1 as ZnSO4.7H2O); ZU-100, 160 kg N ha-1 (for maize) and 125 kg N ha-1 (for rice) as Bioactive Zincated Urea; ZU-90, 144 kg N ha-1 (for maize) and 112.5 kg N ha-1 (for rice) as Bioactive Zincated Urea; ZU-80, 128 kg N ha-1 (for maize) and 100 kg N ha-1 (for rice) as Bioactive Zincated Urea. The error bars represent the standard errors of the mean of three replicates. Different letters indicate indicate significant differences within treatments at P<0.05.
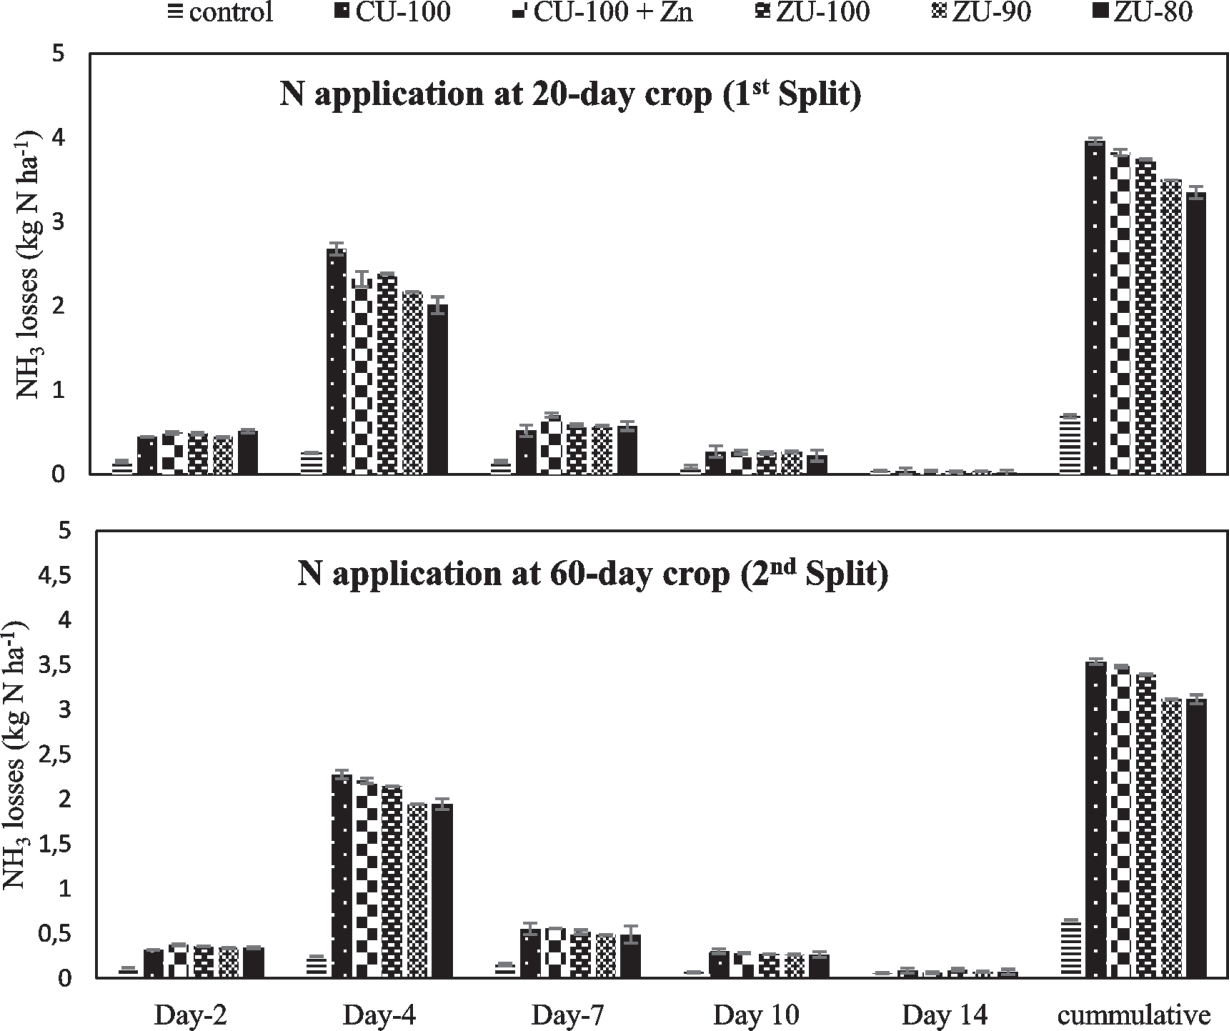
Fig. 2.
Nitrogen losses as ammonia (NH3) volatilization of applied fertilizers in Rice (Oriza sativa L) as affected by commercial urea (CU) and bioactive zincated Urea (ZU) treatments and percent decrease in NH4 losses in ZU treatments compared to CU. Control (No nitrogen); CU-100, 160 kg N ha-1 (for maize) and 125 kg N ha-1 (for rice) as commercial urea; CU-100 + Zn, 160 kg N ha-1 (for maize) and 125 kg N ha-1 (for rice) as commercial urea alongwith soil zinc application (equivalent to 5 kg ha-1 as ZnSO4.7H2O); ZU-100, 160 kg N ha-1 (for maize) and 125 kg N ha-1 (for rice) as Bioactive Zincated Urea; ZU-90, 144 kg N ha-1 (for maize) and 112.5 kg N ha-1 (for rice) as Bioactive Zincated Urea; ZU-80, 128 kg N ha-1 (for maize) and 100 kg N ha-1 (for rice) as Bioactive Zincated Urea. The error bars represent the standard errors of the mean of three replicates. Different letters indicate indicate significant differences within treatments at P<0.05.
Crop Growth and Yield Parameters
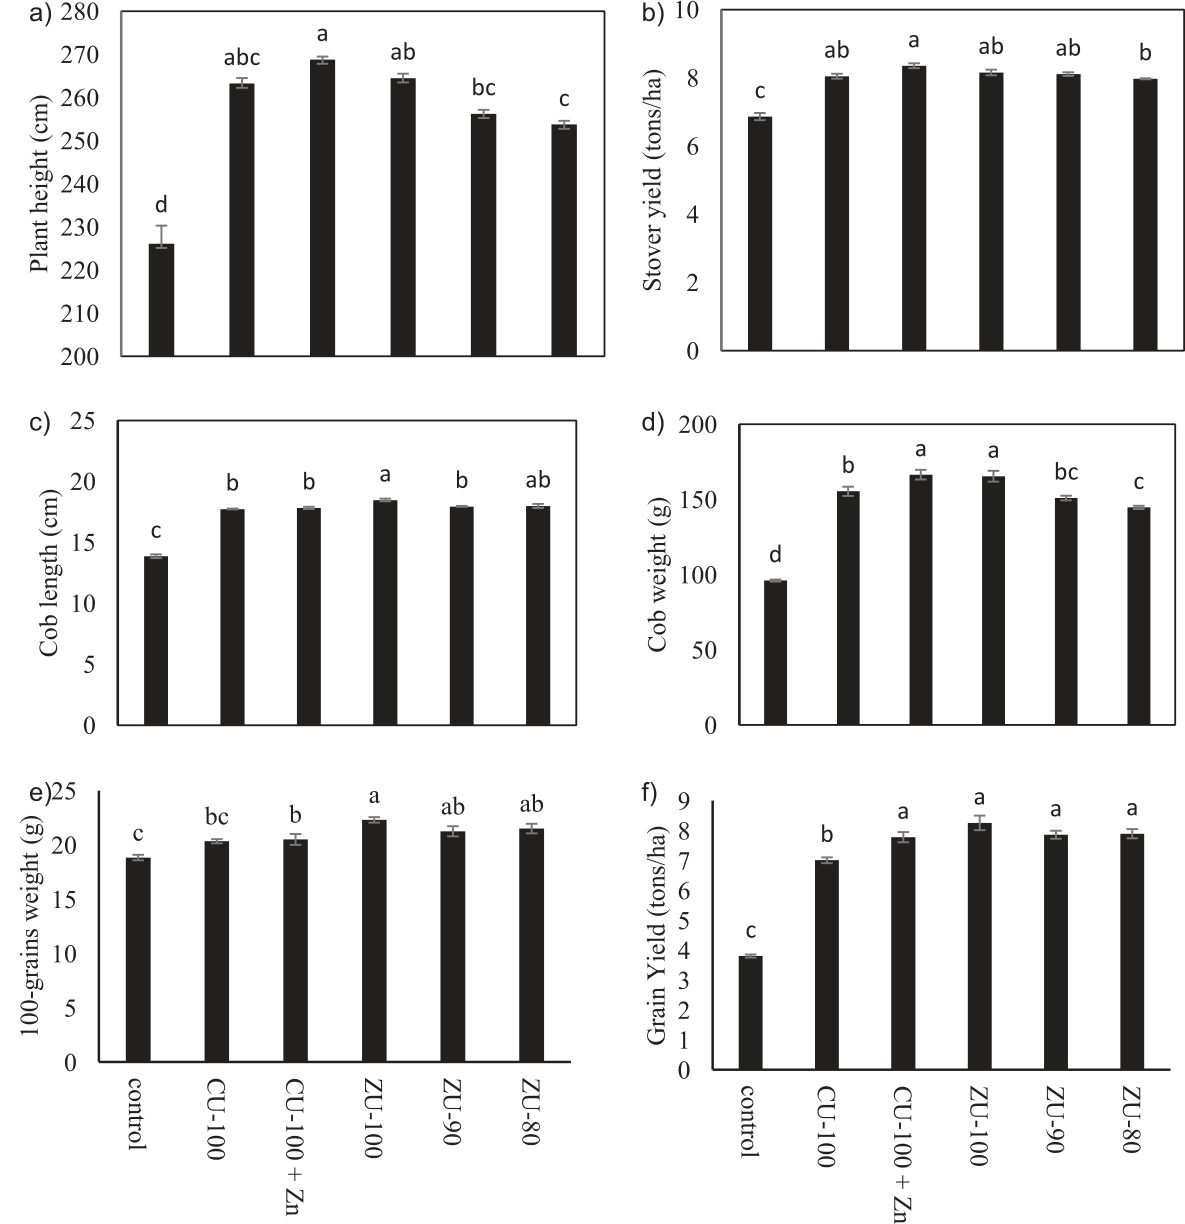
The different urea treatments significantly (P≤0.05) influenced growth and yield parameters like plant height, biomass yield, cob length, cob weight and grain yield etc. of maize in comparison with ordinary urea and control (Fig. 3). The 100% dose of CU together with Zn produced highest plant height and biomass yield while yield parameters and grain yield were highest with the full dose of ZU. The highest values of yield attributes were recoded with ZU100 followed by ZU90, ZU80, and CU+ZnSO4. At final harvest, ZU100 resulted in 9.8% and 17.83% higher 100-grain weight and grain yield, respectively as compared to CU treated plants. Similar trend was observed in rice crop where highest grain yield was achieved with ZU treatments compared to CU treatments (Fig. 4) where highest paddy yield was recorded in ZU100 (6.5 tons/ha) followed by CU100 + Zn (6.3 tons/ha). Grain yield in ZU90 and ZU80 were found statistically at par with CU100.
Physiological and Biochemical Attributes
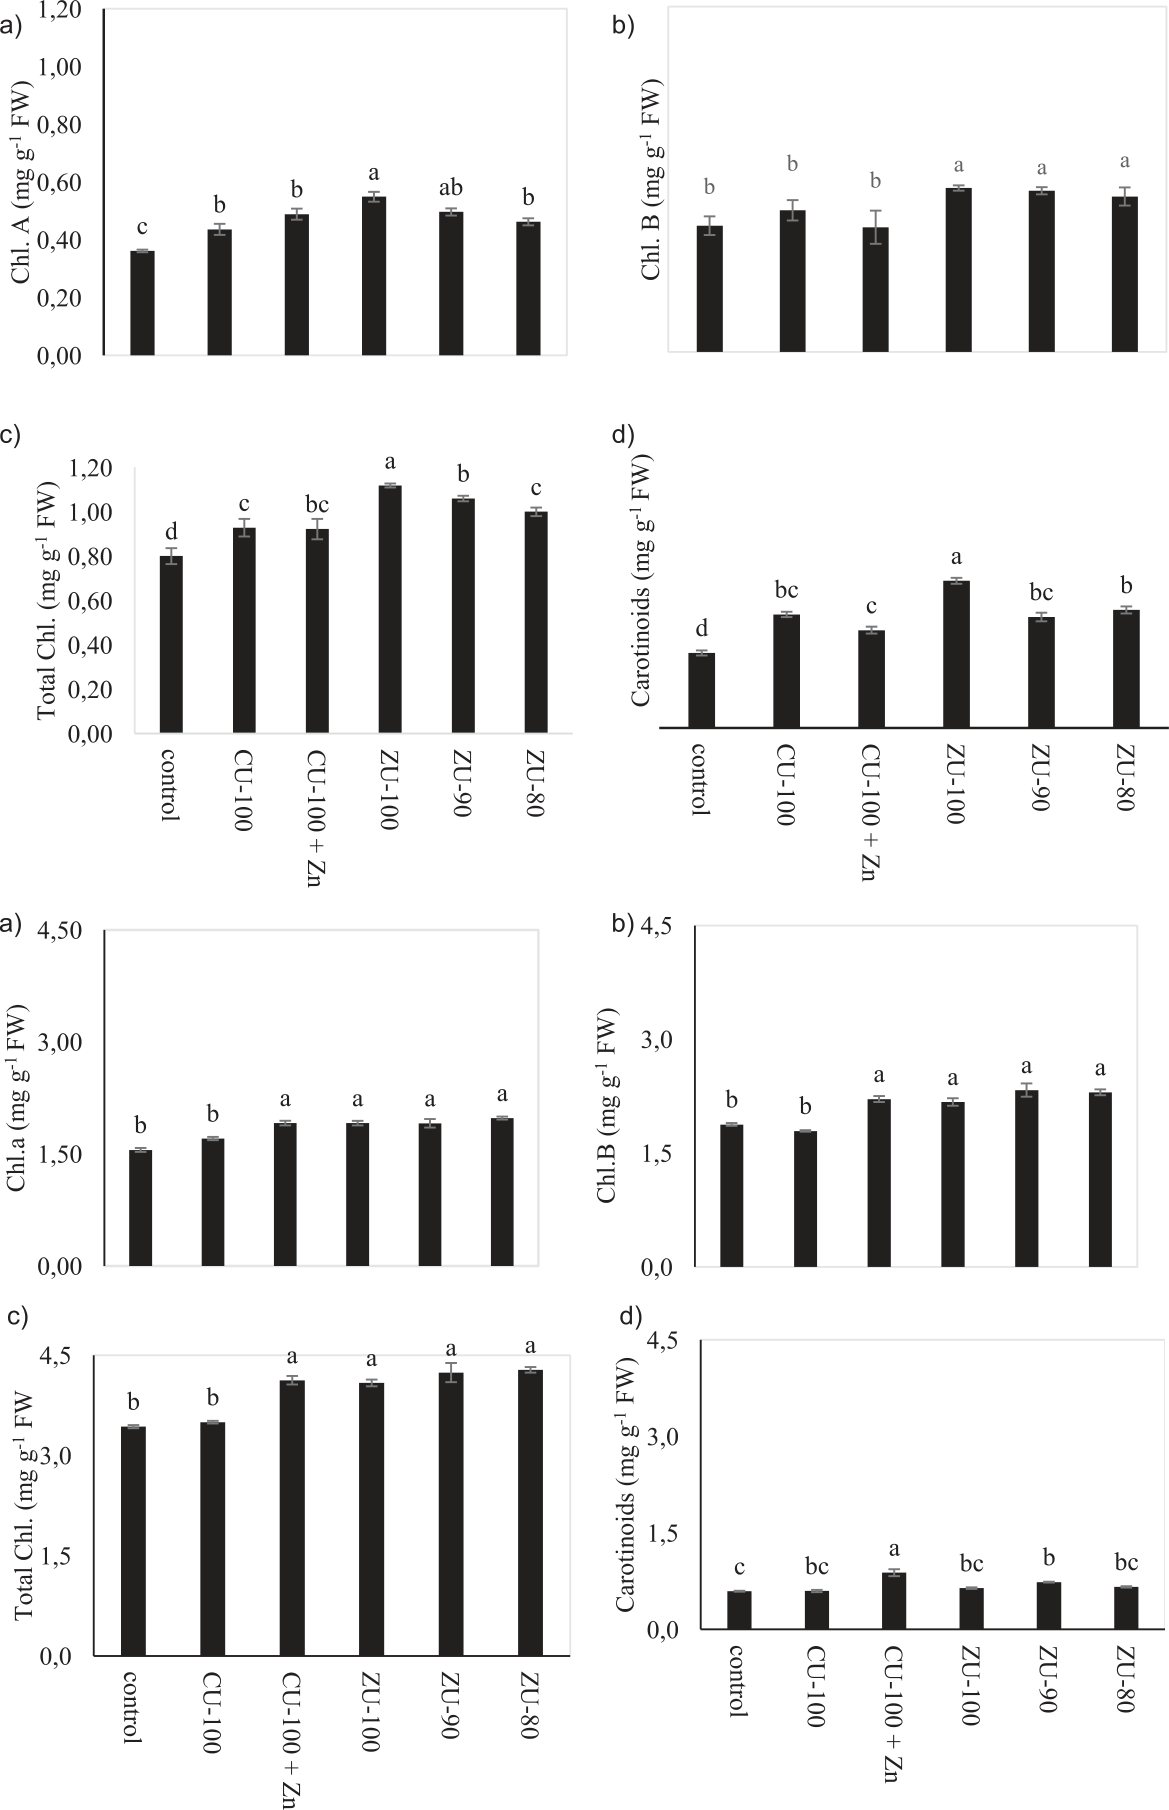
The physio-biochemical attributes also showed marked variation in response to different urea treatments wherein chlorophyll a & b were found significantly (P≤0.05) higher in ZU100 treated plants when compared with the control and CU applied at full recommended rate (Fig. 5). The total chlorophyll and carotenoids also exhibited the similar trend. However, the osmolyte contents like TSPs, TSS, TFAs and proline content showed variable responses to the applied treatments. Over control treatment, higher values were observed for TSPs, and proline content in maize applied with different urea treatments, while TFAs were found higher in control and CU treatments as compared to ZU treatments. However, no significant (P≤0.05) difference in TSS was observed among different treatments (Fig. 7). Similar trend was observed in rice crop where ZU treatments showed higher Chl. Contents compared to CU treatments (Fig. 6) while significant decrease in TSS and TFA was observed in ZU treatments (Fig. 8).
Antioxidant Enzyme Activities
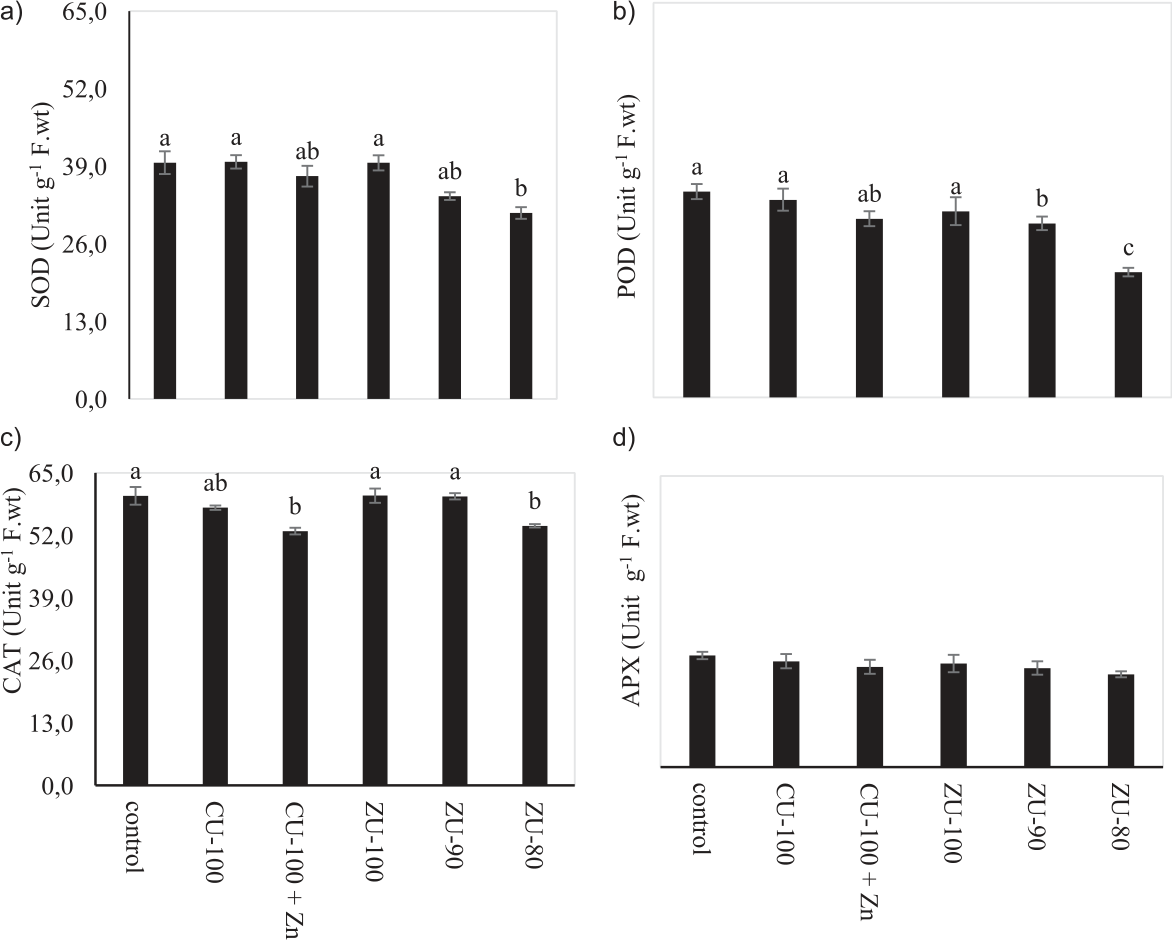
The overall effect of different urea treatments on antioxidant enzyme activities was observed non-significant (P≤0.05). In general, the activities of antioxidant enzymes i.e. SOD, POD, CAT and APX were observed lower in the urea applied treatments in comparison with control treatment (Fig. 5). The nutrient deficiency significantly promoted SOD, POD, CAT and APX activities in maize shoot while different urea treatments non-significantly decreased the activities of antioxidant enzymes.
Fig. 3.
Growth and yield attributes of maize (Zea mays L) as affected by commercial urea (CU) and bioactive zincated Urea (ZU) treatments. Control (No nitrogen); CU-100, 160 kg N ha-1 (for maize) and 125 kg N ha-1 (for rice) as commercial urea; CU-100 + Zn, 160 kg N ha-1 (for maize) and 125 kg N ha-1 (for rice) as commercial urea alongwith soil zinc application (equivalent to 5 kg ha-1 as ZnSO4.7H2O); ZU-100, 160 kg N ha-1 (for maize) and 125 kg N ha-1 (for rice) as Bioactive Zincated Urea; ZU-90, 144 kg N ha-1 (for maize) and 112.5 kg N ha-1 (for rice) as Bioactive Zincated Urea; ZU-80, 128 kg N ha-1 (for maize) and 100 kg N ha-1 (for rice) as Bioactive Zincated Urea. The error bars represent the standard errors of the mean of three replicates. Different letters indicate indicate significant differences within treatments at P<0.05.
Nitrogen and Zinc Concentration in Grains
Nitrogen and Zn concentration in grains of maize significantly varied under urea treatments. Application of ZU at all levels (from 80 to 100%) and CU100+Zn significantly improved grain Zn and nitrogen concentration compared to CU and control treatments (Fig. 11(a,b)). Similar trend was observed in rice crop where application of ZU and CU100+Zn treatments significantly improved both Zn and N concentration in grains compared to CU and control treatments (Fig. 12 (a,b)).
Post-harvest NH4+and NO3-1 Concentrations
in Soil
The data of NH4+ and NO3-1 analyzed at different soil layers (10, 20 and 30cm) after harvesting of both crops i.e. maize (13A) and rice crop (13B) is presented in Fig. 13. The data showed no significant difference in NH4+ accumulation in different soil layers while NO3 concentration was lower in upper layer (0-10 cm) while highest in deeper layer (20-30 cm) regardless of the urea treatments applied (Fig. 13a). A similar trend was observed in rice (Fig. 13b). However, among treatments ZU90 and ZU80 showed lower NH4 and NO3 concentration in all soil layers compared to other urea treatments except control in both maize and rice fields after harvest.
Discussion
Under the current scenario, coated fertilizers are believed to be the best solution to deliver nutrients to crops for enhancing their productivity, reducing nutrient losses, and mitigating the subsequent impact on the environment [48, 49]. The coating technology is devised for the slow release of the nutritional content of fertilizers so that their release rate may be synchronized with the nutritional demand of the plants. The characteristic of the gradual release of N contents from urea can be physically imparted by coating urea granules with various materials which delay its dissolution rate [50, 51]. Nutrient-coated urea behaves as a slow-release fertilizer since the thin nutrient layer that is applied around the urea granules hydrolyzes slowly and remains in the soil for a longer period, resulting in higher crop productivity and efficient nutrient use. Moreover, coated urea also improves the availability of other macro and micronutrients that are vital for crop growth and development in addition to nitrogen [51]. Different coated fertilizers are currently available in local markets, but this research has focused on zinc-coated urea due to essentiality of this element for humans, animals and plants as well as its widespread deficiency worldwide, especially alkaline calcareous soils present in the subtropical regions exhibit acute deficiency where the cereal-based cropping systems are prevailing [52].
Fig. 4.
Growth and yield attributes of rice (Oriza sativa L) as affected by commercial urea (CU) and bioactive zincated urea (ZU) treatments. Control (No nitrogen); CU-100, 160 kg N ha-1 (for maize) and 125 kg N ha-1 (for rice) as commercial urea; CU-100 + Zn, 160 kg N ha-1 (for maize) and 125 kg N ha-1 (for rice) as commercial urea alongwith soil zinc application (equivalent to 5 kg ha-1 as ZnSO4.7H2O); ZU-100, 160 kg N ha-1 (for maize) and 125 kg N ha-1 (for rice) as Bioactive Zincated Urea; ZU-90, 144 kg N ha-1 (for maize) and 112.5 kg N ha-1 (for rice) as Bioactive Zincated Urea; ZU-80, 128 kg N ha-1 (for maize) and 100 kg N ha-1 (for rice) as Bioactive Zincated Urea. The error bars represent the standard errors of the mean of three replicates. Different letters indicate indicate significant differences within treatments at P<0.05.
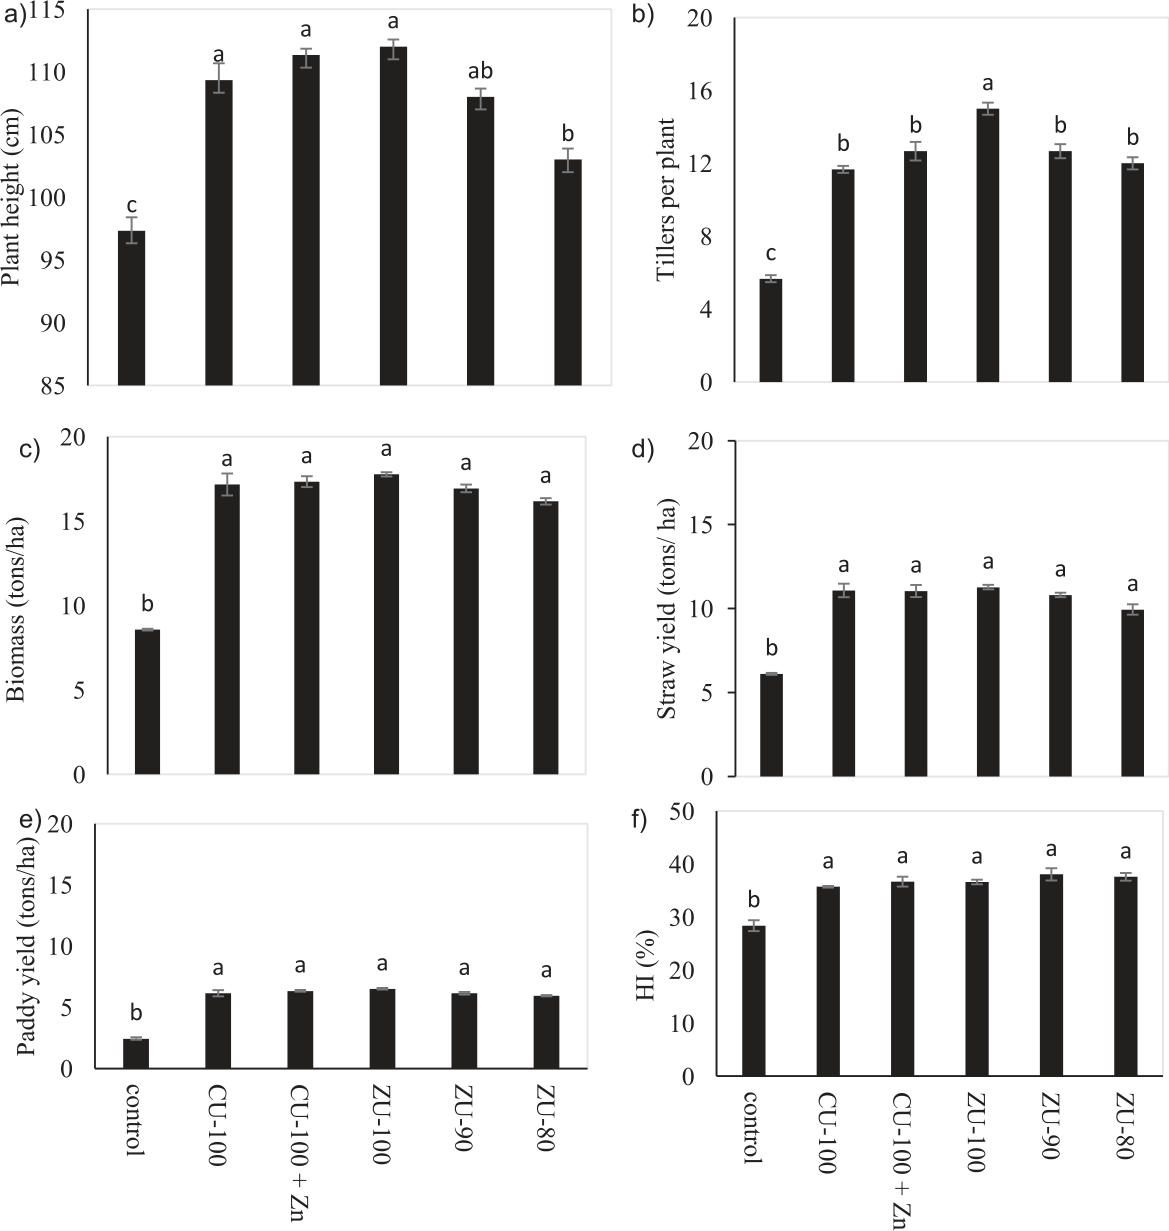
Fig. 5.
Photosynthetic pigments contents in maize (Zea mays L) as affected by commercial urea (CU) and bioactive zincated Urea (ZU) treatments. Control (No nitrogen); CU-100, 160 kg N ha-1 (for maize) and 125 kg N ha-1 (for rice) as commercial urea; CU-100 + Zn, 160 kg N ha-1 (for maize) and 125 kg N ha-1 (for rice) as commercial urea alongwith soil zinc application (equivalent to 5 kg ha-1 as ZnSO4.7H2O); ZU-100, 160 kg N ha-1 (for maize) and 125 kg N ha-1 (for rice) as Bioactive Zincated Urea; ZU-90, 144 kg N ha-1 (for maize) and 112.5 kg N ha-1 (for rice) as Bioactive Zincated Urea; ZU-80, 128 kg N ha-1 (for maize) and 100 kg N ha-1 (for rice) as Bioactive Zincated Urea. The error bars represent the standard errors of the mean of three replicates. Different letters indicate indicate significant differences within treatments at P<0.05. Fig. 5. Photosynthetic pigments contents in maize (Zea mays L) as affected by commercial urea (CU) and bioactive zincated Urea (ZU) treatments. Control (No nitrogen); CU-100, 160 kg N ha-1 (for maize) and 125 kg N ha-1 (for rice) as commercial urea; CU-100 + Zn, 160 kg N ha-1 (for maize) and 125 kg N ha-1 (for rice) as commercial urea alongwith soil zinc application (equivalent to 5 kg ha-1 as ZnSO4.7H2O); ZU-100, 160 kg N ha-1 (for maize) and 125 kg N ha-1 (for rice) as Bioactive Zincated Urea; ZU-90, 144 kg N ha-1 (for maize) and 112.5 kg N ha-1 (for rice) as Bioactive Zincated Urea; ZU-80, 128 kg N ha-1 (for maize) and 100 kg N ha-1 (for rice) as Bioactive Zincated Urea. The error bars represent the standard errors of the mean of three replicates. Different letters indicate indicate significant differences within treatments at P<0.05.
The cereals like maize, wheat, rice, etc. constitute important food crops in developing countries and are cultivated on large areas. Being a staple food for the majority of people, the quality parameters of cereals like proteins, nitrogen and mineral contents especially Fe and Zn in their grains need to be optimised. The application of Zn fertilizer is rarely practiced by the farming community owing to higher prices, additional expenses on labor for micronutrient application and problem in the uniform application of the small quantity over a large field area. Coated fertilizers, especially urea with the micronutrients seems feasible solution under the current scenario to supply nutrients to crops for enhancing their productivity, reducing nutrient losses, and minimizing the subsequent impact on the environment [48, 49, 53]. Urea being the major N fertilizer can act as a compatible carrier of the micronutrient and its coating with Zn further enhances its utilization by crops. The controlled release urea (CRU) can promote crop growth, improve photosynthesis [53-55], increase N absorption, and ultimately improves crop yield and N use efficiency [55-58]. In addition, it also helps facilitate translocation of other nutrients within plant [4]. This implies that 100% dose of urea along with Zn is more effective for enhancing growth characteristics compared to commercial urea alone.
Fig. 6.
Photosynthetic pigments contents in rice (Oriza sativa L) as affected by commercial urea (CU) and bioactive zincated Urea (ZU) treatments. Control (No nitrogen); CU-100, 160 kg N ha-1 (for maize) and 125 kg N ha-1 (for rice) as commercial urea; CU-100 + Zn, 160 kg N ha-1 (for maize) and 125 kg N ha-1 (for rice) as commercial urea alongwith soil zinc application (equivalent to 5 kg ha-1 as ZnSO4.7H2O); ZU-100, 160 kg N ha-1 (for maize) and 125 kg N ha-1 (for rice) as Bioactive Zincated Urea; ZU-90, 144 kg N ha-1 (for maize) and 112.5 kg N ha-1 (for rice) as Bioactive Zincated Urea; ZU-80, 128 kg N ha-1 (for maize) and 100 kg N ha-1 (for rice) as Bioactive Zincated Urea. The error bars represent the standard errors of the mean of three replicates. Different letters indicate indicate significant differences within treatments at P<0.05.
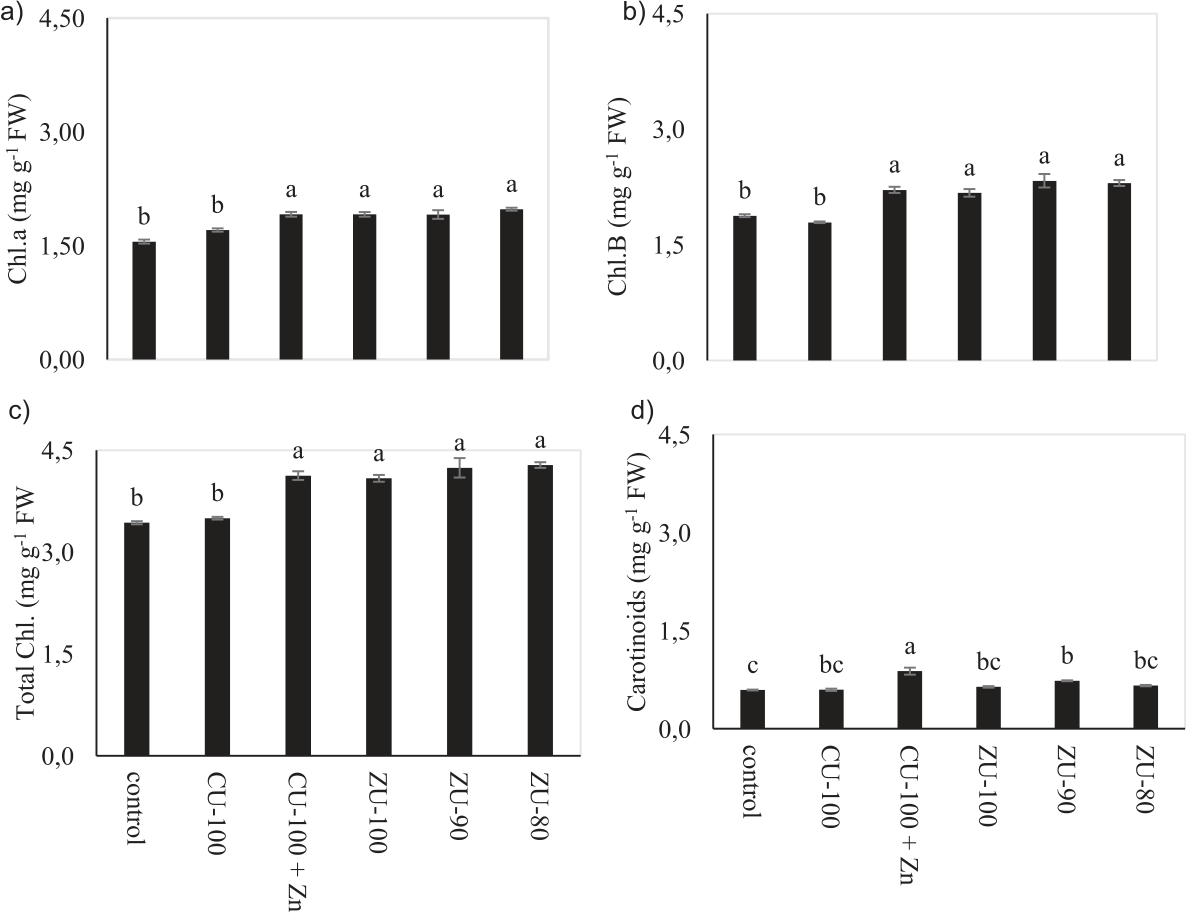
Fig. 7.
Soluble proteins a), total soluble sugars (TSS; b), total free amino acids (TFA; c) and proline (d) contents in maize (Zea mays L) as affected by commercial urea (CU) and bioactive zincated Urea (ZU) treatments. Control (No nitrogen); CU-100, 160 kg N ha-1 (for maize) and 125 kg N ha-1 (for rice) as commercial urea; CU-100 + Zn, 160 kg N ha-1 (for maize) and 125 kg N ha-1 (for rice) as commercial urea alongwith soil zinc application (equivalent to 5 kg ha-1 as ZnSO4.7H2O); ZU-100, 160 kg N ha-1 (for maize) and 125 kg N ha-1 (for rice) as Bioactive Zincated Urea; ZU-90, 144 kg N ha-1 (for maize) and 112.5 kg N ha-1 (for rice) as Bioactive Zincated Urea; ZU-80, 128 kg N ha-1 (for maize) and 100 kg N ha-1 (for rice) as Bioactive Zincated Urea. The error bars represent the standard errors of the mean of three replicates. Different letters indicate indicate significant differences within treatments at P<0.05.
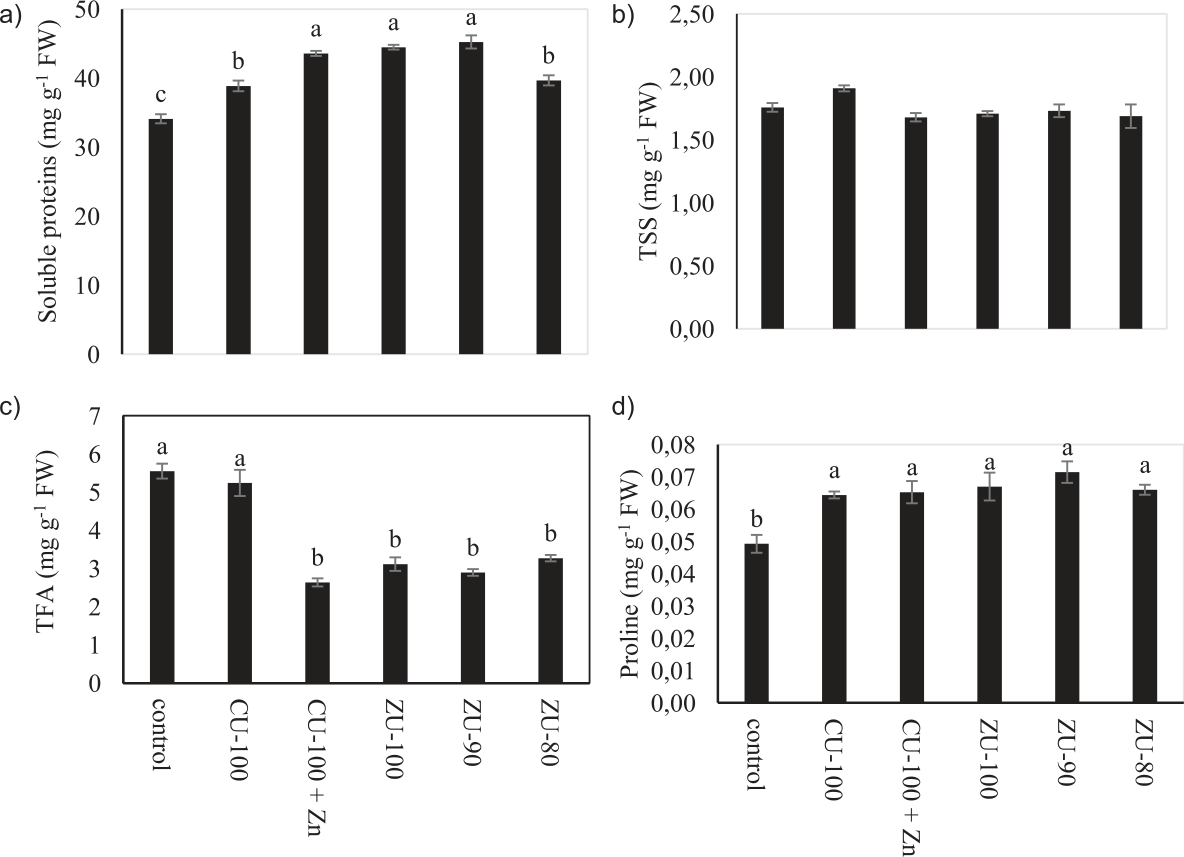
Fig. 8.
Soluble proteins a), total soluble sugars (TSS; b), total free amino acids (TFA; c) and proline d) contents in Rice (Oriza sativa L) as affected by commercial urea (CU) and bioactive zincated Urea (ZU) treatments. Control (No nitrogen); CU-100, 160 kg N ha-1 (for maize) and 125 kg N ha-1 (for rice) as commercial urea; CU-100 + Zn, 160 kg N ha-1 (for maize) and 125 kg N ha-1 (for rice) as commercial urea alongwith soil zinc application (equivalent to 5 kg ha-1 as ZnSO4.7H2O); ZU-100, 160 kg N ha-1 (for maize) and 125 kg N ha-1 (for rice) as Bioactive Zincated Urea; ZU-90, 144 kg N ha-1 (for maize) and 112.5 kg N ha-1 (for rice) as Bioactive Zincated Urea; ZU-80, 128 kg N ha-1 (for maize) and 100 kg N ha-1 (for rice) as Bioactive Zincated Urea. The error bars represent the standard errors of the mean of three replicates. Different letters indicate indicate significant differences within treatments at P<0.05.
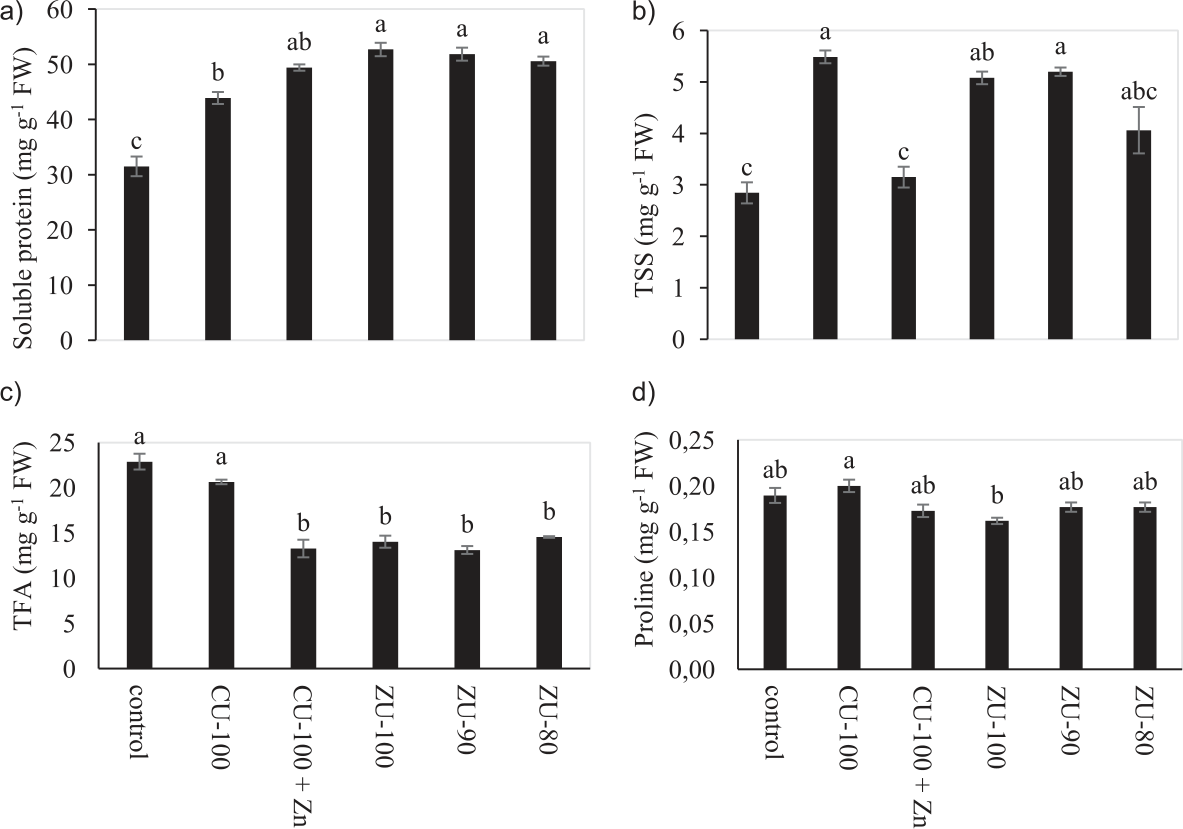
Fig. 9.
Antioxidant enzymes concentrations in leaves of maize (Zea mays L) as affected by commercial urea (CU) and bioactive zincated Urea (ZU) treatments. Control (No nitrogen); CU-100, 160 kg N ha-1 (for maize) and 125 kg N ha-1 (for rice) as commercial urea; CU-100 + Zn, 160 kg N ha-1 (for maize) and 125 kg N ha-1 (for rice) as commercial urea alongwith soil zinc application (equivalent to 5 kg ha-1 as ZnSO4.7H2O); ZU-100, 160 kg N ha-1 (for maize) and 125 kg N ha-1 (for rice) as Bioactive Zincated Urea; ZU-90, 144 kg N ha-1 (for maize) and 112.5 kg N ha-1 (for rice) as Bioactive Zincated Urea; ZU-80, 128 kg N ha-1 (for maize) and 100 kg N ha-1 (for rice) as Bioactive Zincated Urea. The error bars represent the standard errors of the mean of three replicates. Different letters indicate indicate significant differences within treatments at P<0.05.
The positive effect of Zn coated urea on growth and yield attributes in rice wheat cropping system are reported wherein Zn coated urea have been found to have higher nutrients availability under field crop production [34, 59]. In the present study, growth, yield, and Zn biofortification parameters were also significantly improved with the application of ZU in both maize and rice and the maximum increase was observed with ZU100 followed by ZU90 as compared to the sole application of ZnSO4 which could be due to an increase in N and Zn use efficiency. These results are in agreement with the findings of [57, 58]. The better performance of ZU is attributed to slow N release into soil to sustain its continuous supply for growing crop and hence seems conducive to meet the N demand of crops [34, 35]. The Zn coated urea has direct contact with roots resulting in maximum availability due to less adsorption on clay complexes [31]. Moreover, the amount of Zn to be applied is also saved when Zn is applied as Zn coated urea [50, 51]. Zn being an essential micronutrient acts as a cofactor of several enzymes involved in various metabolic processes (protein synthesis, hormonal synthesis, photosynthesis, seedling vigor, membrane functioning & redox reactions, etc.) in plants [60]. It is a structural component of carbonic anhydrase and aldolase, which are involved in plant carbon fixation [61]. An increase in quality parameters might be attributed to the contribution of Zn during photosynthesis, starch, and carbohydrate metabolism. The Zn also promotes glutamic dehydrogenase activity, RNA and DNA synthesis, which increases gluten accumulation during the later stages of grain filling [34]. Since N and Zn have a synergistic effect with each other, so the proper application of Zn increased N concentration in grains. Hence, the supplementation of Zn could be a promising strategy to enhance the growth, yield, and quality of crops under stress as it plays a vital role in the detoxification of ROS and retains the membranous structure of various cell organelles [60-62].
Fig. 10.
Antioxidant enzymes concentrations in leaves of maize (Oriza sativa L) as affected by commercial urea (CU) and bioactive zincated Urea (ZU) treatments. Control (No nitrogen); CU-100, 160 kg N ha-1 (for maize) and 125 kg N ha-1 (for rice) as commercial urea; CU-100 + Zn, 160 kg N ha-1 (for maize) and 125 kg N ha-1 (for rice) as commercial urea alongwith soil zinc application (equivalent to 5 kg ha-1 as ZnSO4.7H2O); ZU-100, 160 kg N ha-1 (for maize) and 125 kg N ha-1 (for rice) as Bioactive Zincated Urea; ZU-90, 144 kg N ha-1 (for maize) and 112.5 kg N ha-1 (for rice) as Bioactive Zincated Urea; ZU-80, 128 kg N ha-1 (for maize) and 100 kg N ha-1 (for rice) as Bioactive Zincated Urea. The error bars represent the standard errors of the mean of three replicates. Different letters indicate indicate significant differences within treatments at P<0.05.
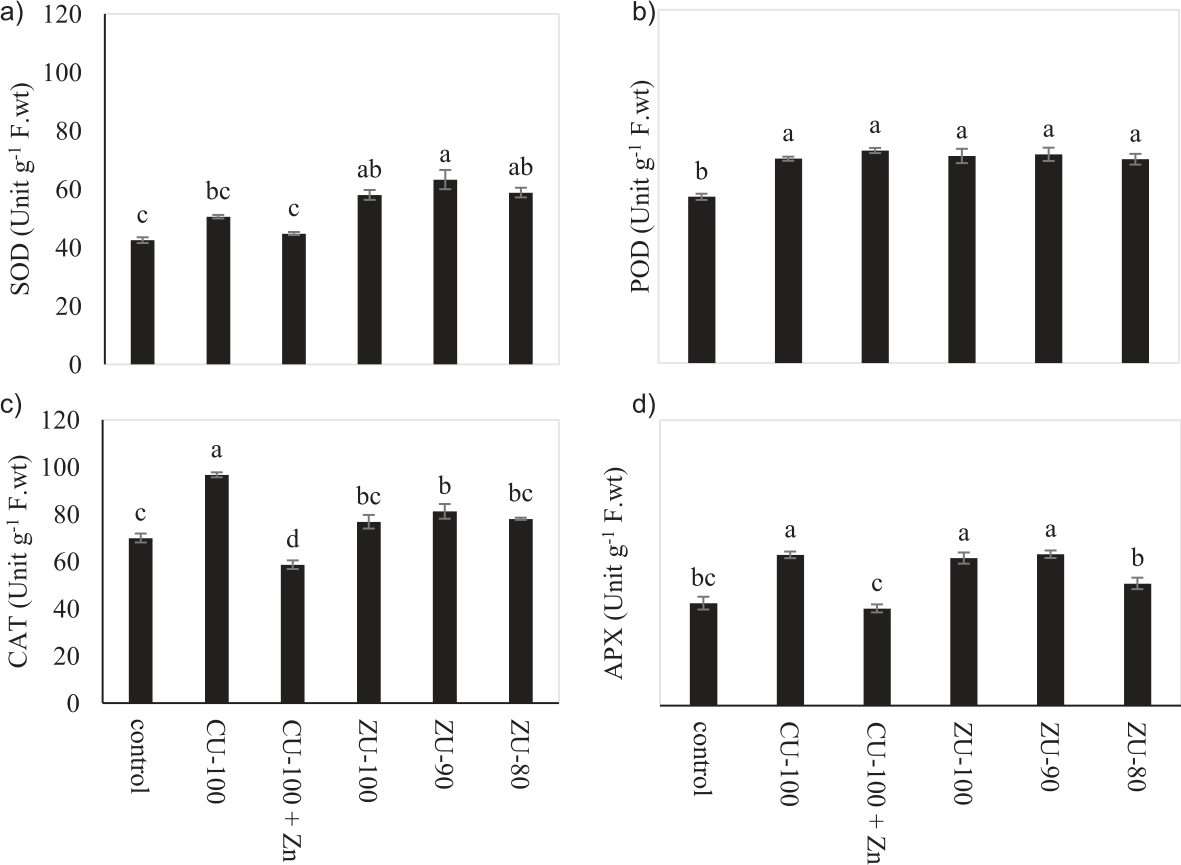
Fig. 11.
Nitrogen a) and Zn b) concentration in grain of maize (Zea mays L) as affected by commercial urea (CU) and bioactive zincated Urea (ZU) treatments. Control (No nitrogen); CU-100, 160 kg N ha-1 (for maize) and 125 kg N ha-1 (for rice) as commercial urea; CU-100 + Zn, 160 kg N ha-1 (for maize) and 125 kg N ha-1 (for rice) as commercial urea alongwith soil zinc application (equivalent to 5 kg ha-1 as ZnSO4.7H2O); ZU-100, 160 kg N ha-1 (for maize) and 125 kg N ha-1 (for rice) as Bioactive Zincated Urea; ZU-90, 144 kg N ha-1 (for maize) and 112.5 kg N ha-1 (for rice) as Bioactive Zincated Urea; ZU-80, 128 kg N ha-1 (for maize) and 100 kg N ha-1 (for rice) as Bioactive Zincated Urea. The error bars represent the standard errors of the mean of three replicates. Different letters indicate indicate significant differences within treatments at P<0.05.
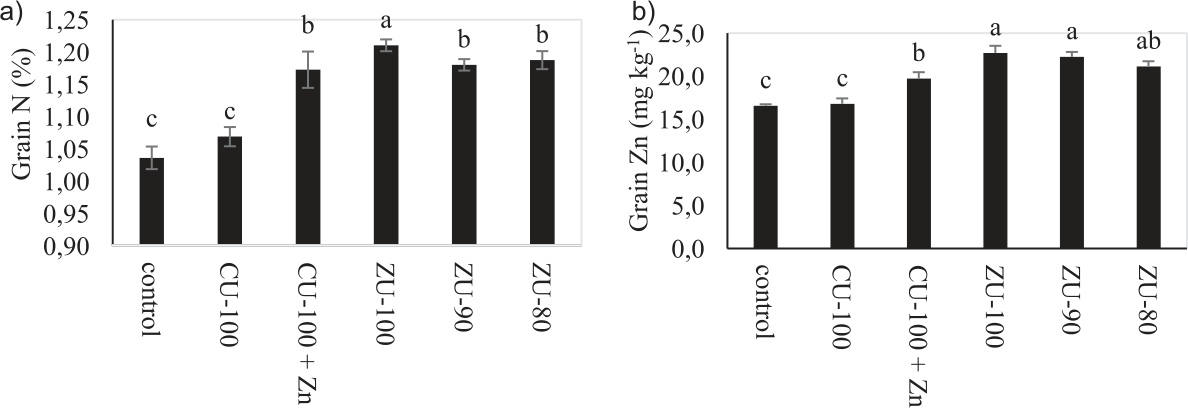
Fig. 12.
Nitrogen a) and Zn b) concentration in grain of rice (Oriza sativa L) as affected by commercial urea (CU) and bioactive zincated Urea (ZU) treatments. Control (No nitrogen); CU-100, 160 kg N ha-1 (for maize) and 125 kg N ha-1 (for rice) as commercial urea; CU-100 + Zn, 160 kg N ha-1 (for maize) and 125 kg N ha-1 (for rice) as commercial urea alongwith soil zinc application (equivalent to 5 kg ha-1 as ZnSO4.7H2O); ZU-100, 160 kg N ha-1 (for maize) and 125 kg N ha-1 (for rice) as Bioactive Zincated Urea; ZU-90, 144 kg N ha-1 (for maize) and 112.5 kg N ha-1 (for rice) as Bioactive Zincated Urea; ZU-80, 128 kg N ha-1 (for maize) and 100 kg N ha-1 (for rice) as Bioactive Zincated Urea. The error bars represent the standard errors of the mean of three replicates. Different letters indicate indicate significant differences within treatments at P<0.05.
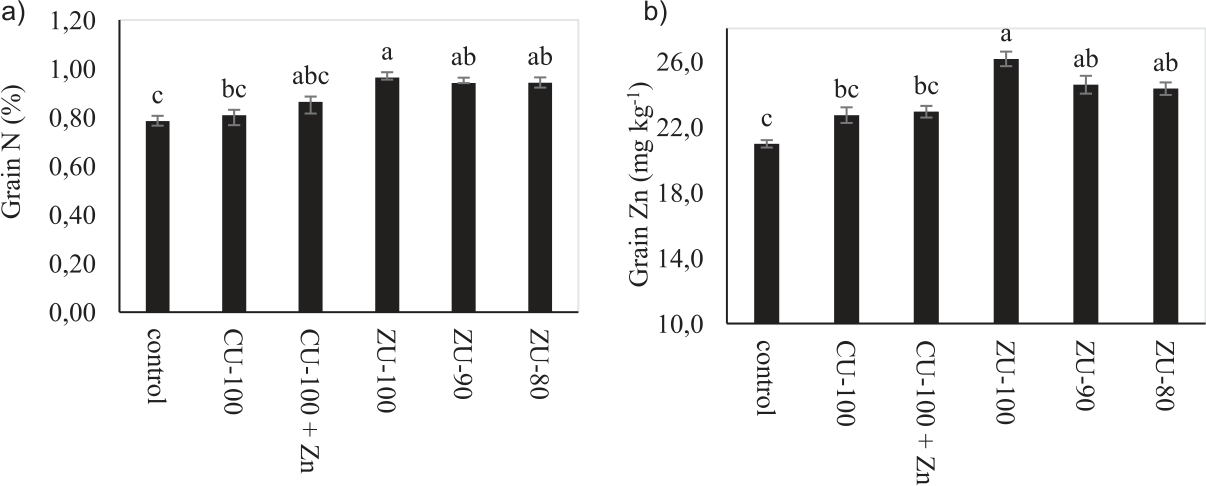
Fig. 13.
Ammonium (NH4+) and nitrate (NO3-) in different soil layers after maize (A) and Rice (B) harvest as affected by commercial urea (CU) and bioactive zincated Urea (ZU) treatments. Control (No nitrogen); CU-100, 160 kg N ha-1 (for maize) and 125 kg N ha-1 (for rice) as commercial urea; CU-100 + Zn, 160 kg N ha-1 (for maize) and 125 kg N ha-1 (for rice) as commercial urea alongwith soil zinc application (equivalent to 5 kg ha-1 as ZnSO4.7H2O); ZU-100, 160 kg N ha-1 (for maize) and 125 kg N ha-1 (for rice) as Bioactive Zincated Urea; ZU-90, 144 kg N ha-1 (for maize) and 112.5 kg N ha-1 (for rice) as Bioactive Zincated Urea; ZU-80, 128 kg N ha-1 (for maize) and 100 kg N ha-1 (for rice) as Bioactive Zincated Urea. The error bars represent the standard errors of the mean of three replicates. Different letters indicate indicate significant differences within treatments at P<0.05.
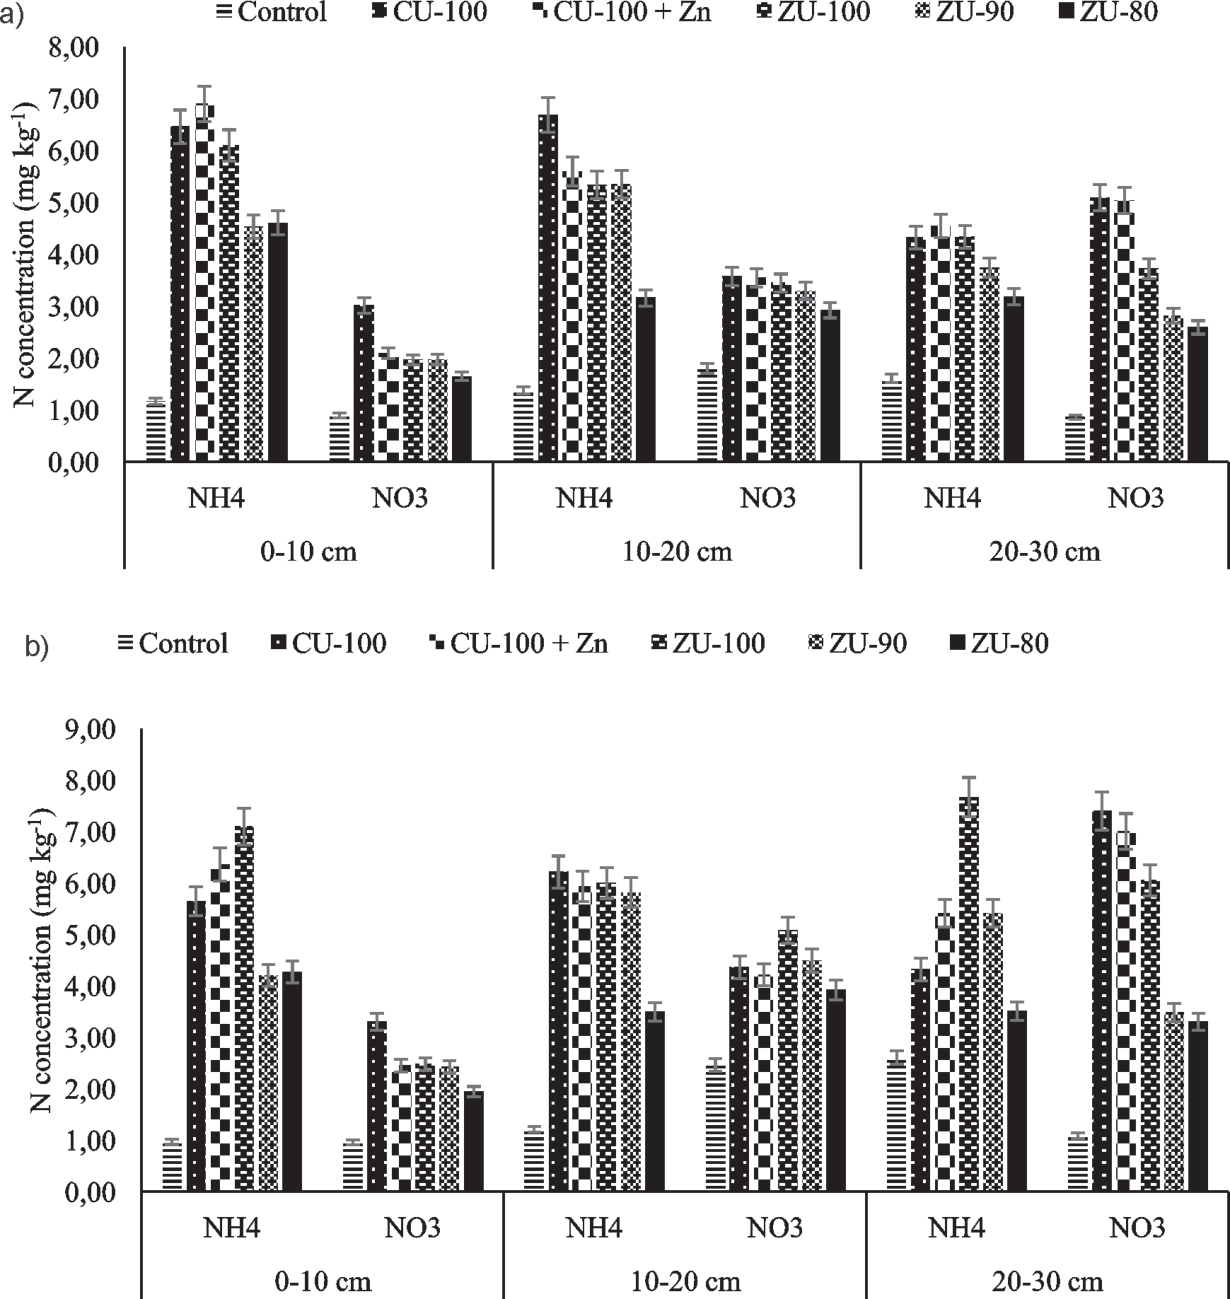
Fig. 14.
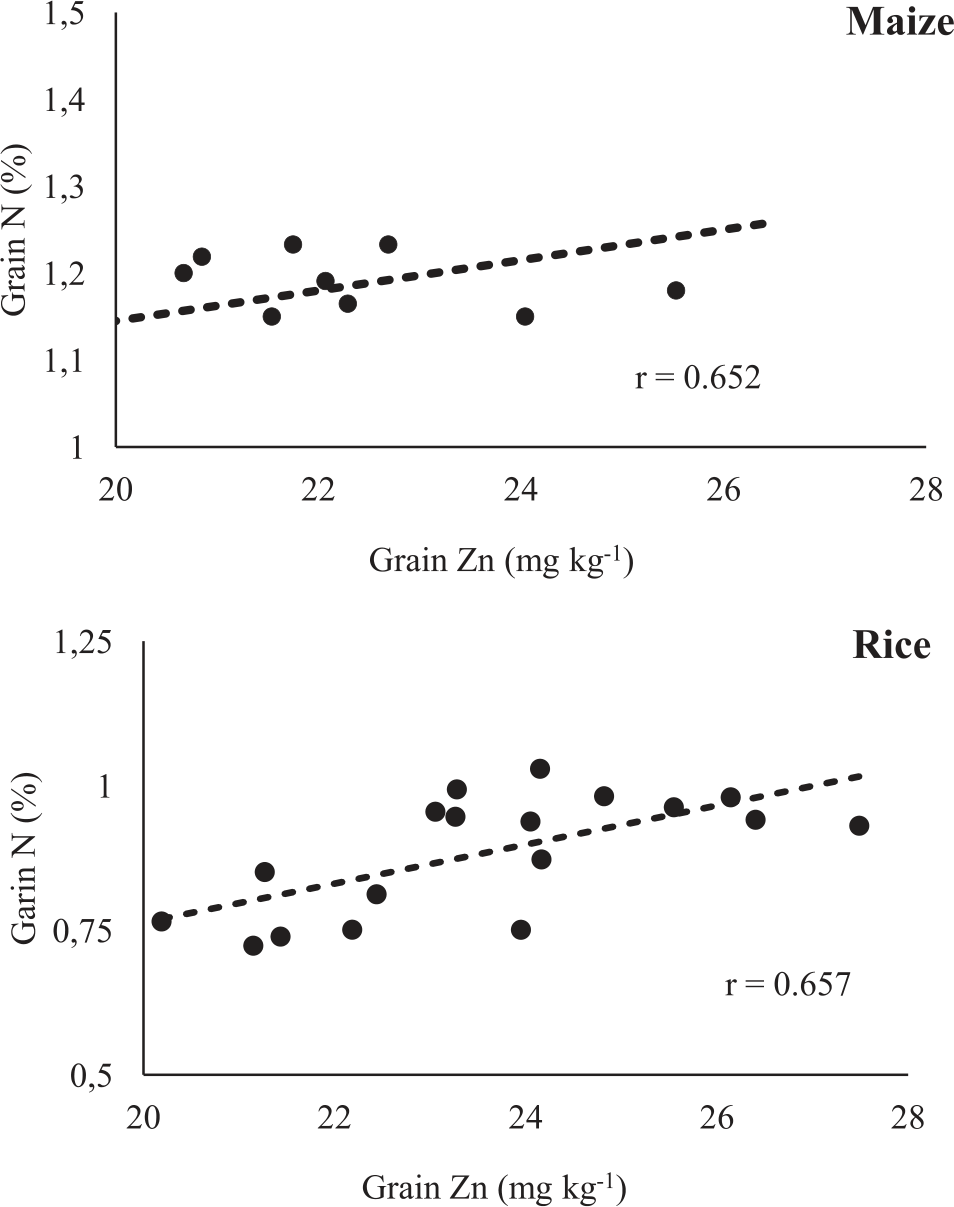
Pearson correlation between Zn and N concentration in grains of rice and maize crop grown under field conditions
The yield parameters such as biomass production and grains yields were significantly increased with the application of ZU. The highest values of growth parameters of maize were recorded with CU100 + Zn which were at par with those recorded with ZU100 and ZU90. However, the highest values of growth parameters of rice as well as yield related attributes of both maize and rice were recorded with ZU100. Grain production is an important parameter contributing towards yield and ZU application increased maize grain and total paddy yield by 18 and 6.0% on average compared with CU while the corresponding increases were 117 and 167% as compared to control (no Zn). These results are consistent with the previous studies [31, 34, 35, 48, 53, 63, 64]. Moreover, the grain yields in ZU90 and ZU80 were found statistically at par with CU100. An increase in these growth and yield attributes due to the application of ZU could be attributed to an increase in Zn and N use efficiency. The increased NUE may have reduced N losses through denitrification, volatilization, leaching and surface runoff [58, 65]. The increased NUE has resultantly increased yield and reduced the cost of production incurred on fertilizer inputs [66, 67]. A reduction in NH3 volatilization caused optimum N uptake owing to application of Zn coated urea [50]. Likewise, applied urea coated with Zn, boron and sulfur recorded an improvement in nutrient use efficiencies and harvest index [53]. These findings suggest the superiority of ZU as a better source of nutrients supply for plant growth and development.
When applied to soil, urea is subjected to various transformation processes; it immediately undergoes hydrolysis yielding NH4CO3 and thereafter it is either taken up by the crop or escapes from the soil system in gaseous form as NH3 as well as oxidized into nitrate which is also a plant available form. The alkaline soils dominantly favor NH3 volatilization losses which have been quantified under natural field condition in the current studies using maize and rice as field crops. In both the field experiments, NH3 volatilization losses in ZU treatments were significantly lower when compared with CU in both maize (-5 to -14%) and rice (-2 to -24%), respectively. The highest concentrations of NH4+-N were recorded at day-4 irrespective of the fertilizer treatments, indicating that virtually all of the urea was hydrolyzed within the first week. However, in case of ZU, the hydrolysis was relatively slow and some concentration of NH4+-N was observed at day-10 and day-14 (Figs 1 and 2) after fertilizer application. The N source and environmental conditions at fertilizer application also influence NH3 volatilization losses [51]. Previous studies also highlighted the potential of ZnSO4 coated urea to reduce NH3 losses as compared to CU [6, 66]. The physical coating may have protected the surface area of urea granules for urease attack, thus slowing down urea hydrolysis and subsequently minimizing the rate of NH3 volatilization.
In this study, physiological and biochemical attributes as well as the activities of enzymatic antioxidants like superoxide dismutase (SOD), peroxidase (POD), catalase (CAT) and ascorbate peroxidase (APX) showed marked response to ZU application in comparison with CU. Overall, the activities of physio-biochemical attributes in maize and rice plants were relatively higher in ZU treated plants while the enzymatic antioxidants were higher in control and CU treated plants than those of ZU treatment. The application of Zn boosts the antioxidant defense system and relieves the plants from oxidative injuries [60, 62]. The stress conditions like impaired nutrient availability induces the formation of free radicals such as H2O2, OH, and O2− which causes oxidative damage to plants [68]. Plants exhibit the antioxidant defense system involving different enzymes such as CAT, SOD and POD, etc. that safeguards them from oxidative damage, as these enzymes scavenge the harmful radicals or convert them into less reactive form [68]. The SOD dissimulates the superoxide radicals and converts it into H2O2 and antioxidant enzymes CAT as well as POD detoxifies the accumulated H2O2 and converted it into H2O.
Another defense mechanism in plants for enhanced stress tolerance is the osmotic adjustment due to compatible solutes (free proline, and soluble proteins) [69]. The soluble protein and free proline maintain leaf turgor, thereby increasing the stomatal conductance for the efficient intake of CO2 in leaves and water through roots [70]. Zn is also involved in the regulation of carbohydrate metabolism and protein synthesis [71]. Proline is a stress indicator, which protects the cell and enzymes and sustains osmoregulation. The accumulation of these solutes ultimately helps plants in coping with the lower water potential caused by water stress [72]. Hence, Zn-induced osmotic adjustment might have helped improve plant’s performance in the present study. These results are in line with previous studies, which suggested that osmotic adjustments alleviate oxidative damages caused under drought stress and resultantly enhance water use efficiency [60, 70].
Nitrogen is vital in many physiological processes, grain quality, and biomass production [73]. It plays a pivotal role in forming chlorophyll, proteides, proteins, and plant hormones [59]. On the other hand, Zn also plays a significant role in physiological functions and it is necessary for the production of chlorophyll, regulating photosynthesis and respiration rate [63, 72]. The positive correlation between grain Zn and N concentration in both maize (r = 0.652) and rice (r = 0.657) indicate a synergism between two nutrients for their uptake and assimilation (Fig. 14). It means that the supply of one nutrient improves the uptake of the other. The highest content of grain Zn and N in both maize and rice in ZU100 treatment indicates ZU superiority to CU treatment and hence elucidate higher uptake of both Zn and N in maize and rice grain. The developed correlation (Fig. 14) has been drawn from the experimental data on grain N and Zn accumulation and complementary impact of the synergism between N and Zn uptake elucidates the benefits of applying Zn in crop production for achieving higher benefits of the fertilizer input. Zinc has a synergistic relationship with N and K, but antagonistic relationships with P, Fe, Ca and Cu [23]. On the other hand, synthesis of transport proteins i.e. nicotinamide (NA) and deoxy-mugenic acid (DMA) involves N metabolism and this mugenic acid family transporters are considered as key players for Zn uptake and transport in cereals [24].
Conclusions
The current findings of field studies on maize and rice crops explicitly elaborated beneficial impacts of ZU application on growth, yield, biochemical attributes and nutrients concentration in grains of both crops as compared to CU application, even lower ZU application i.e., ZU90 and ZU80 produced almost equivalent impact as recorded with CU100 application. The benefits of ZU are possibly linked to lower NH3 volatilization losses of applied fertilizers (5 to 24% compared to CU100) and improved NUE. The supplementation of Zn as coating material showed synergism with N for uptake and assimilation. The application of bioactive zincated urea (Zabardast Urea) is suggested to increase yield and quality of crops in both upland (maize) and lowland (rice) cropping systems; it is even found effective at lower N application (up to 80% of recommended N) with higher agronomic impact and lower environmental foot prints. Hence, ZU could be a favorable fertilizer in developing countries, especially for small holding farmers.

