


Introduction
Water pollution can arise from both natural processes and human activities. Natural disasters such as volcanic eruptions, flooding events, and landslides give rise to pollution that poses greater challenges in terms of containment and mitigation. The primary factor contributing to global pollution is the escalation of human activity. The aforementioned issue poses a significant risk to both human and environmental well-being. The global prevalence of heavy metal contamination in marine organisms, particularly in developing nations, is a matter of significant concern [1].
Heavy metals, characterized by densities exceeding 4.5 g/cm3, undergo electron loss during chemical reactions, resulting in the formation of uncomplicated cations [2]. These substances have a tendency to amass in aquatic environments and exhibit resistance to decomposition, thereby facilitating the entry of microorganisms into the human body via the food chain. This can potentially result in adverse effects on both humans and the various organisms inhabiting aquatic ecosystems, as well as their respective predators [3]. Seawater is contaminated by heavy metals that are introduced through the discharge of industrial and domestic waste into rivers, as well as through incidents of oil spills. Heavy metals at high concentrations have been found to exhibit toxicity and pose challenges in terms of decomposition [4]. The concentrations of heavy metals in water are influenced by factors such as temperature, pH, and salinity. Lead (Pb) is a hazardous heavy metal present in water due to its potential to induce cellular mutations and carcinogenesis [5]. Lead is commonly present in various substances, such as paint, building materials, heavy machinery, electronic devices, batteries, ammunition, engine lubricants, and fuel [6]. The presence of ports and tourism activities has the potential to introduce lead pollution into coastal environments. Insufficient management of tourism can exert significant pressure on the ecosystem, resulting in the deterioration of marine resources such as mangroves and coral reefs, as well as a decline in the quality of marine water.
The city of Jakarta is characterized by the presence of rivers that exhibit high levels of pollution. Situated along the coastline, the Angke Kapuk Mangrove Forest is located within this context. The region encompassing Jakarta Bay is characterized by the presence of thirteen rivers that exhibit varying degrees of pollution. There is concern regarding the potential generation of waste, including lead, as a result of tourism activities in the Angke Kapuk mangrove forest. Due to the proximity of residential areas, the forest experiences various anthropogenic activities such as tourist boat traffic, ship repairs, and the generation of household waste. The examination of water and sediment samples obtained from the Angke Kapuk mangrove forest has the potential to reveal the presence of lead contamination. The analysis of pollution levels will be conducted using water quality standards outlined in Indonesian Government Regulation No. 22 of 2021, as well as sediment quality standards established by ANZECC/ARMCANZ 2000 from Australia and New Zealand and CCME 2001 from Canada. Water and sediment quality are determined based on these baselines.
Material and Methods
Research Parameters
Samples of water and sediment were collected from the aquatic environment within the Angke Kapuk Protected Forest (AKPF). The parameters that were measured to assess water quality include salinity, temperature, dissolved oxygen (DO), and pH, all of which were measured directly at the sampling site. Sampling was conducted in August 2023. The researchers employed purposive sampling to choose three stations as the sample for this study. During the sampling process, observations were made on the various species of mangrove found at each station. According to the diagram presented in Fig. 1, Station 1 is situated at the tourist pier, Station 2 is located in close proximity to residential areas, and Station 3 is positioned in the outermost region of the AKPF coastline of Jakarta Bay on the Java Sea.
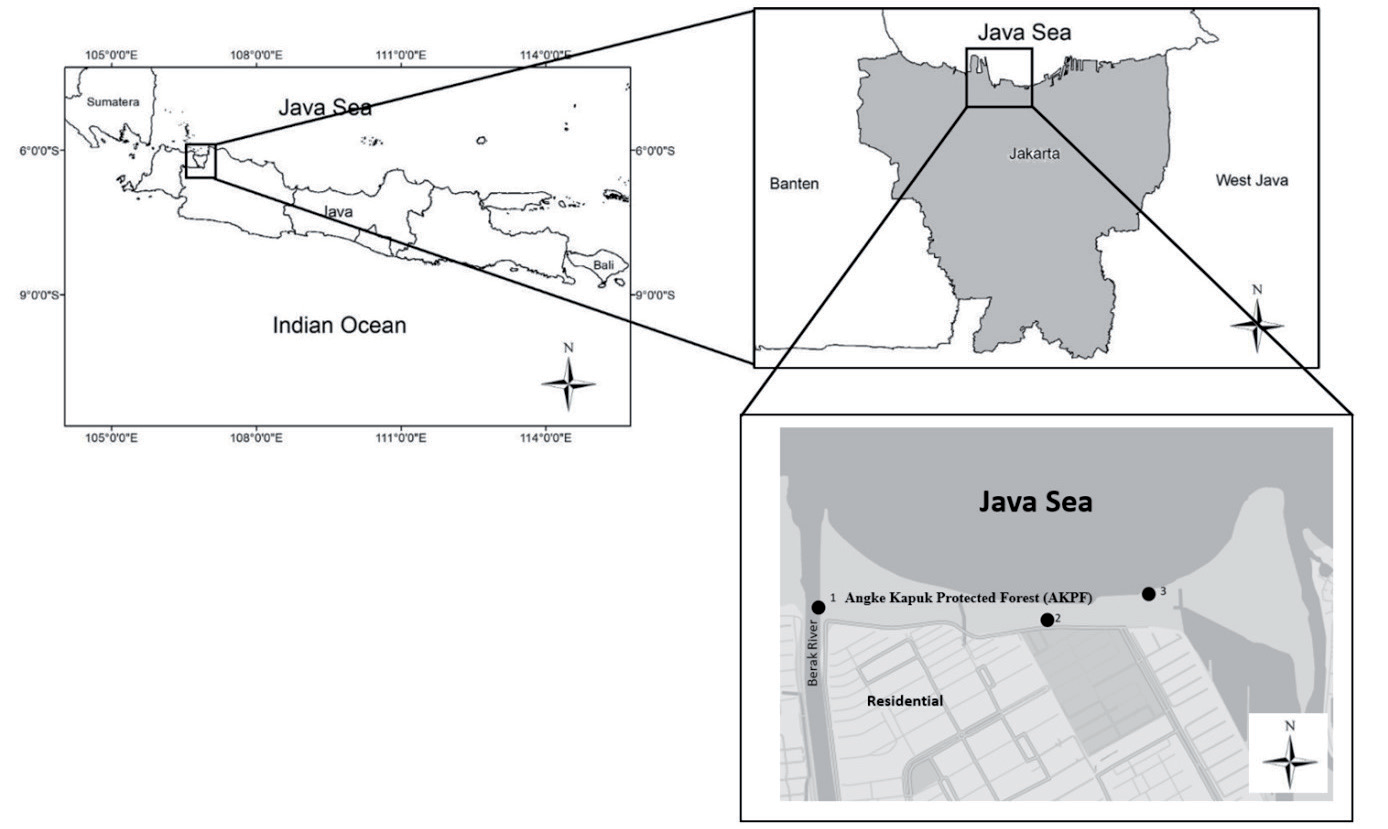
Table 1.
Quality Standards of Water*.
| No. | Parameter | Unit | Category | Quality Standards |
|---|---|---|---|---|
| 1. | Temperature | oC | Mangrove | 28-32 |
| 2. | DO | mg/L | >5 | |
| 3. | pH | - | 7-8.5 | |
| 4. | Salinity | ‰ | <34 | |
| 5. | Lead (Pb) | mg/L | Marine Tourism | 0.005 |
The water and sediment samples were taken from three stations on Sunday 20th of August 2023, due to the potentially high flow of tourist activity in the area. From each station, three substations were designated for sampling-which were taken twice (duplo) to minimize sampling bias. The repetition of the sampling process was done seven days later, on the 27th of August. As a result, a total of 24 samples were taken for this research. Water samples were taken with a water dipper, following methods approved by the Indonesian National Standard 6989.57:2008 regarding water and wastewater. Sediment samples were taken using a core sampler. The samples were subjected to analysis using the Microwave Plasma-Atomic Emission Spectroscopy (MP-AES) technique. MPAES spectrophotometry utilizes atom absorption, making it a flameless and non-hazardous alternative to traditional methods that involve the use of flammable or explosive gases. This atomization technique ensures a higher level of safety [7]. The water parameter measurements and findings from analyzing them are compared with the quality standards set by Indonesian Government Regulation No. 22 of 2021, outlined in Table 1 below. On the other hand, sediment samples taken are compared with the quality standards of lead concentration in sediment for Australia and New Zealand, as specified by ANZECC/ARMCANZ 2000, and for Canada, as specified by CCME 2001, which are presented in Table 2.
Sediment Quality Calculations
The method employed for assessing sediment quality is the Consensus-Based Sediment Quality Guidelines (CSBQ), which are recognized for their elevated threshold value. The outcomes of calculations can be utilized to assess the suitability of sediment, specifically in terms of “contaminated” and “uncontaminated” conditions [8]. The calculation formula can be expressed as follows:
Where: Qm = sediment quality value; Cx = parameter concentration on sediment; PEC = probable effect concentration (highest threshold value); and n = data amount.
Results and Discussion
Water Quality Measurements
The water quality assessments conducted at AKPF exhibit diverse conditions, as indicated by measurements of physical parameters such as temperature, and chemical parameters including dissolved oxygen (DO), pH, and salinity. Water parameter measurements are done two times – each on days one and two of sampling. The mean values of the two measurements done for each station are shown below in Table 3.
The surface temperature of the waters at stations 1 and 2 in HLAK continues to conform to the approved quality standard. During the observation period at station 3, the recorded temperature was slightly lower than the established standard of 27.9 degrees Celsius. The concentration of dissolved oxygen (DO) at station 2 remains below the established standard. The diminished dissolved oxygen (DO) value observed at station 2 can be attributed to the higher turbidity levels of the water in comparison to the other stations. As a consequence, the diminished strength of incoming sunlight results in a reduction in its intensity, thereby impeding the photosynthetic activity of organisms residing in these aquatic environments. In addition to this, the substantial quantity of domestic waste, consisting of both organic and inorganic materials, presents an obstacle to the penetration of sunlight. Multiple studies have indicated a correlation between decreased dissolved oxygen (DO) levels in aquatic ecosystems and elevated levels of organic matter resulting from the discharge of wastewater, oil spills, and other forms of domestic waste [9]. The pH parameter exhibits a range spanning from 6.98 to 7.41. Station 3 exhibits a comparatively elevated pH value in relation to the remaining stations. The reason for this can be attributed to its strategic positioning in close proximity to the ocean. Typically, there is a positive correlation between proximity to the open sea and the pH level of the water, resulting in higher pH values [10]. The salinity levels of the waters in the AKPF region vary between 3 and 16.5 parts per thousand (‰). The salinity of water is interconnected with its temperature and plays a crucial role in determining the extent of bioaccumulation within the water [11].
Table 2.
Quality Standards for Lead Concentration in Sediments.
| Quality Standard | Lead (Pb) Concentration |
|---|---|
| ANZECC/ARMCANZ, 2000 (Australia and New Zealand) | 50 mg/kg (ISQG Low) 220 mg/kg (ISQG High) |
| CCME, 2001 (Canada) | 30.2 mg/kg (ISQG) 112 mg/kg (PEL) |
Concentrations of Lead (Pb) in Water
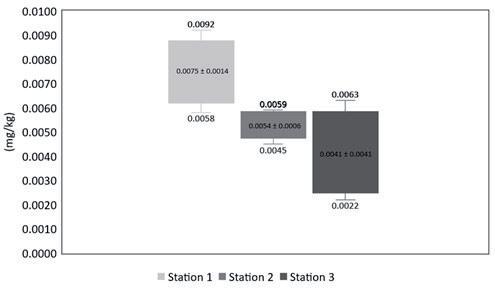
The concentration of lead (Pb) in water is influenced by the quantity of lead waste introduced into aquatic environments. The lead concentration in AKPF waters exceeds the established threshold for marine tourism, specifically 0.005 mg/L. The presence of lead in aquatic ecosystems can have detrimental effects on the reproductive processes, growth patterns, and behavioral patterns of marine organisms [12]. The lead range value concentration measurements are depicted in Fig. 2.
Station 1 exhibits lead (Pb) values that span from 0.0058 to 0.0092 mg/L. Similarly, station 2 displays values ranging from 0.0045 to 0.0059 mg/L, while station 3 showcases values ranging from 0.0022 to 0.0063 mg/L. The disparity observed among the stations indicates that the highest lead value was detected at station 1. The elevated lead concentrations observed at station 1 can be attributed to the presence of a boat dock and the subsequent high levels of tourist activity, in contrast to stations 2 and 3. Based on those results, Station 1 has the highest concentration of lead in its waters. The results obtained are in accordance with the statement made by Chen et al. [13], which states that waters that are contaminated by various activities, including port traffic, have a higher rate of metal contamination. Furthermore, the substantial utilization of ship fuel at the dock contributes to the introduction of lead into the surrounding waters [6]. The high levels of lead (Pb) in the surface water could be linked to plankton activity and the waste dumped by boats in the Western Harbor [14]. Station 3 has the lowest concentration of Pb as it is at the outermost area of AKPF, which experiences tides directly. The diminished levels of lead in the aquatic environment can be attributed to its dispersion through the action of tides and currents [15].
Concentrations of Lead (Pb) in the Sediment
The determination of quality standards for heavy metals in sediments in Indonesia remains lacking, despite the tendency of heavy metal compounds to accumulate in sediments as a result of the deposition process [16]. The sediment at AKPF has been found to have a lead concentration that does not surpass the 2000 ANZECC/ARMCANZ quality standard of 50 mg/kg and the 2001 CCME standard of 30.2 mg/kg. The analysis of sediment samples indicates that the concentration of lead remains within the established quality standard. The presence of a significant quantity of mangroves in the vicinity may be attributed to this phenomenon. Mangrove ecosystems possess inherent capabilities to effectively mitigate environmental contamination caused by diverse types of pollutants, including heavy metals [17]. The lead measurements are depicted in Fig. 3.
Pb levels in stations 1 through 3 range from 0.067 to 0.18; in stations 2 and 3, the values range from 0.093 to 0.2. The concentration of lead in the sediment is found to be the highest at Station 2, even though there doesn’t seem to be any boat traffic. It is so because the station’s placement is further into AKPF, where calm currents reside – which in turn accumulates more heavy metals with time compared to stations 1 and 3. The elevated lead concentration observed at station 2 may be attributed to its proximity to the settlement area, where anthropogenic activities could potentially contribute to the increased presence of lead in the environment. Lead pollution can be attributed to anthropogenic sources, including but not limited to substandard motor fuel, paint, waste sludge, the application of agrochemicals (fertilizers and pesticides), and various domestic practices [18]. Station 2 is situated within the inner region of AKPF, characterized by relatively tranquil currents. Consequently, the sediment at this location exhibits a higher propensity for the accumulation of heavy metals in comparison to stations 1 and 3. According to the findings of the research, the sediment exhibits a higher concentration of lead compared to the water. The occurrence of sludge deposition is attributed to elevated levels of heavy metal content in the water. Heavy metals have a strong affinity for organic matter, facilitating their settling and subsequent binding with sludge particles [19].
The Relationship between Mangroves and the Concentration of Lead (Pb)
Mangroves possess unique ecosystem functions that encompass the provision of ecological, social, and economic services. Furthermore, there exists a global dearth of understanding regarding the ecotoxicology of tropical mangroves [20]. Mangroves possess the inherent capacity to mitigate environmental contamination caused by diverse types of pollutants, including heavy metals. The endodermal cells present in the roots of mangroves serve as filters during the absorption of heavy metals within their immediate surroundings [17]. According to Setiawan’s assertion, the highest concentrations of heavy metals are typically observed in the roots, leaves, and twigs [21]. The roots exhibit the highest accumulations of heavy metals due to their close proximity and direct contact with sediment and water sources that are contaminated with such metals. Table 4 displays the various classifications of mangroves observed within the AKPF region. This data is obtained via direct observation and additional sources from the same location [19].
Fig. 3.
Lead (Pb) Concentration in the Sediment from each of the 3 stations in AKPF (mean and standard deviation in the center).
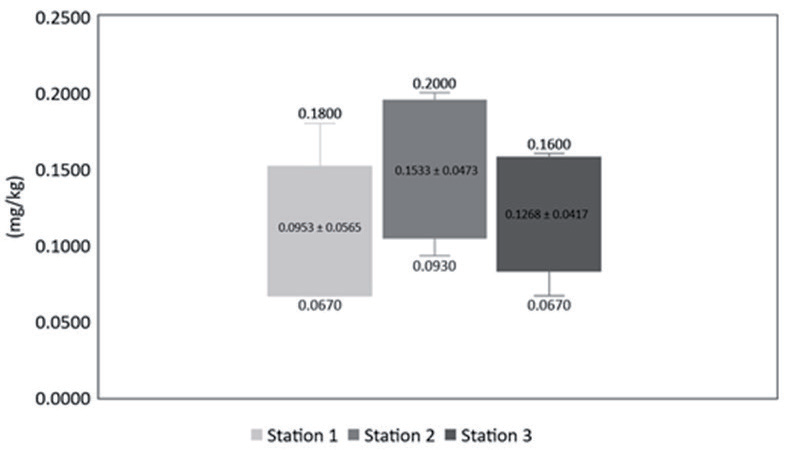
Table 4.
Mangroves Found in AKPF.
The potential reason for the reduced concentration of heavy metals in the sediment at each station, while still adhering to quality standards, could be attributed to the impact of the mangroves present in the vicinity. Mentari [22] conducted a study in the Mangrove Park region of Pekalongan, which revealed a higher concentration of heavy metals in mangrove roots. This can be attributed to the direct interaction between the roots and the water and sediment, both of which also contain significant amounts of heavy metals.
Mangroves are classified into three categories based on their canopy closure – which is the proportion of the forest floor covered by the vertical projection of a tree’s crown/canopy. The canopy closure values in AKPF are analyzed based on research by Sofian et al. done at the same site [23]. Based on said research, the values of canopy closure in AKPF are as shown below in Table 5.
Station 1 has a canopy closure density of 50-69%. The water samples obtained from this particular station exhibit a greater concentration of lead in comparison to the other sampling sites. The proximity of this station to sea water is the reason for this, as it is a ship dock. The presence of the aforementioned species of mangrove in the sediment is associated with reduced concentrations of lead traces. Based on the findings of Rumanta’s research [24], it has been observed that S. caseolaris exhibits a higher capacity for retaining heavy metals when compared to the other species investigated by R. mucronata. The researcher’s findings indicate that S. caseolaris exhibits significant potential as a mangrove species suitable for utilization in phytoremediation efforts within the AKPF context. It is reasonable to infer that the elevated concentration of lead in the waters of Station 1 can be attributed to its susceptibility to increased waste influx. However, this does not hold true for its sediment. This phenomenon occurs due to the continuous movement of water, which has a direct impact on the capacity of lead to permeate the sediment. In summary, the elevated presence of lead in this particular location can be attributed to its function as a ship dock, which aligns with the findings of Chen et al. [13] regarding the association between harbor operations and the concentration of lead in aquatic environments.
Station 2 does not have much canopy closure compared to stations 1 and 3, which have less than 50% closure. The mangrove roots present in this particular station exhibit the ability to effectively retain the lead that enters the surrounding waters, despite the fact that the sediment in this location contains a higher concentration of lead compared to other stations. The location of this station is situated within the most profound regions of AKPF. The metals that are introduced into the water encounter challenges in terms of solubility, leading to a dilution process that ultimately results in their deposition within the sediment. According to the findings of Sanadi’s research [25], A. marina demonstrates a superior capacity for lead absorption compared to S. alba. Nafie et al. [26] reported that there is a tendency for higher levels of heavy metals in N. fruticans. Within this particular location, a significant amount of waste appears to be present, impeding the movement of heavy metals towards the roots of mangrove trees. This phenomenon may explain the difficulty that highly efficient absorber species encounter in accumulating heavy metals within their systems.
Station 3 has a closure value categorized as medium density, at around 50-69%. Hamzah and Setiawan [27] have reported that the concentrations of heavy metals in the mangrove roots of AKPF exhibit higher levels in comparison to those observed in leaves, sediment, and water. Based on the testing outcomes conducted at this facility, no evidence of elevated levels of lead concentration has been detected. In contrast, the concentration of lead in Station 3 is observed to be comparatively lower. This phenomenon can be attributed to the close proximity of the station to Jakarta Bay. The presence of lead in water and sediment results in its rapid dispersion into the ocean, where it undergoes natural dilution by water. According to the findings of Hossain et al. [28], who analyzed the relationship between mangroves and heavy metals, the mangrove species E. agallocha, A. officinalis, and S. apetala show little ability to accumulate heavy metals.
Table 6.
Sediment Quality Status.
| Station | Qm Value | Sediment Quality Status |
|---|---|---|
| Station 1 | 0,0009 | Uncontaminated |
| Station 2 | 0,0014 | Uncontaminated |
| Station 3 | 0,0012 | Uncontaminated |
In previous research by Jaya et al. [19] at the Angke Kapuk Mangrove Conservation Resort, the average concentration of lead in the area was found to be 0.003 mg/L. This shows that the amount of lead concentrated is still within the standard quality, which is 0.005 mg/L for marine tourism. The values for this research are found to be different from the aforementioned research. The higher port traffic in AKPF has a potential effect on a higher concentration of lead in the area compared to the Angke Kapuk Mangrove Conservation Resort.
The determination of sediment quality status in the AKPF mangrove area involves the calculation of sediment quality values (Qm) [8]. Table 6 displays the sediment quality values and corresponding status for each station.
Based on the pollution index data obtained, it can be determined that the water quality status at all stations is classified as lightly to moderately polluted, whereas the sediment quality status at all stations remains uncontaminated.
Conclusions
The levels of lead (Pb) in the water at each station have exceeded the established limit set by Indonesian Government Regulation No. 22 of 2001 for marine tourism, which is 0.005 mg/l. The concentrations of lead in sediment at each station remain below the established thresholds outlined in ANZECC & ARMCANZ, which are 50 mg/kg (ISQG Low) and 220 mg/kg (ISQG High), as well as CCME, which is 30.2 mg/kg (ISQG) and 112 mg/kg (PEL).
Despite the minimal contamination level according to established criteria, the presence of heavy metals in ecotourism areas warrants attention from both the government and the public. Additional information, in-depth research on water contamination, and heightened awareness of the impacts of heavy metals may be necessary.

