

Introduction
Estimation, quantification, and comprehension of sediment transportation in dynamic systems are important for project planning: estimation of dam silting, degradation of aquatic habits, coastline changes [1], and developing efficient agricultural land management strategies [2-4]. Erosion, soil loss assessment, water treatment, association of pollutants with sedimentary particles, and particle depositions at dam reservoirs are all outcomes of suspended sediment phenomena [1, 5, 6]. Quantities of sediment drained to the outlet are linked to several complex factors, such as catchment characteristics, land occupation, channel morphology, initial soil moisture, and hydrological and climatic conditions [7-9].
Estimation of sediment concentration is commonly performed using sediment rating curves with a power function. These curves represent the average relationship between discharge and suspended sediment concentration within a specific watershed [10-13]. Analyzing the Q-SSC relation graphs during flood events allows for the identification of sediment source patterns, which sometimes show hysteresis [14].
Hysteresis pattern is a graphical tool used to analyze and understand the behavior of sediment concentration in relation to discharge (C-Q) at a specific storm event [3, 8, 15-17]. Hysteresis appears when the time lag between the discharge curve and the suspended sediment concentration (SSC) curve is different [18]. Hysteresis is influenced by various factors, including the magnitude and sequence of events, sediment particle size distribution, basin size, land use, and sediment sources. Hysteresis between C-Q was first analyzed by [19]. According to the delay in the peak of the hydrological graph and sediment graph [19], hysteresis is categorized into five common patterns: (I) a single line, (II) clockwise, (III) counterclockwise, (IV) a single line plus a loop, and (V) a shape eight. For a more detailed explanation of the various classes of hysteresis, consult the work of Williams (1989) [20].
Sediment storage along transport pathways was responsible for clockwise hysteresis due to the availability of sediment in streams, leading to the “first flush” effect. Counterclockwise hysteresis appeared to be attributed to enhanced downstream and lateral hydrological connectivity on the surface [21]. The building and operation of water regulation structures modified the SSL-Q supply, carrying capacity, and erosive behavior of the river. These changes can be observed in the sediment rating curve and hysteresis analyses [4].
A hysteresis research has predominantly been conducted in advanced nations. However, there is a pressing need for more extensive investigations, particularly in the Southern Hemisphere, where a distinct opportunity exists to gain insights into hysteresis within diverse climatic and catchment contexts [18]. Moreover, the predominant focus in hysteresis research has been on smaller catchments (<103 km2), where relationships are more straightforward to interpret. Conversely, the application of SSC-Q hysteresis analysis to larger catchments (>103 km2) poses inherent challenges in comprehending sediment dynamics [4].
The Algerian catchment is characterized by contrasting climatic conditions, with summer wind storms and unpredictable fluctuations in rainfall on an annual and intra-annual scale. Frequent heavy rainfall in the region occurs on arid, sparsely vegetated soil, leading to robust surface runoff, which results in substantial soil erosion [8, 22]. This leads to complex flow and sediment concentration during floods.
The aim of this study is to (1) characterize the SSC hysteresis loops and (2) assess the persistency of hysteresis loops across various timescales in the Isser watershed. The outcomes of this case study may offer insights into suspended sediment transport dynamics and sediment budgets, guiding the adoption of effective soil and water conservation measures. This study was conducted using 16 years of data recorded in the Wadi Isser, which flows into the El-Izdihar dam. This last has an initial volume of 110 Hm3 (in 1988), with an annual siltation forecast at about 800 000 m3 [23].
Material and Methods
Study Site and Data Collection
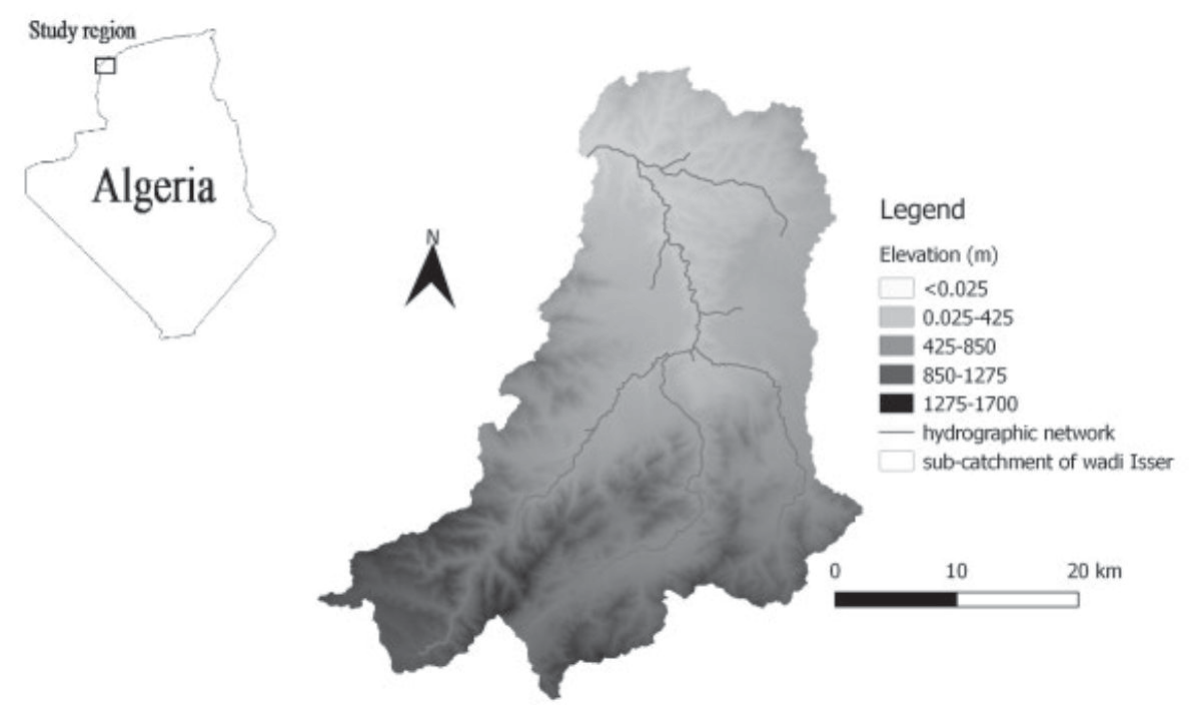
The Isser catchment is the most significant tributary of Oued Tafna due to its extensive course rather than its strong flow. It is located to the east of the Tafna watershed (Fig. 1). Its drainage area is about 1140 km², length of the main stream is about 81 km. The principals’ characteristics of this basin are given in Table 1.
The basin is characterized by a Mediterranean climate; the watershed’s climatology indicates an annual average rainfall of 389 mm. In wet years, precipitation can soar to 600 mm, whereas in dry years, it may drop to less than 280 mm (Fig. 2). The average annual water load is 194x106 m3, while the average annual suspended sediment load is 87×103 tons, with a specific degradation of about 77 tons/km²/year.
The southern part of the Isser catchment is dominated by maquis and degraded forest cover, interspersed with some cereal and seasonal crops, which increases erosion. However, the northern part is more land-covered.
The Isser basin was controlled by the Sidi Aissa hydrometric station (code: 16-06-14) (x = 157.35; y = 199.50; z = 380.0). The instantaneous data measurement of water flow Q and sediment concentration (C) used in this study ranged from 1988-89 to 2003-04 (Fig. 3) was made available by the National Agency of Hydraulic Resources (ANRH). The technique of sampling is the same at the Algerian hydrometric station [17, 24]. The temporal variation of flow Q and sediment concentration C during the study period is illustrated in Fig. 2.
The liquid contribution Ali of period (year, season, month and flood event) is given by:
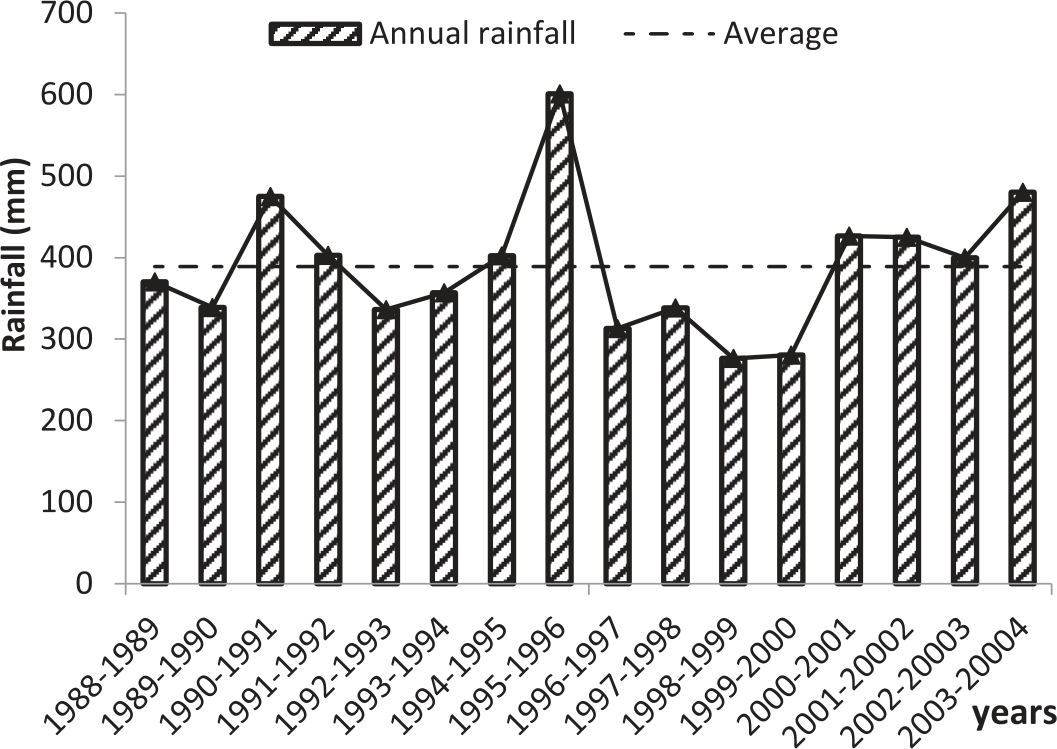
Fig. 3.
Variations of instantaneous measurements of water discharge and suspended sediment concentration during 1988 to 2004 at the Sidi Aissa gauging station.
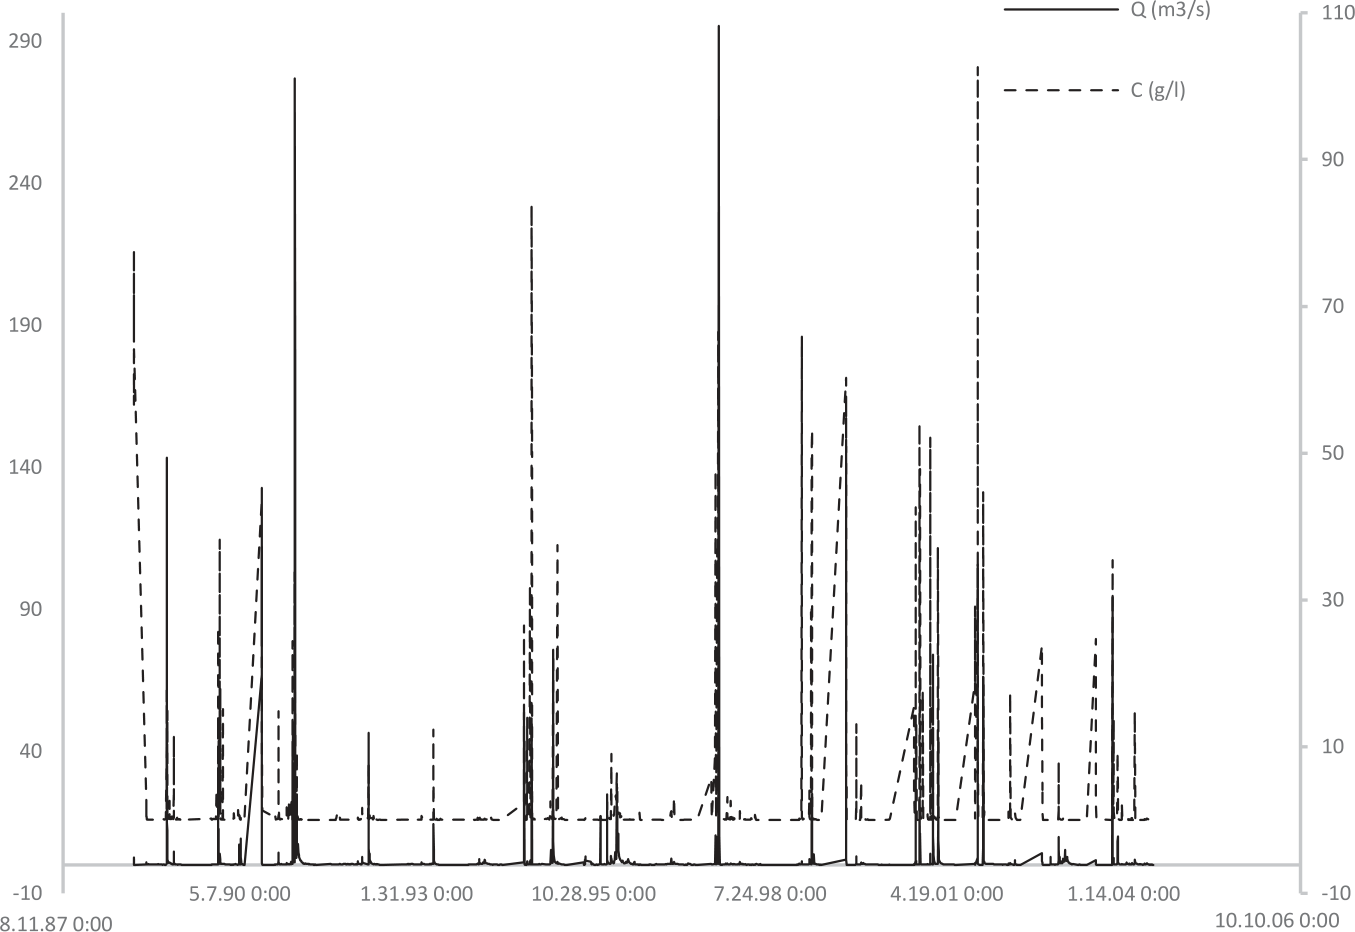
Table 1.
Characteristics of Wadi Isser.
The solid contribution Asi for a period, is given by the relation:
Hysteresis Analysis
Classification
In the literature, there are five classes of hysteresis:
Class I: occurs when there is similarity in the SSC-Q relation in the hydrograph’s rising and filling limbs, there is no hysteresis loop observed, and the sediment concentration and water discharge follow a single line without any significant delay or loop formation.
Class II: the peak of SSC occurs behind the peak of water discharge. In this type, as the water discharge increases, the sediment concentration initially remains low but gradually rises. As the discharge decreases, the sediment concentration remains relatively high before eventually decreasing. This hysteresis pattern often indicates sediment storage and delayed sediment response within the watershed.
Class III: in a counterclockwise hysteresis loop, sediment concentration increases rapidly as water discharge rises, reaching a peak at high water flows. As water discharge decreases, sediment concentration decreases more slowly, resulting in a counterclockwise loop. This type of hysteresis loop typically occurs when sediment transport is dominated by a suspended load and there is a significant supply of fine sediments.
Class IV: the figure-eight hysteresis pattern shows a more complex behavior, characterized by the formation of two distinct loops resembling the shape of a figure- eight. These loops may be clockwise or counterclockwise and indicate different sediment transport behaviors during rising and falling water discharge.
Class V: this shape combines class I with another hysteresis loop. The loop may be clockwise or counterclockwise, indicating different behaviors during rising and falling water discharge. It can contain more than two hysteresis loops, generated by a single or multiple peak flood [9].
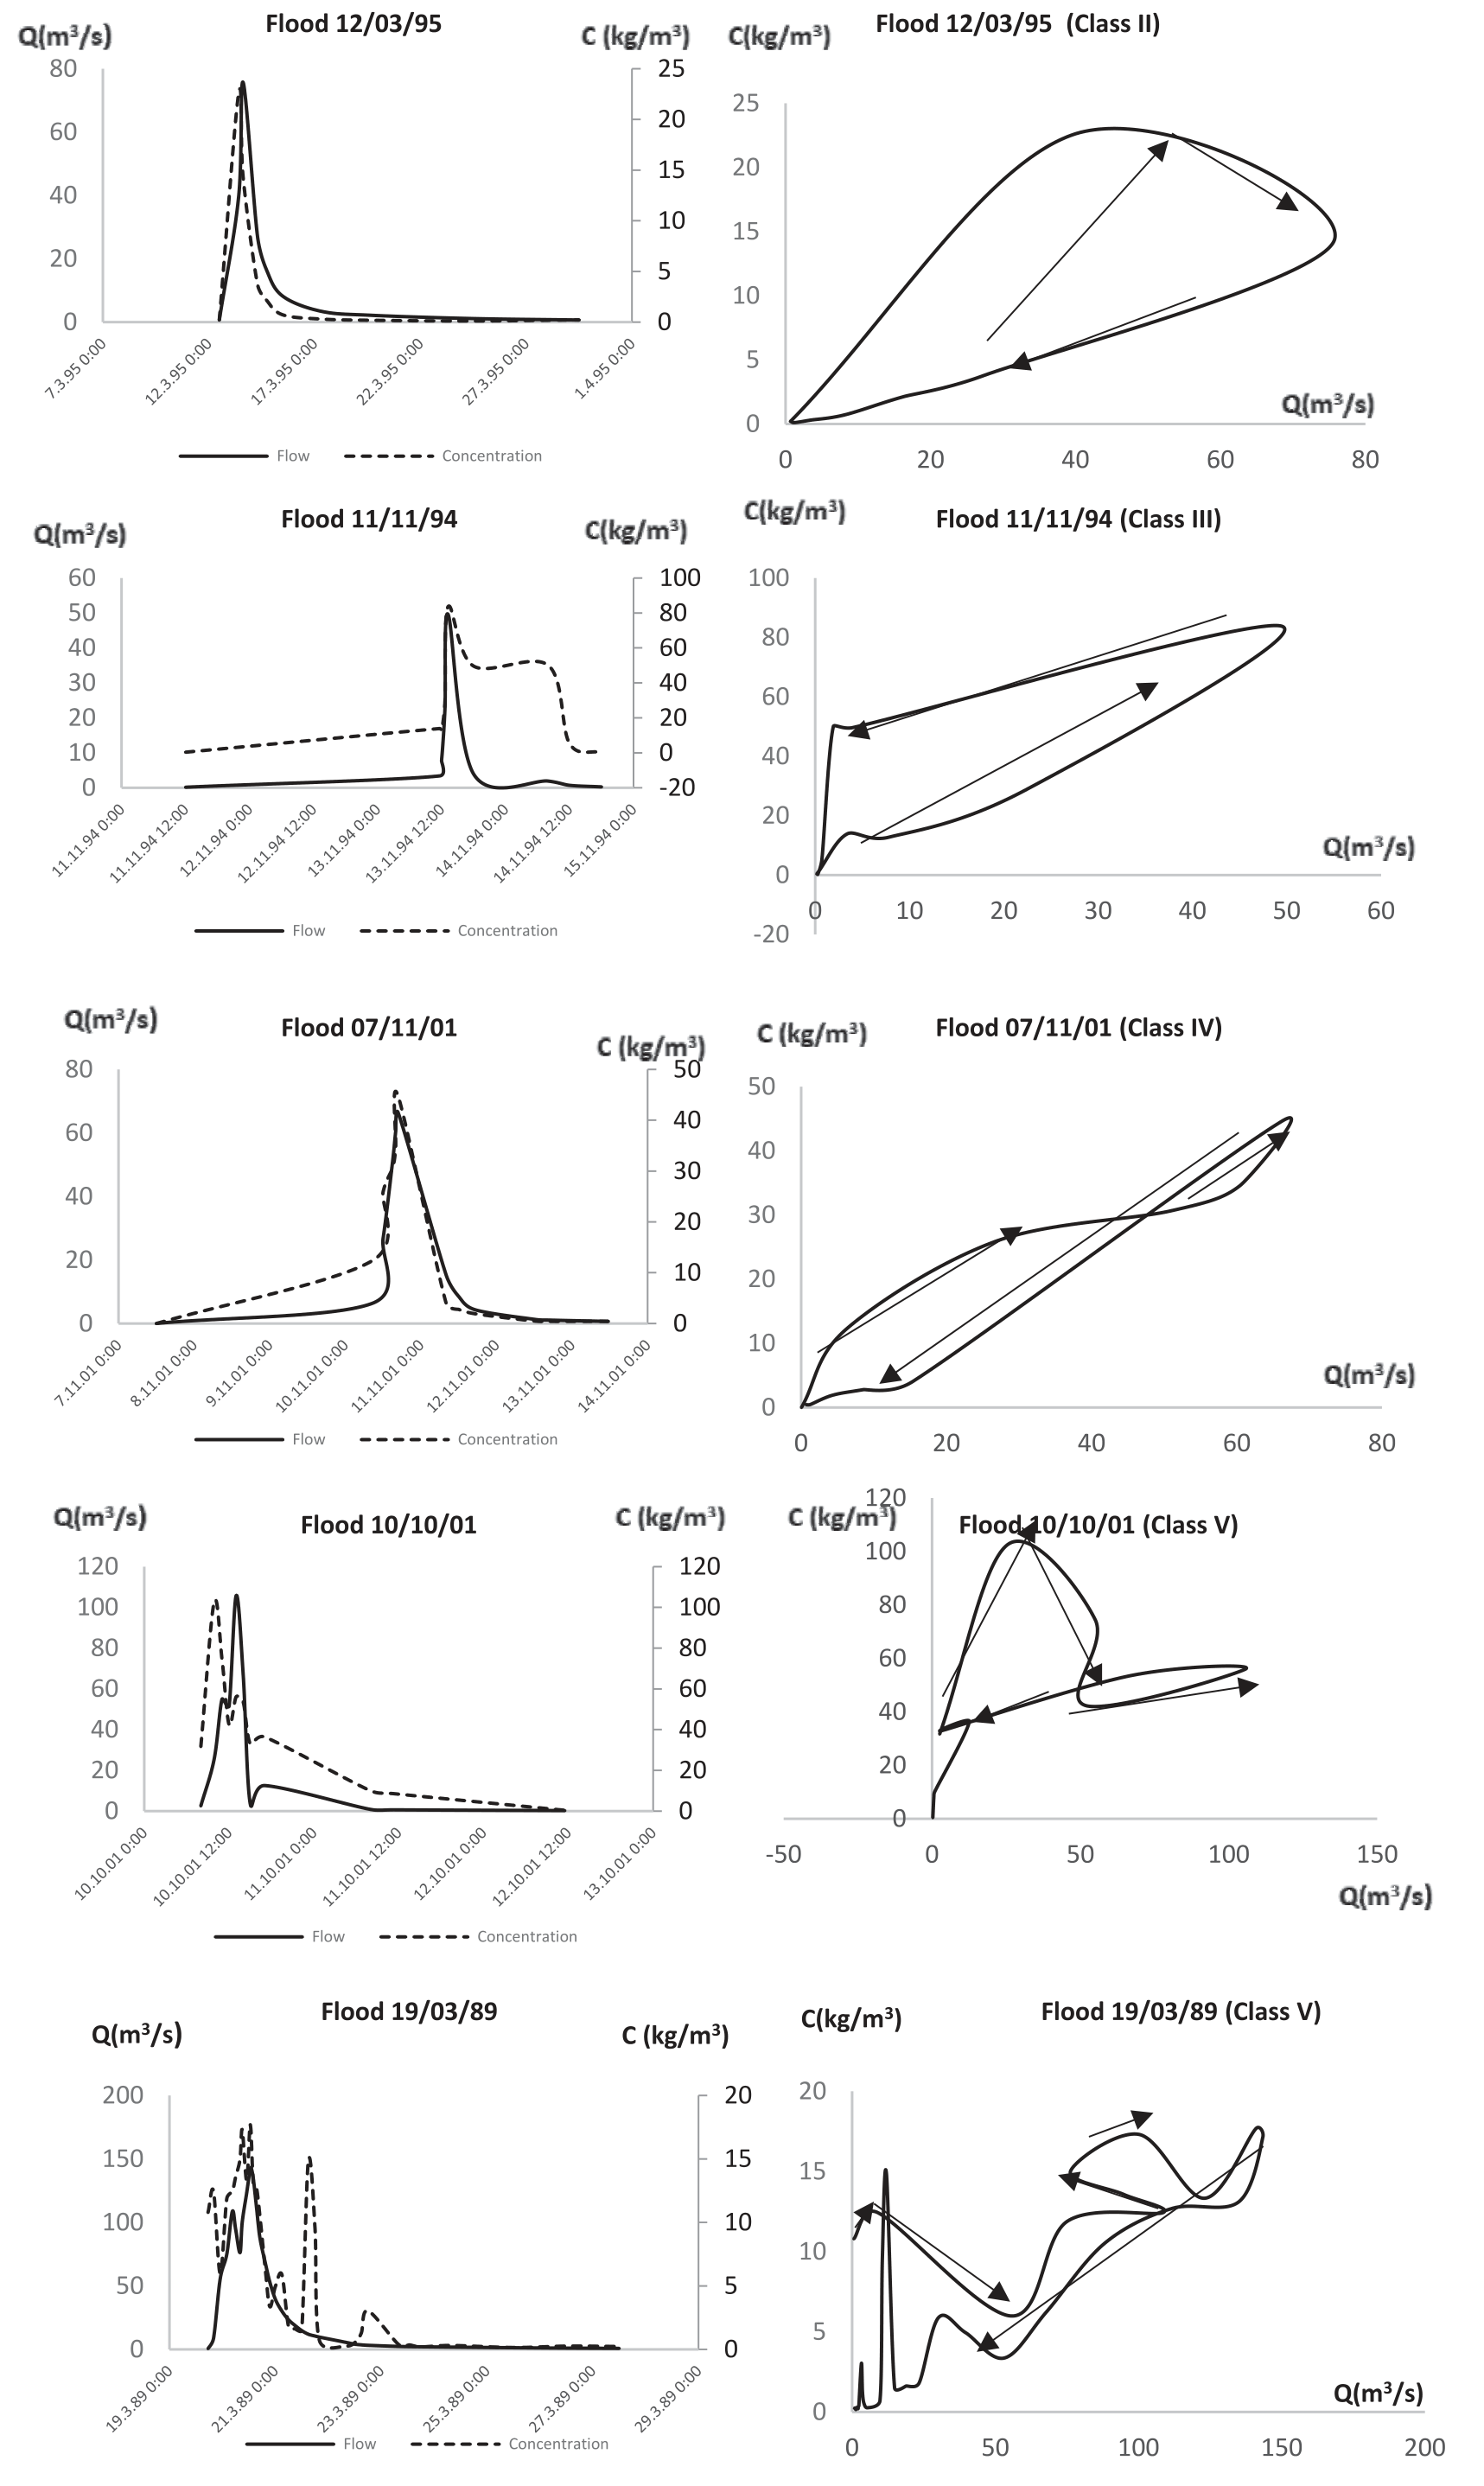
Hysteresis was plotted after selecting 22 important flood events. Table 1 summarizes the characteristics of these flood events. To obtain the hysteresis shape, we have plotted for each flood event the hygrograph of flow discharge Q and the hydrograph of suspended sediment concentration C than the plotted graphs C versus Q relation. Fig. 4 illustrates some flood events.
The hysteresis loop offered a visual comparison of pattern, size, and shape. However, researchers used indexes to quantify hysteresis characteristics [18]. Among them:
1. The hysteresis index HI witch quantify the curves or loops at different stage of hydrograph or the area under the curve. It is defined by [9] as:
Where SSCR and SSCF are the concentration of suspend sediment concentration in rising and filling limb.
2. The peak phase difference P-d-p which is a tool to quantify the manner of the variation of SSC around the peak flow [9] it is given by:
Where TQ–max, TSSC–max and Tflood are respectively the time of the peak of flow, the time of the peak of SSC and the flood duration.
Results and Discussion
Table 1 groups the characteristics and classes of 22 flood events. The maximum flow discharge recorded was 147.3 m3/s, corresponding to the flood event on September 27, 1999. The maximum suspended sediment concentration C observed was 83.76 kg/m3 during the flood event on November 11, 1994. The minimum flow discharge was recorded during the flood event on January 1, 2003, and the minimum SSC was 1.06 kg/m3 during the flood event on December 3, 1995.
The longest-lasting flood was approximately 34 days, starting on February 26, 1996, and lasting until March 31, 1996. The shortest flood duration was that of September 27, 1999, lasting for more than 9 hours. The maximum annual contribution of water load was 73.74%, while the maximum annual contribution for suspended sediment concentration C load was 97.4%.
During the study period, 41% of floods occurred in autumn, 36 in winter, 23% in spring, and 0% in summer.
Application of hysteresis techniques for the selected floods highlights 04 different classes (Fig. 5).
Complex loop hysteresis with a single or multiple flow peak was the most dominant hysteresis in the Isser Wadis (45%) contributing to 38% of the total water load and 63% of the total sediment load during the flood event.
The majority of complex loops occur in autumn (September-October-November), the relationship between discharge Q and suspended sediment concentration C is characterized by low water flow and high levels of suspended sediment. A significant portion of the suspended sediments from the wash load coming from the basin is generated by a considerable area.
The flood of 19/3/89 took the form of a complex shape (Fig. 5) with multiple peak flow and precisely multiple peak of SSC, which can be a result of bank erosion after saturation.
The second dominance loop was a clockwise loop with 36% of flood events, 52% of the water contribution, and 23% of the solid contribution during flood events. This kind of loop occurs in winter (December-January-February) and at the beginning of spring (March). Increasing flow leads to an increase in sediment concentration, and the peak phase difference is low. The relationships between Q and C are very strong; the majority of sediments are derived from the hydrographic network [22].
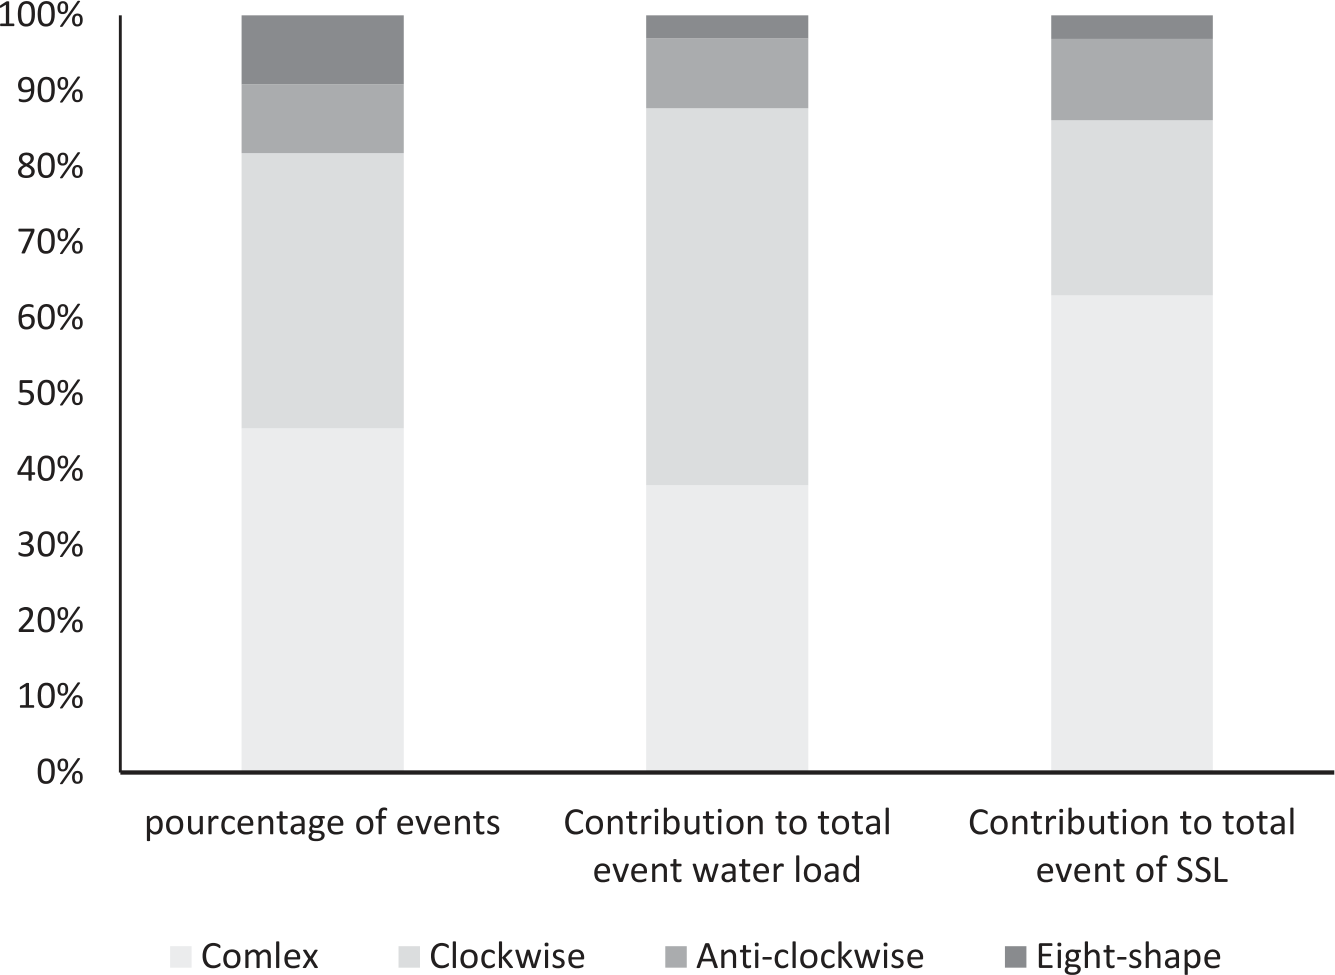
Previous studies in Algerian watersheds showed the dominance of clockwise hysteresis; it represened 60% of floods in the Kebir West River [24], 37% of floods in Wadi Sebdou [8], and 50% of floods in the Mekerra catchment [15].
Classes III, manifested only by 02 floods at the end of autumn (November) and winter (January), generated 03% of the solid load. This shape occurs when the soils are near saturation. Additionally, it may result from a minor rainfall event following a major one, leading to the erosion of stream banks [22].
The figure-eight (class IV) represented 9% of flood events and 11% of the solid flux. It occurs in January and November.
Fig. 6 shows that factor 1 explains 28.21% of the variance of the origin dataset and factor 2 explains 25.5% of the variance of the origin dataset; therefore, more than 50% of the variance is explained by the first two components. No single line hysteresis was found, and concentration variations do not follow flow rate variations. Watershed geometry can justify the absence of such a form in the Isser basin.
The HI index (Table 2) varied between -0.063 and 2.78; only three values closed to 0, which indicated a small difference in the Q-SSC relationship between the rising and falling stages [10]. For the majority of hysteresis floods, the HI indexes indicated a higher value, which reflected the complex behavior between C and C. All peak phase difference values (Table 2) closed to 0, and this extended between Q and C peaks.
The Principal Component Analysis PCA was employed to explore liaisons between different parameters tabulated in Table 2 and determine which of these parameters governed and influenced hysteresis patterns. According to the circle biplot in Fig. 6, water load was the best variable, with loading close to 0.9 for Factor 2 affecting the hysteresis model.
The mean concentration, maximum concentration, and concentration corresponding to the flow discharge peak have loadings higher than 0.7 for factor 1, which means they govern the hysteresis shape. Their closed axes reflect a good correlation between these parameters.
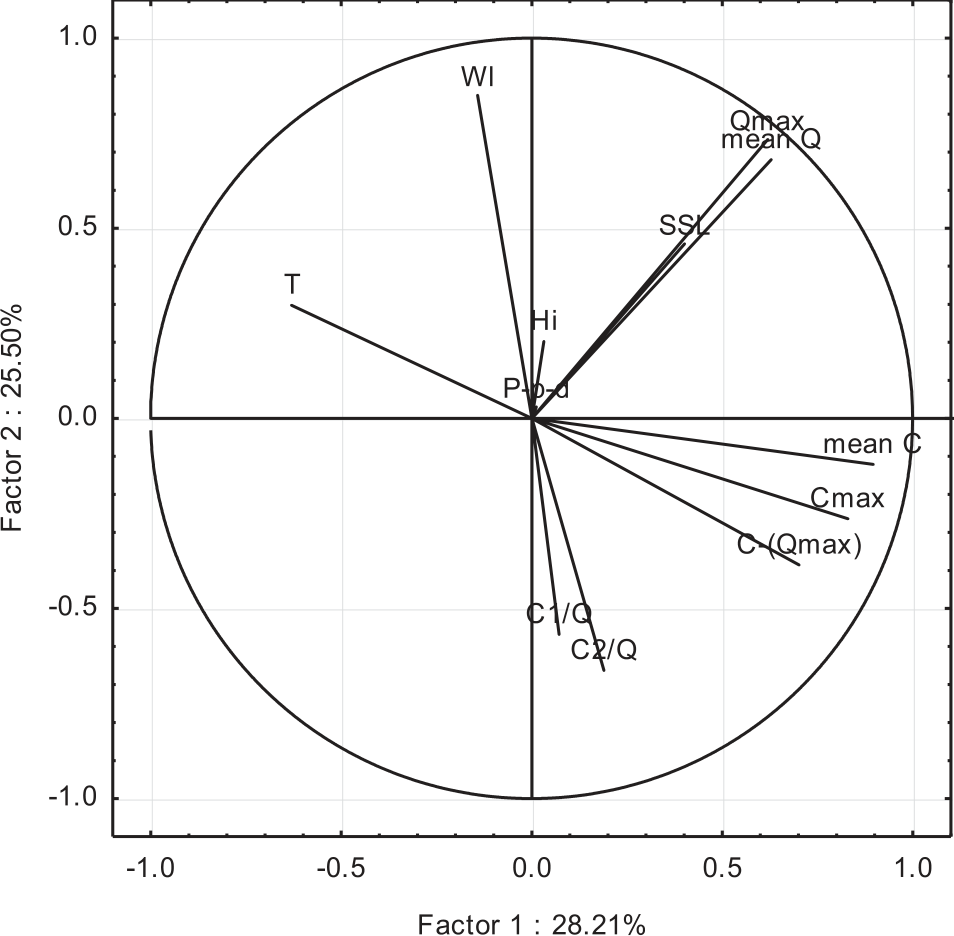
Table 2.
Characteristics of flood events at Isser wadis.
These results agree with [18]. For medium and large basins, precipitation, discharge, and sediments are the mean variables that control hysteresis.
The hysteresis pattern is significantly influenced by the mean and maximum flow discharge, which have a good correlation. Peak phase difference P-p-d and HI index were poorly represented, with low loadings for Factor 1 and Factor 2.
Conclusions
The current study elaborated on the hysteresis method during flood events in the Wadi Isser catchment based on the 2026 data pairs of water discharge and suspended sediment concentration Q-C. Following 22 flood events, we observed four categories of hysteresis patterns, with the complex shape dominating at 36%, followed by the clockwise loop at 23%. The remaining portion was distributed equally between the anti-clockwise and eight-shape patterns. This classification contributes differently to water and solid loads during flood events. Flood events with clockwise hysteresis dominate in terms of water discharge load, accounting for 50% of the contribution. On the other hand, flood events with complex hysteresis acquire the highest contribution in terms of solid load, amounting to 63%.
The PCA analysis reveals that the parameters controlling the hysteresis pattern in the study area are principally: water load, mean concentration, maximum concentration, and concentration corresponding to the flow discharge peak.
Studying hysteresis in flood events is a crucial tool to improve our understanding of the factors that influence suspended sediment dynamics. Which is important for effective water resource management and sediment control strategies in Algerian watersheds. It helps, especially during storm events, which significantly contribute to the total suspended sediment load. The complex interrelationships among variables such as rainfall intensity, spatial distribution, runoff volume, and flow rate pose a significant challenge to achieving more accurate predictions.

