

Introduction
Rural domestic sewage (RDS) refers to wastewater containing a certain number of pollutants generated from rural households, mainly composed of feces, urine, flushing water, kitchen drainage, bathing water, laundry water, etc. Rural domestic reclaimed water (RDRW) refers to water that reaches a certain quality and meets certain usage requirements, and can be used for beneficial purposes after appropriate treatment. It has the characteristics of high N and P content, low content of toxic substances such as HMs, and good biodegradability [1]. Currently, RDRW as an alternative water source for agricultural irrigation can effectively alleviate the shortage of agricultural water, and RDRW irrigation has been widely used in many countries around the world [2, 3].
Researchers at home and abroad on reclaimed water irrigation mostly focus on the impact of changes in HM content in the soil and crop system [4, 5]. Wang et al. [6] found that compared to groundwater irrigation, significant accumulations of Cd, Cr, Cu, Pb, and Zn were led in the soil surface under long-term industrial reclaimed water irrigation. Balkhair et al. [7] found that irrigation with contaminated sewage water containing variable amounts of HMs led to an increase in the concentration of metals in soil. Klay et al. [8] found significant residues of HMs of Pb and Cd in soil through 14 years of reclaimed water irrigation. However, Liu et al. [9] found that compared to using sewage as raw water, soil pollution by HMs was reduced during the process of using reclaimed water to irrigate green spaces in arid areas. The HM content in crops could have a certain impact, and the HMs in various plant organs were varied under reclaimed water irrigation [10, 11]. Batool et al. [12] evaluated sewage water for trace HMs' impact on wheat and found that Cd and Pb were higher with high risk in spinach after wastewater irrigation. Wu et al. [13] found that the distribution of HMs in sugarcane decreased along the direction of roots, stems, and leaves. Jung et al. [14] found that there was no significant difference in HM content in rice plants between those irrigated with domestic sewage and groundwater. The above research results indicated that the HM content in grains was relatively low, due to the barrier effect of the root and leaf systems, which can prevent the migration of HMs to grains [15]. In addition, although the reclaimed water could basically meet the irrigation water quality standards after treatment, the pollutants have not been completely removed. Through leakage and leaching, the HMs can penetrate into underground water bodies, leading to groundwater pollution [16, 17]. Lyn et al. [18] found that the As concentrations in reclaimed wastewater in Hubei and Cu and Fe concentrations in Henan were higher than the upper limits of the reclaimed wastewater standard for agricultural irrigation. Bao et al. found that long-term sewage irrigation did not constitute HM pollution in shallow groundwater; the monitoring of Hg, Pb, and Cu concentrations should be emphasized to prevent HMs from entering the groundwater. Welch et al. found that As has been transported from irrigation, with concentrations reaching 1.0 mg/L in shallow groundwater beneath paddy fields. Yadav et al. [19] found that the Pb concentration in the shallow groundwater near the monitoring point of the sewage channel reached 0.35 mg/L, which has produced groundwater pollution.
At present, most of the studies on the migration and accumulation behavior of HMs in paddy environment and crops under reclaimed water irrigation were focused on the single factor of water, soil, and crops. The types of irrigation crops were mainly vegetable cash crops, food crops were less involved, and the sources of sewage were mainly industrial wastewater or urban sewage. Research on the irrigation and reuse of RDS was relatively scarce, which made it difficult to assess and control environmental risks.
Therefore, in this study, field comparative experiments were adopted to study the migration and cumulative effects of HMs in the system of soil, rice plants, and groundwater under field irrigation and drainage regulations, by using different treatment levels of RDS. The research objectives were (1) to study the distribution of HMs in the system of water body, paddy soil, and rice plants, and analyze the reduction rate of HMs in soil and the bioaccumulation factors (BAF) of HMs in rice grains, elucidating the migration mechanism of HMs in soil and crops under RDRW irrigation regulations, (2) to assess the impact of HMs on human health, determine exposure pathways, and the contribution rate of HMs to human health risks under RDRW irrigation regulations. These study goals could provide important theoretical and technical support for ensuring the ecological environment security of irrigation areas and promoting safe irrigation with reclaimed water.
Materials and Methods
Experimental Site
This study was carried out in the Jinhua RDRW test base (120°10′E, 28°48′N) from June 2020 to October 2022. The annual average rainfall is 1787 mm, the annual average evaporation is 930.2 mm, the annual average temperature is 17.5℃, and the frost-free period is 245 days. In the area of study, a domestic sewage disposal system with a design scale of 400 m3/d was built, which was the source of RDS in this study. The treatment process adopted the secondary biological treatment process (primary treatment was a conventional process, and secondary treatment adopted the A2O process and improved), and the effluent quality met the Class I A standard in the discharge standard of pollutants for urban sewage treatment plants. An ecological pond with a sewage storage capacity of 3000 m3 was built to store and purify the secondary treated water of RDS. A total of 36 experimental plots (20 m×5 m) with automatic irrigation systems were designed and set, and rice seedlings were transplanted on Jun. 26th, Jun. 30th and Jun. 24th, and harvested on Oct. 2nd, Oct. 7th and Oct. 10th, with a rice density of 50 plants/m2, in 2020, 2021 and 2022, respectively. The soil in the test area is sandy clay, and the physical and chemical properties of different soil layers are shown in Table 1.
Table 1.
Physical and chemical properties of different soil layers in the experimental area.
[i] Note: pH, EC, WSS, TN, TP, NH4+-N, and NO3–-N represented soil acidity and alkalinity, electrical conductivity, water soluble salt, total nitrogen, total phosphorus, organic matter, ammonium-nitrogen, and nitrate-nitrogen, respectively. Cr, Cu, Cd, Pb, and Zn represented chromium, copper, cadmium, plumbum, and zinc, respectively.
Field Experimental Design
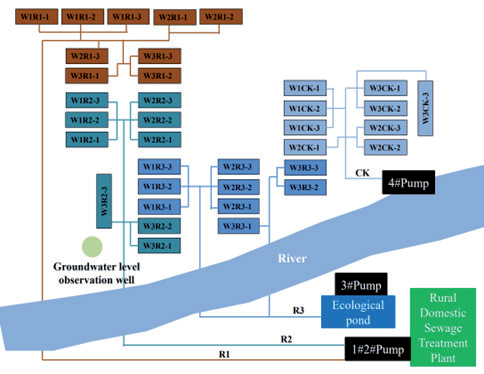
The rice variety was Jiayou Zhongke 13-1, which was planted by sowing. Four kinds of irrigation water sources were used, namely primary treated water of RDS (R1), secondary treated water of RDS (R2), ecological pond water (R3), and river water (CK). Each irrigation water source was connected to the experimental plots through the field irrigation pipe network. The water quality indicators of different water sources are shown in Table 2, and all indicators met the standards for irrigation water quality. Controlled irrigation and drainage were adopted, which was different from the previous water-saving irrigation. The core of irrigation and drainage regulation was to increase the consumption of reclaimed water and provide safe access to fresh water. The water level regulations of controlled irrigation and drainage are shown in Table 3. There were 2 times of fertilization during the growth, i.e., the basal fertilizer of 200 kg/ha compound fertilizer (N:P:K = 18:8:15) and 100 kg/ha urea (with nitrogen content of 47%) on Jun. 25th, Jul. 6th and Jul. 2nd, and the dressing fertilizer of 140 kg/ha compound fertilizer (N:P:K = 18:8:15) and 140 kg/ha urea (with nitrogen content of 47%) on Jul. 12th, Jul. 18th and Jul. 16th, in 2020, 2021 and 2022, respectively. Each irrigation water source and water level regulation was designed for 3 repetitions, with a total of 36 test treatments. The experimental layout is shown in Fig.1.
Indicators and Measurements
For the rice fields, the content of Pb, Cr, Cu and Zn were determined by the flame atomic absorption spectrophotometry, the detection limits were 1.0 mg/kg, 4.0 mg/kg, 1.0 mg/kg and 3.0 mg/kg, and Cd content was determined by graphite furnace atomic absorption spectrophotometry the detection limit was 0.03 mg/kg. For rice plant organs, the contents of Cu and Zn were determined by flame atomic absorption spectrophotometry, the detection limits were 0.2 mg/kg and 1.0 mg/kg, and the contents of Pb, Cr and Cd were determined by inductively coupled plasma mass spectrophotometry, the detection limits were 0.02 mg/kg, 0.05 mg/kg, and 0.002 mg/kg. For the reclaimed water and groundwater, the HMs, including Pb, Cr, Cu, Cd, and Zn, were determined by inductively coupled plasma mass spectrometry, the detection limits were 0.05 µg/L, 0.04 µg /L, 0.03 µg /L, 0.01 µg /L, and 0.01 µg /L.
Calculations and Statistical Analysis
Reduction Rate of HMs
HMs enter the soil environment through irrigation with reclaimed water and are partially reduced through soil self-purification. This study calculated the theoretical input concentration of HMs in different water sources during the reclaimed water irrigation, and the reduction rate of HMs based on the monitored HMs content in soil, annual irrigation water consumption, the average concentration of HMs input from reclaimed water irrigation, and the biomass of rice plants at the end of the growth period (excluding roots). The calculation formula is as follows:
Where β(%) represents the reduction rate of HMs in different water sources, Aij (mg·kg·a-1) is the input number of HMs in irrigation water, Csoil (mg/kg) is the HMs content in the soil, Nj (L/a) is the irrigation water consumption, Cij (mg/L) is the HMs concentration in irrigation water, and P (kg) is the biomass of rice plants.
Table 2.
Description and statistics of water quality indicators of different irrigation water sources (mg/L).
Table 3.
Standard of water level regulations of controlled irrigation and drainage in rice fields (mm).
[i] Notes: (1) The values of the upper and lower limits were water depth maintained by farmland, when it was lower than the lower limit of sewage, irrigated to the upper limit of sewage, when it was higher than the upper limit of storage after rainfall, drained to the upper limit of storage. (2) TG, ET, LT, JB, HF, and MK represented turning green, early tillering, later tillering, jointing-booting, heading-flowering, and milky of rice growth stages, respectively. (3) 1-2 days and 3-5 days exposing field indicated 1 mm and 2 mm cracks in rice fields after exposing field.
Bio-Concentration Factors
After reclaimed water irrigation, HMs entered the paddy soil, and the remaining HMs in the soil were absorbed and accumulated in the plant. In this study, the migration of HMs from the soil to plants was calculated by the bioaccumulation factor (BAF). The BAF was the ratio of HM content in crops to the corresponding element's HM content in soil. The calculation formula is as follows:
Where Cplant (mg/kg) represents the HM content in the grain of the crops, and Csoil (mg/kg) represents the concentration of HMs in the soil. The BAF is divided into four levels, where BAF>1 means strong uptake, 0.1<BAF≤1 means moderate uptake, 0.01<BAF≤0.10 weak uptake, and BAF<0.01 extremely weak uptake.
Health Risk Assessment
The human health risk assessment model proposed by the United States Environmental Protection Agency (USEPA, 2004) [20] was used to evaluate the potential health risks of HMs in rice fields irrigated with reclaimed water. Exposure mediums of HMs mainly include reclaimed water, soil, and crops, and exposure pathways included oral intake, dermal contact, and respiratory inhalation. The health risk assessment mainly considered six pathways, including oral-crop, oral-soil, oral-groundwater, dermal-soil, dermal-groundwater, and inhale-soil. The calculation formulas are as follows:
Oral-crop
Oral-soil
Oral-groundwater
Dermal-soil
Dermal-groundwater
Inhale-soil
Carcinogenic risk
Non carcinogenic risk
Where Rc represents annual carcinogenic risk for pollutants, Ric represents the average personal annual risk of cancer caused by carcinogen of i, CDI (mg/kg·d) represents the daily average exposure dose of chemical substance of i, Qi (mg/kg·d-1) represents the carcinogenic intensity coefficient of chemical carcinogen of i , Rn represents the average annual risk of personal health caused by non-carcinogen of i, RfD (mg/ kg·d) represents the reference dose of non-carcinogenic pollutant of i, and L represents the average personal lifespan with a value of 70 a. When the Rc ≤ 10‒6, there is no risk of cancer or the risk is small and negligible, when Rc ≥ 10‒6, there is a high risk of cancer, when Rn ≤ 1, there is no health risk or that the health risk is low, when Rn > 1, it is believed that it will pose a threat to human health, and the higher the value is, the higher the risk is.
The calculation formulas and corresponding parameter values referred to the User's Guide to the USEPA; the meanings and values of each parameter are shown in Tables 4 and 5 [21].
Results
HM Distribution in RDRW
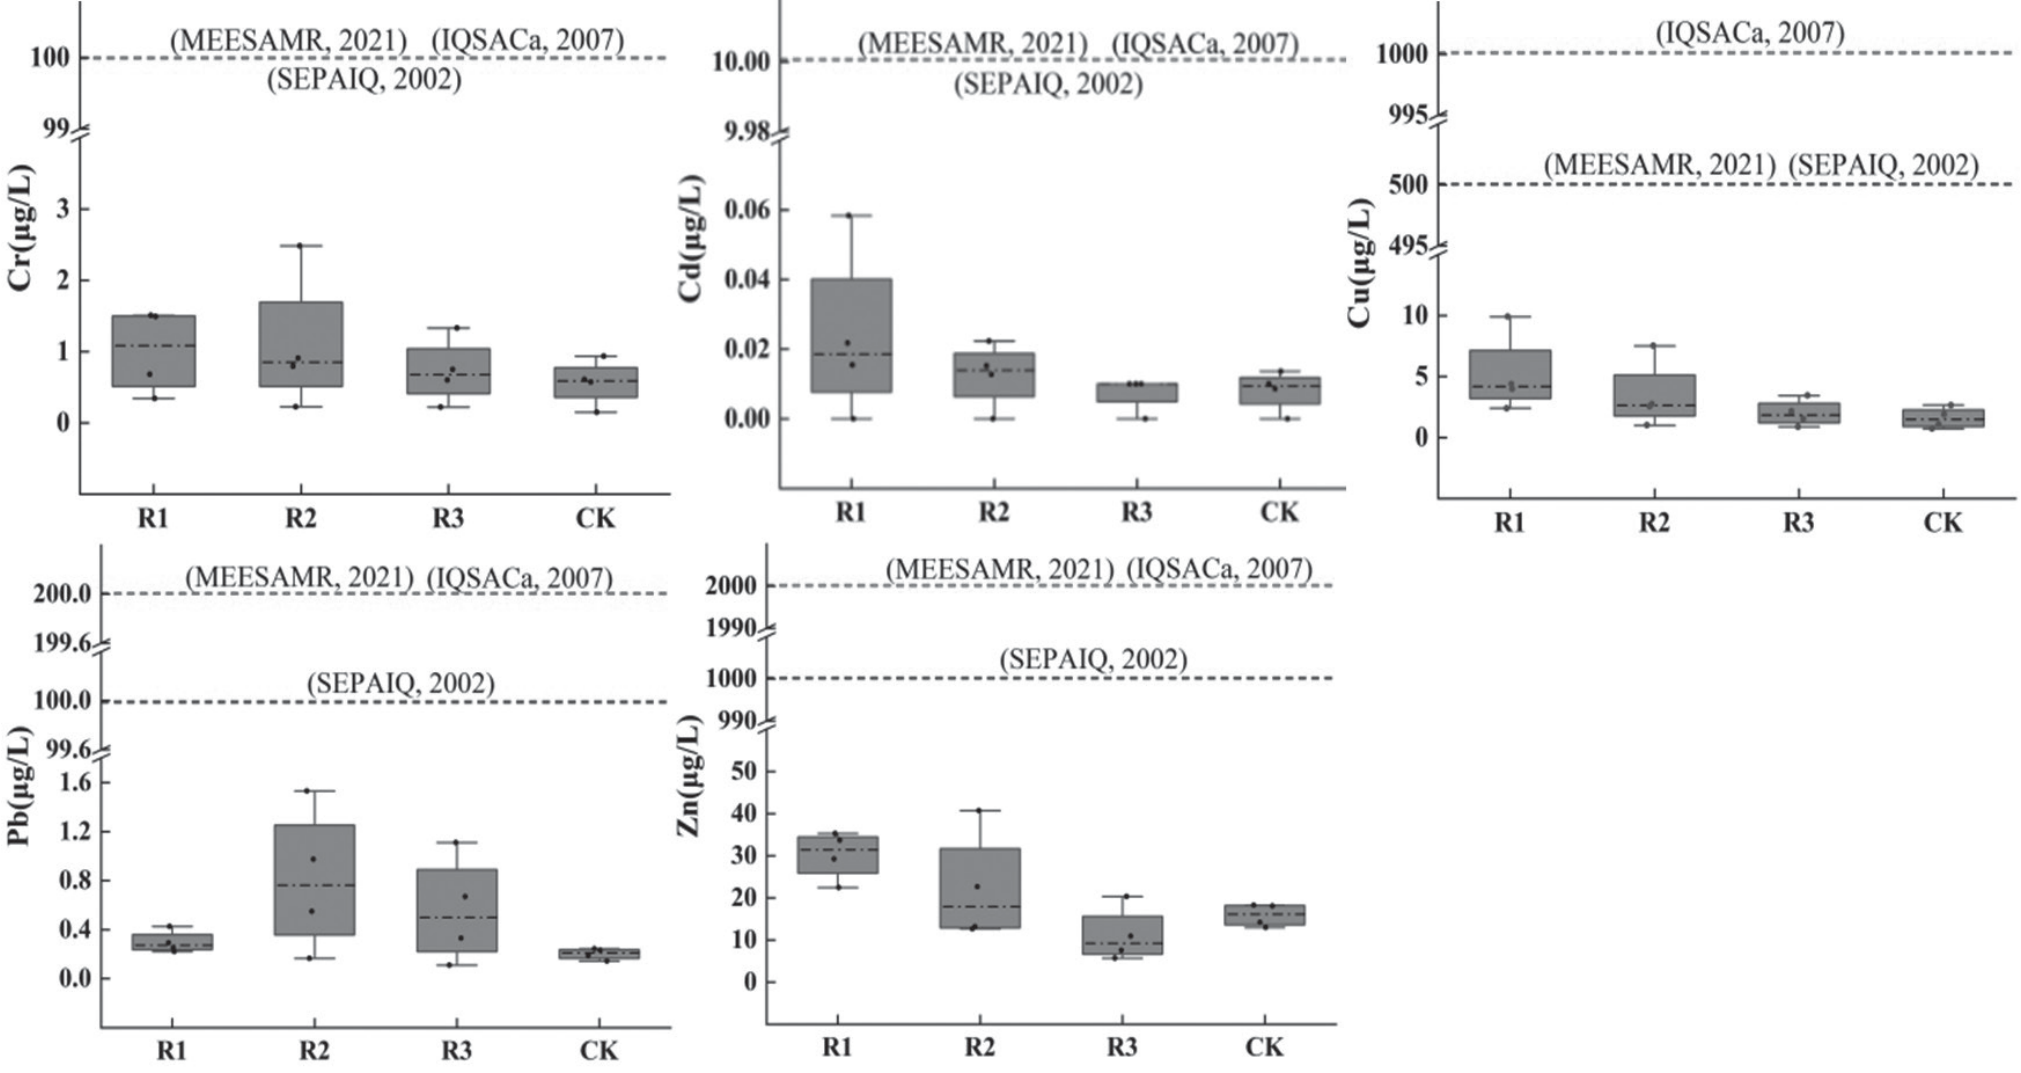
The distribution of HMs in RDRW is shown in Fig. 2. Based on the average values of each quarter throughout the year, it was shown that the HM content in each irrigation water source met the standards for irrigation water quality, the reuse of urban recycling water-quality of farmland irrigation water, and discharge standards of pollutants and municipal wastewater treatment plants. The average concentration of HMs in each irrigation water source was decreased in the order of Zn, Cu, Cr, Pb, and Cd. Compared to CK, the HMs (except for Pb) generally had a certain accumulation effect under RDRW irrigation. The concentration of HMs in R2 was significantly lower than that in R1, indicating that the sewage treatment system can effectively remove the HMs. The concentration of HMs in R3 was generally lower than that in both R1 and R2, which indicated that aquatic plants in the ecological pond had significant purification and elimination capacity for the HMs.
HM Distribution in Rice Fields
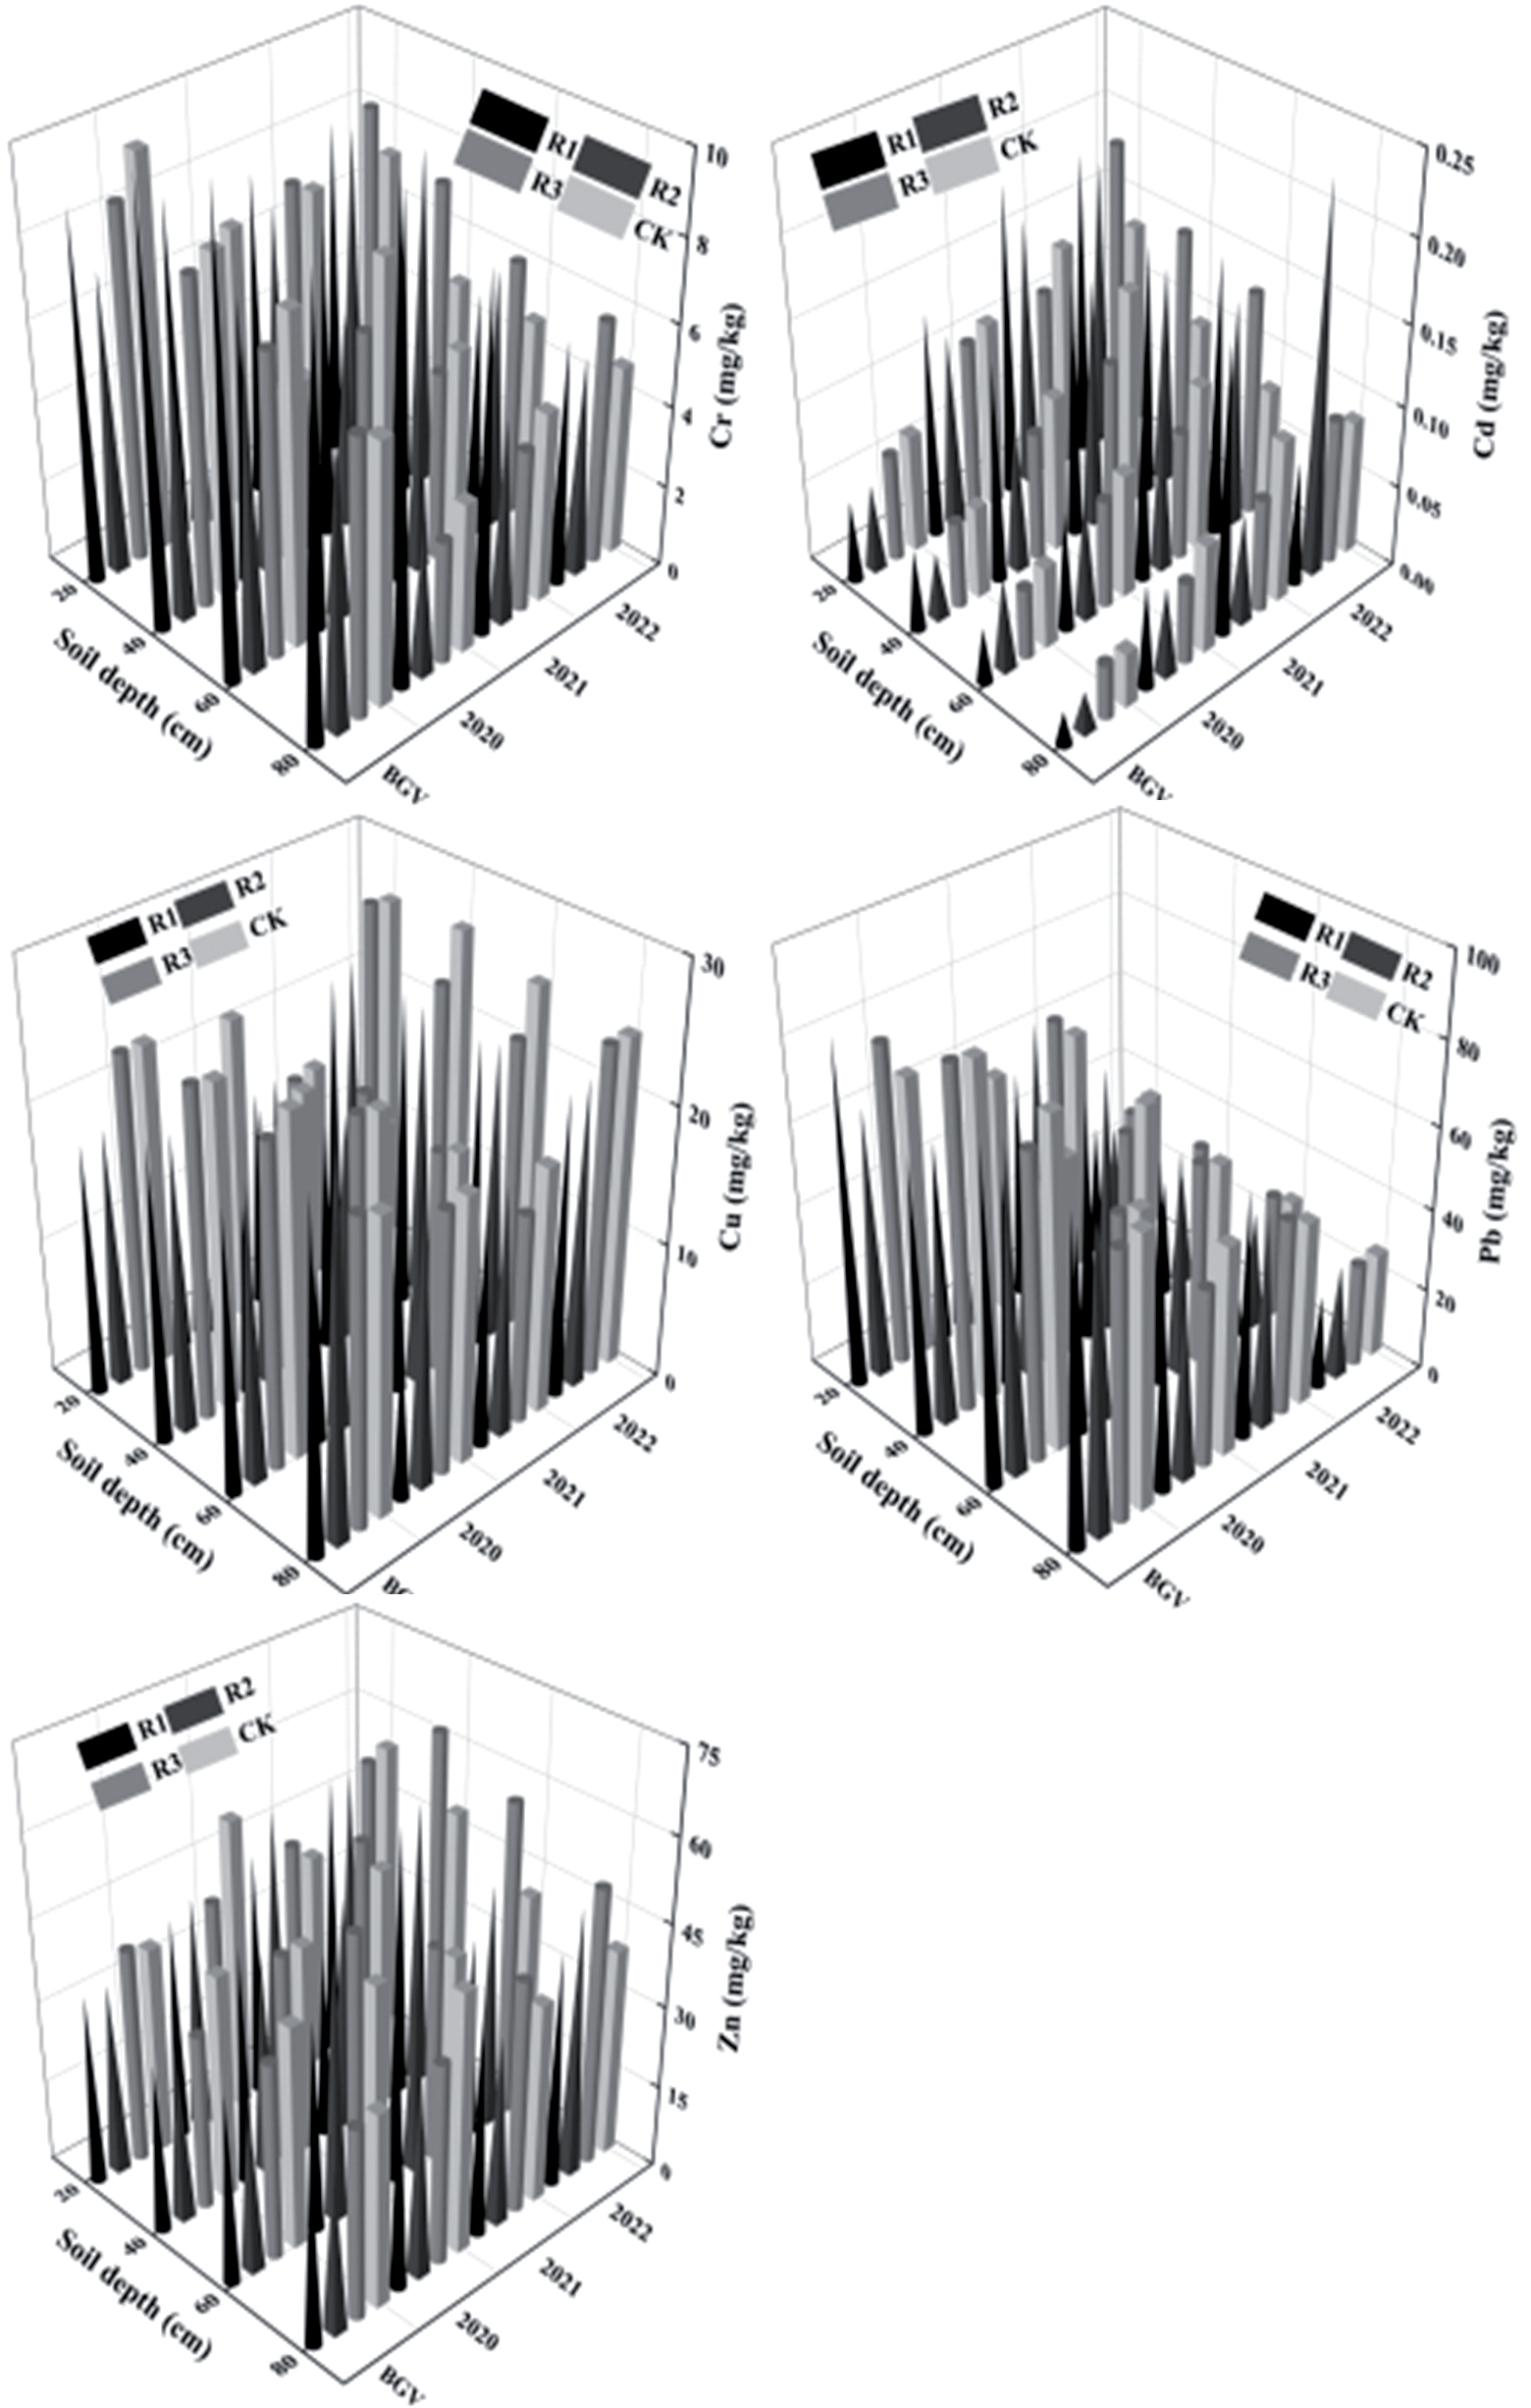
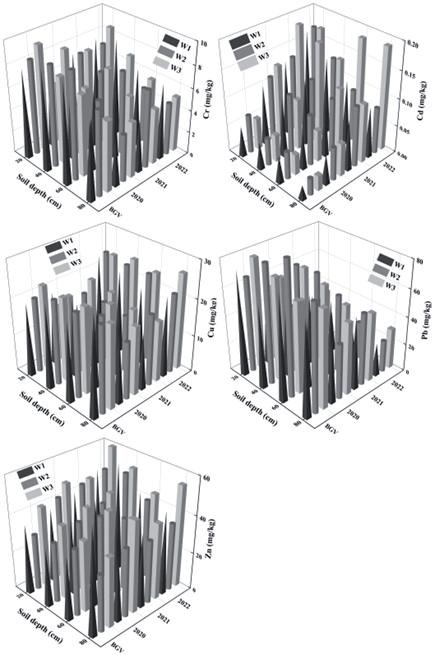
The changes of HM content in soil profiles under different irrigation water sources from 2020 to 2022 are shown in Fig. 3. It shows that the Cd and Zn contents in the soil profile were higher than the background values (BGV), while the Cr and Pb contents were lower than the BGV. The Cu content in soil showed a trend of decreasing first, and then increasing. The HM distribution under four irrigation water sources showed a significant decreasing trend along the depth of the soil layer, and there was a significant accumulation in the surface soil layer (0-20cm). At the end of the growth period, the Cd and Cr contents increased significantly, while the Pb and Cu contents decreased significantly, and the Zn content showed no significant difference in the surface soil. Compared to CK, the Cd content increased by 1.5 times, 1.4 times, and 1.4 times, the Cr content was increased by 1.2 times, 1.1 times and, 1.2 times, the Pb content was decreased by 3.9%, 11.8%, and 5.9%, the Cu content was decreased by 15.6%, 13.0%, and 10.4%, under R1, R2, and R3, respectively. The changes of HM content in soil profiles under different water level regulations are shown in Fig. 4. They were consistent with those under different water sources irrigation. The HM content increased with the increase in water level, but there was no significant difference. On the whole, irrigation water sources had a significant impact, while water level regulations had no significant impact on HM content in soil profiles.
HM Distribution in Rice Organs
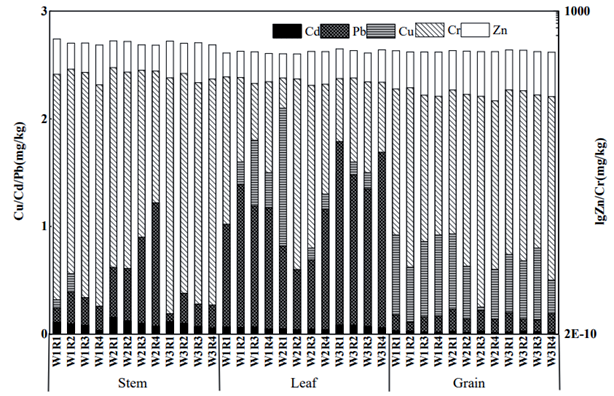
The changes of HM content in the organs of rice plants are shown in Fig. 5. It showed that the HM composition of rice plants was shown a decreasing trend in the order of Zn, Cr, Cu, Pb, and Cd, and it was higher in stems than that both in grains and leaves. For rice grains, the total content of HMs showed a decreasing trend with the improvement of water quality. Compared to CK, the total content of HMs increased by 1.16 times, 1.09 times, and 1.02 times under R1, R2, and R3, respectively. For rice leaves, the total content of HMs was R1≈CK > R2 > R3. Compared to R3, it was increased by 1.07 times, 1.04 times, and 1.06 times under R1, R2, and CK, respectively. For the rice stems, the total content of HMs was consistent with that in grains, compared to CK, it was increased by 1.52 times, 1.26 times, and 1.15 times under R1, R2, and R3, respectively. It indicated that there was a significant accumulation of HMs in rice stems irrigated with RDRW, with the Zn concentration of 71.57 mg/kg (R1), 57.80 mg/kg (R2), 53.67 mg/kg (R3), and 46.67 mg/kg (CK), with the Cr concentration of 3.92 mg/kg (R1), 4.27 mg/kg (R2), 3.41 mg/kg (R3), and 2.62 mg/kg (CK), with the Cu concentration of 0.28 mg/kg (R1), 0.44 mg/ kg (R2), 0.20 mg/kg (R3), and 0.22 mg/kg (CK), with the Pb concentration of 0.35 mg/kg (R1), 0.46 mg/kg (R2), 0.51 mg/kg (R3), and 0.58 mg/kg (CK), and with the Cd concentration of 0.10 mg/kg (R1), 0.08 mg/kg (R2), 0.11mg/kg (R3), and 0.12 mg/kg (CK), showing a significant difference with the changes of irrigation water quality. Under different water level regulations, the total content of HMs showed a decreasing trend with the increase of water level. Compared to W3, it was increased by 1.08 and 1.05 times under W1 and W2, respectively. In general, the HMs content in rice plants under RDRW irrigation was slightly higher than that under CK irrigation, but it in rice grains was not significantly increased, and met the limit requirements for national food safety standard-maximum levels of pollutants in food (Cd ≤ 0.2 mg/kg, Cr ≤ 1.0 mg/kg, Pb ≤ 0.2 mg/kg). Different irrigation water sources and water level regulations did not significantly affect the HM content in rice plants.
HM Distribution in Groundwater
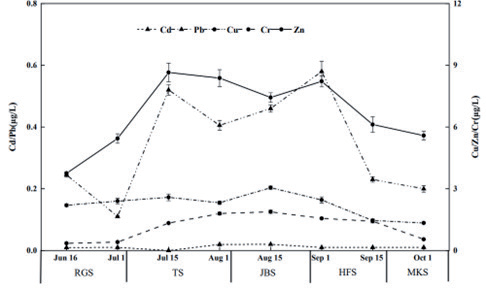
The changes of HMs content in groundwater of the rice field are shown in Fig.6. The average values of Cd, Pb, Cu, Cr, and Zn were 0.01 ug/L, 0.34 ug/L, 2.22 ug/L, 1.16 ug/L, and 6.70 ug/L during the rice growth period, respectively. According to the standard for groundwater quality, the HM concentration in the study area was lower than the limit value for Class I, indicating that the groundwater has not been contaminated by HMs. Due to the unstable irrigation water quality, the HM content fluctuated greatly during different growth stages. The total content of HMs reached a maximum value during the jointing-booting or the heading-flowering stages, and reached the lowest value during the regreening or milky stages, which was mainly due to the relatively higher water demand for the vigorous growth of rice crops during the jointing-booting and the heading-flowering stages, resulting in a significant increase in the HM content brought in by RDRW.
HM Migration in Soil and Crop
The reduction rate of HMs in soil under different irrigation water sources is shown in Table 6. It showed that the average reduction rate of HMs in soil reached 85%, except for weak reduction of Pb, the others had strong reduction ability, reaching over 96%, among them, the reduction rate of Zn was the highest, reaching 99%. Paddy soil had a better reduction effect on HMs, which were 1.05 times, 1.05 times, and 1.04 times under R1, R2, and R3 than that under CK. It indicated that paddy soil can effectively reduce HMs and their toxicity under RDRW irrigation. The BAF of HMs in rice plants under different irrigation water sources is shown in Table 7. There were significant differences in the ability of various plant organs to accumulate various varieties of the HMs. For rice grains, the BAF was decreased according to the order of Zn, Cd, Cr, Cu, and Pb, with Zn and Cd showing moderate uptake, Cr and Cu showing weak uptake, and Pb showing extremely weak uptake. For rice leaves, the BAF was consistent with that in grains, with Cd, Zn, and Cr showing moderate uptake, while Cu and Pb showed weak uptake. For rice stems, the BAF was decreased according to the order of Zn, Cd, Cr, Cu, Pb, and Cu was close to Pb, with Zn showing strong uptake, Cd and Cr showing moderate uptake, and Cu and Pb showing weak uptake. As a necessary element for crop growth, Zn exhibited strong migration ability, while Pb had the weakest migration ability, which may be related to soil physical and chemical properties. In addition, the migration ability of HMs in rice plants was similar under different irrigation water sources; that is, the migration ability of HMs from soil to rice plants was not significantly affected under RDRW irrigation.
Human Health Risk Assessment in RDRW Irrigation
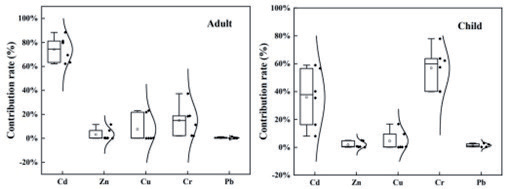
The human health risk assessment of HMs in different exposure pathways is shown in Table 8. The health risks were evaluated through six different exposure pathways. It showed that the total individual annual risks of HMs in both adults and children were within the scope of USEPA [21], carcinogenic intensity coefficient (Qi) and reference dose of non-carcinogen (RfD) for different exposure routes of HMs were shown in Table 5. From the perspective of exposure pathways, the personal annual risk was greatest through oral-crop, accounting for 60.92% and 63.61% of the total personal annual risk, the second was oral-soil, accounting for 38.52% and 34.04% of the total personal annual risk, in adults and children respectively, the relative smallest was through oral-groundwater, dermal-soil, and dermal-groundwater, accounting for 0.0% to 2.21% of the total personal annual risk, no risk was through inhale-soil to human health. Therefore, oral-crop was the main risk exposure pathway. The contribution rate of HMs in rice fields to human health risks is shown in Fig. 7. For adults, Cd had the highest contribution to the total individual annual risk, with a contribution value of 80.48%, indicating that the risk of carcinogenic Cd to adult health was much greater than that of non-carcinogenic HMs. For children, Cd and Cr contributed significantly to the total individual annual risk, reaching 56.99% and 40.90%, respectively, indicating that the carcinogenic HMs of Cd and non-carcinogenic HMs of Cr posed a certain risk to children's health.
Discussion
HM Accumulation in the Rice Field System
In this chapter, we discussed the distribution of HMs in water bodies, paddy soil, rice plants, calculated the reduction rate of HMs in soil and the BAF in plants, and analyzed the migration characteristics of HMs in the soil-crop system. The HM accumulation in different soil profiles varied significantly; HM content in the 0-40 cm layer significantly accumulated, and there was a certain accumulation phenomenon along the rhizome and leaves. Li et al. [22] found that HMs accumulated significantly in the soil layer of 0-20 cm, and can be transferred from the soil to rice grains, stems, and leaves. Njuguna et al. [23] found that HMs accumulated in the soil with wastewater irrigation as time goes on, crops can absorb essential and non-essential HMs for growth from soils, the HMs accumulated in crop tissues, and health risks could be posed after long-term consumption of crops contaminated with HMs. The above conclusions are basically consistent with this paper.
Table 4.
Health risk assessment exposure parameters.
Table 5.
Carcinogenic intensity coefficient (Qi) and reference dose of non-carcinogen (RfD) for different exposure routes of HMs.
Table 6.
The reduction rate of HMs in soil under different irrigation water sources.
| Water sources | Cd | Zn | Cu | Cr | Pb |
|---|---|---|---|---|---|
| R1 | 98.25% | 99.58% | 99.18% | 98.05% | 90.70% |
| R2 | 96.37% | 99.42% | 98.32% | 98.33% | 90.71% |
| R3 | 98.81% | 98.73% | 97.06% | 97.58% | 86.35% |
| CK | 97.52% | 99.40% | 96.66% | 98.03% | 70.69% |
In this study, the results showed that the bioaccumulation ability of various plant organs to HMs was different, and the rice grains that we were most concerned about showed weak uptake of Cr and very weak uptake of Pb. The enrichment capacity of rice plants under different irrigation water sources was similar; that is, the enrichment ability of heavy metals in soil-rice plants was not significantly affected by RDRW irrigation. Rashid et al. [24] found that the enrichment of Cd in crop grains was related to soil physical and chemical properties, and long-term sewage irrigation stabilized organic matter in soil and slowed Cd release. Mao et al. [25] showed that the levels of HMs in soil were decreased with the increase of soil pH, and under low soil pH conditions, rice seedlings were more likely to accumulate the HMs. Chen et al. [26] found that the average BAF of HMs in crops was in order of Cd, Zn, Cu, Ni, Hg, Cr, and Pb, with the highest average risk of Cd, which was easy to migrate to the above ground and accumulate in the seeds. Chen et al. [27] found that due to the poor mobility of the HMs in soil, the overall risk of groundwater pollution under reclaimed water irrigation was relatively low. In this paper, the distribution and accumulation of HMs in rice fields and crops under reclaimed water irrigation were basically consistent with the above research results. However, the response relationship between the migration characteristics and BAF of HMs and physicochemical and bioscope indexes could be further analyzed in the study area.
Human Health Risks of HMs in RDRW Irrigation
The human health risk assessment of HMs in soil, plants, and groundwater in reclaimed water irrigation was conducted. The total annual personal risk of HMs for adults and children in the study area was within the range specified by USEPA. Adults and children had the greatest personal annual risk to humans through oral-crops, accounting for 60.92% and 63.61% of the total personal annual risk, respectively. The risk of exposure to different media through oral ingestion (99.52% for adults and 97.77% for children) was significantly higher than that through dermal contact (0.48% for adults and 2.23% for children) and respiratory inhalation (0.00% for adults and children). The result was consistent with previous studies [28-30].
Table 7.
The BAF of HMs in rice plants under different irrigation water sources.
Table 8.
The human health risk assessment of HMs in different exposure pathways of rice fields.
Fig. 6.
The changes in HM's content in groundwater of the rice field (RGS, TLS, JBS, HFS, and MKS represent the regreening stage, tillering stage, jointing-booting stage, heading-flowering stage, and milky stage, respectively).
For adults, the risk is caused by Cd (carcinogenic), and for children, the risk is caused by Cd (carcinogenic) and Cr (non-carcinogenic). The reason might be due to different physiological characteristics and lifestyle habits, and children were more susceptible to both carcinogenic and non-carcinogenic risks than adults. Whether adults or children, Cd was the main HM element that caused health risks and needed to be taken seriously. Chen et al. [31] found that the risk of Cd pollution in soil was very low, however, Xiao et al. [32] calculated the potential ecological risk in this study area, and it was found that the ecological risk coefficient of Cd was the highest, reaching a strong risk level, and the contribution rate to the comprehensive potential ecological risk reached 89.02%. It indicated that great attention should be paid to the ecological and health risks caused by Cd. Therefore, it was still necessary to strengthen the monitoring of Cd in the research area, take necessary measures to prevent further exacerbation of pollution, and effectively manage the polluted areas under long-term reclaimed water irrigation conditions.
Conclusions
In this paper, the distribution, migration, and accumulation of HMs in soil, plants, and groundwater were analyzed, human health risks were evaluated under RDRW irrigation, and the main conclusions were as follows.
1. The HM content in RDRW met the relevant standards for irrigation water quality, and the HM content in R3 was significantly lower than that in R1 and R2. Under RDRW irrigation, in rice fields, the contents of Cd and Zn were increased, while the contents of Cr and Pb were decreased, and the content of Cu showed a trend of decreasing first and then increasing. Irrigation water sources on the HM content in soil were significantly affected, while water level regulations were not significantly affected.
2. Under RDRW irrigation, the HMs content in stems was higher than that in grains and leaves, and their composition decreased in the order of Zn, Cr, Cu, Pb, and Cd. The HM content in rice grains was not significantly increased; the impact of irrigation water sources on it in rice stems, leaves, and grains was gradually weakened, and the impact of water level regulation on its accumulation in various organs of rice plants was relatively small. The water quality of RDRW was unstable, and the HM content fluctuated greatly; however, the groundwater has not been contaminated by HMs.
3. Compared to CK, the soil had an enhanced ability to reduce HMs, with a reduction rate of over 96% for Zn, Cr, Cu, and Cd under RDRW irrigation. Rice grains showed moderate uptake of Zn and Cd, weak uptake of Cr and Cu, and extremely weak uptake of Pb. Rice leaves showed moderate uptake of Cd, Zn, and Cr, weak uptake of Cu, and Pb. Rice stems showed strong uptake of Zn, moderate uptake of Cd and Cr, and weak uptake of Cu and Pb. The migration ability of HMs in the soil-rice plants system was not significantly affected by RDRW irrigation.
4. The total personal annual risks of adults and children were within the scope of USEPA regulations, with oral-crops being the main risk exposure pathway, accounting for 60.92% and 63.61% of the total personal annual risk, respectively. For adults, Cd had the greatest contribution to the total personal annual risk, with a contribution value of 80.48%. For children, Cd and Cr both had a significant contribution, with 56.99% and 40.90%, respectively. Therefore, Cd was the main element causing health risks for HMs. It is recommended that the monitoring and prevention of carcinogenic HMs of Cd be strengthened in reclaimed water irrigation areas.

