

Introduction
Theories and methods for ecological risk assessment have been developed and refined over the past 30 years through international research efforts [1]. The origins of this field can be traced back to the 1980s, with an initial focus on developed countries and regions such as the United States [2]. “Ecological risk assessment” was first used by the U.S. Environmental Protection Agency (USEPA) in 1990 [3] and has since been continuously improving and revising the ecological risk assessment framework [4]. In 1992, the USEPA released the “Standard Ecological Risk Assessment Framework” [5], while in 2002, Regan et al. proposed the concepts of parameter uncertainty, model uncertainty, and decision uncertainty, enriching the theoretical connotation of ecological risk assessment [6].
Starting from the middle of the 20th century, with the in-depth study of the spatial pattern of the earth’s surface in geography and the rise of landscape ecology, the theory of landscape pattern analysis gradually emerged [7]. As the core content of landscape ecology, which obtains a variety of landscape pattern indices, such as the number of patches [8], the area of patches [9], the fragmentation index [10], the separateness index [11] etc., to quantitatively analyze the categorization and spatial distribution of land-use types in order to describe the spatial variety, complexity, and interconnectedness of landscapes [12], and these indices provide the basis for further research on ecological risk. Changes in landscape patterns can influence ecosystem stability and ecological risk. Their reciprocal feedback alterations in a certain direction significantly influence the prediction of certain ecological processes [13].
Recently, the advent of remote sensing and GIS technologies has led to the development of a multi-indicator integrated assessment method grounded in the ecological risk assessment framework [14]. Instead of relying on a single index, multiple landscape pattern indices and the ecological vulnerability of land-use types are considered comprehensively. Multiple factors are used to develop the landscape ecological risk index (ERI), with weights allocated for a thorough calculation to accurately represent the complex impacts of land-use change on landscape ecological risk [15].
Numerous international studies have focused on the impacts of land use and cover changes on ecosystems. For instance, Worachairungreung et al. analyzed the loss of agricultural land caused by land use changes [16], providing insights into understanding the conversion of land types and their ecological implications. Nze and Agunwamba estimated soil loss using remote sensing data [17], highlighting the value of technology in quantifying ecological process indicators. Rattanarat et al. explored the role of policies in land use changes [18], offering guidance for analyzing driving factors. However, such studies are mostly concentrated in general regions. Due to the unique geographical climate and ecological environment in the plateau areas with complex terrains, existing research has difficulty accurately revealing the internal mechanisms and spatio-temporal patterns of landscape ecological risks under land use changes. The accuracy and applicability of ecological risk assessment are insufficient, making it challenging to provide practical and effective decision-making support for regional ecological protection and sustainable development.
China’s terrain is complex and diverse [19], with ecosystems in alpine mountainous areas being particularly vulnerable [20]. Drastic changes in land-use patterns in these regions can easily lead to spatial use conflicts and exacerbate the risk of ecological degradation [21]. The Hainan Prefecture is located on the eastern periphery of the Tibetan Plateau, experiencing a distinctive alpine climate and rich biodiversity [22]. However, in recent years, anthropogenic interference has made environmental degradation a major issue that has garnered a lot of attention. Assessing the landscape ecological risk in this region is essential to lessening these effects and encouraging sustainable land-use practices.
Chen et al. presented a thorough review of the advancements in ecological risk assessment in China [23]. Regarding landscape ecological risk assessment, in 2022, Liang et al. introduced a novel methodology for evaluating the ecological risk associated with land-use change on the Qinghai-Tibet Plateau, emphasizing the greatest ecological risk in the southeastern region and along the plateau’s periphery [24]. Wang et al. conducted a landscape ecological risk assessment and effects study of the Qinghai-Tibetan Plateau, enhancing the comprehension of ecological risk in the area [25].
These works offer a theoretical foundation and technological methodologies for assessing landscape ecological risk. Nevertheless, in the northeastern region of the Tibetan Plateau, the construction and spatial and temporal evolution of the landscape pattern are incomplete. There is a lack of in-depth exploration into the key elements and complex interaction mechanisms of regional ecological risk formation. This leads to difficulties in precisely quantifying the impact of land use changes on landscape ecological risks and constructing a risk assessment system that conforms to regional characteristics. Solid scientific bases are scarce when formulating ecological protection and sustainable development strategies. Consequently, conducting a comprehensive study on the alterations in landscape patterns and their ecological risks in the northeastern region of the Qinghai-Tibet Plateau is of substantial practical importance and urgency.
This study utilizes land-use data from 1980 to 2020 in Hainan State. The region’s complex alpine climate and rich biodiversity, coupled with increasing anthropogenic disturbances, pose significant challenges. Previous research in this area has been hampered by a lack of comprehensive understanding of the subtle changes in landscape patterns and the ecological risks they entail. In particular, the traditional crude categorization of land use types has failed to adequately capture the complex ecological characteristics of the region. To this end, this study pioneered a refined methodology that subdivided grassland categories into high / moderate / low cover grasslands. This fine-grained categorization is combined with a series of advanced landscape pattern indices and ecological risk assessment models to construct a comprehensive and detailed landscape pattern framework for Hainan State over a 40-year study period. The spatial and temporal characteristics of ecological risk are elucidated. On this basis, the ecological risk area is delineated, and a proposal for ecological governance zoning control in Hainan Prefecture is advanced in a targeted manner. This provides a quantitative reference and decision-making basis for risk prevention and control and high-quality development of the plateau region.
Materials and Methods
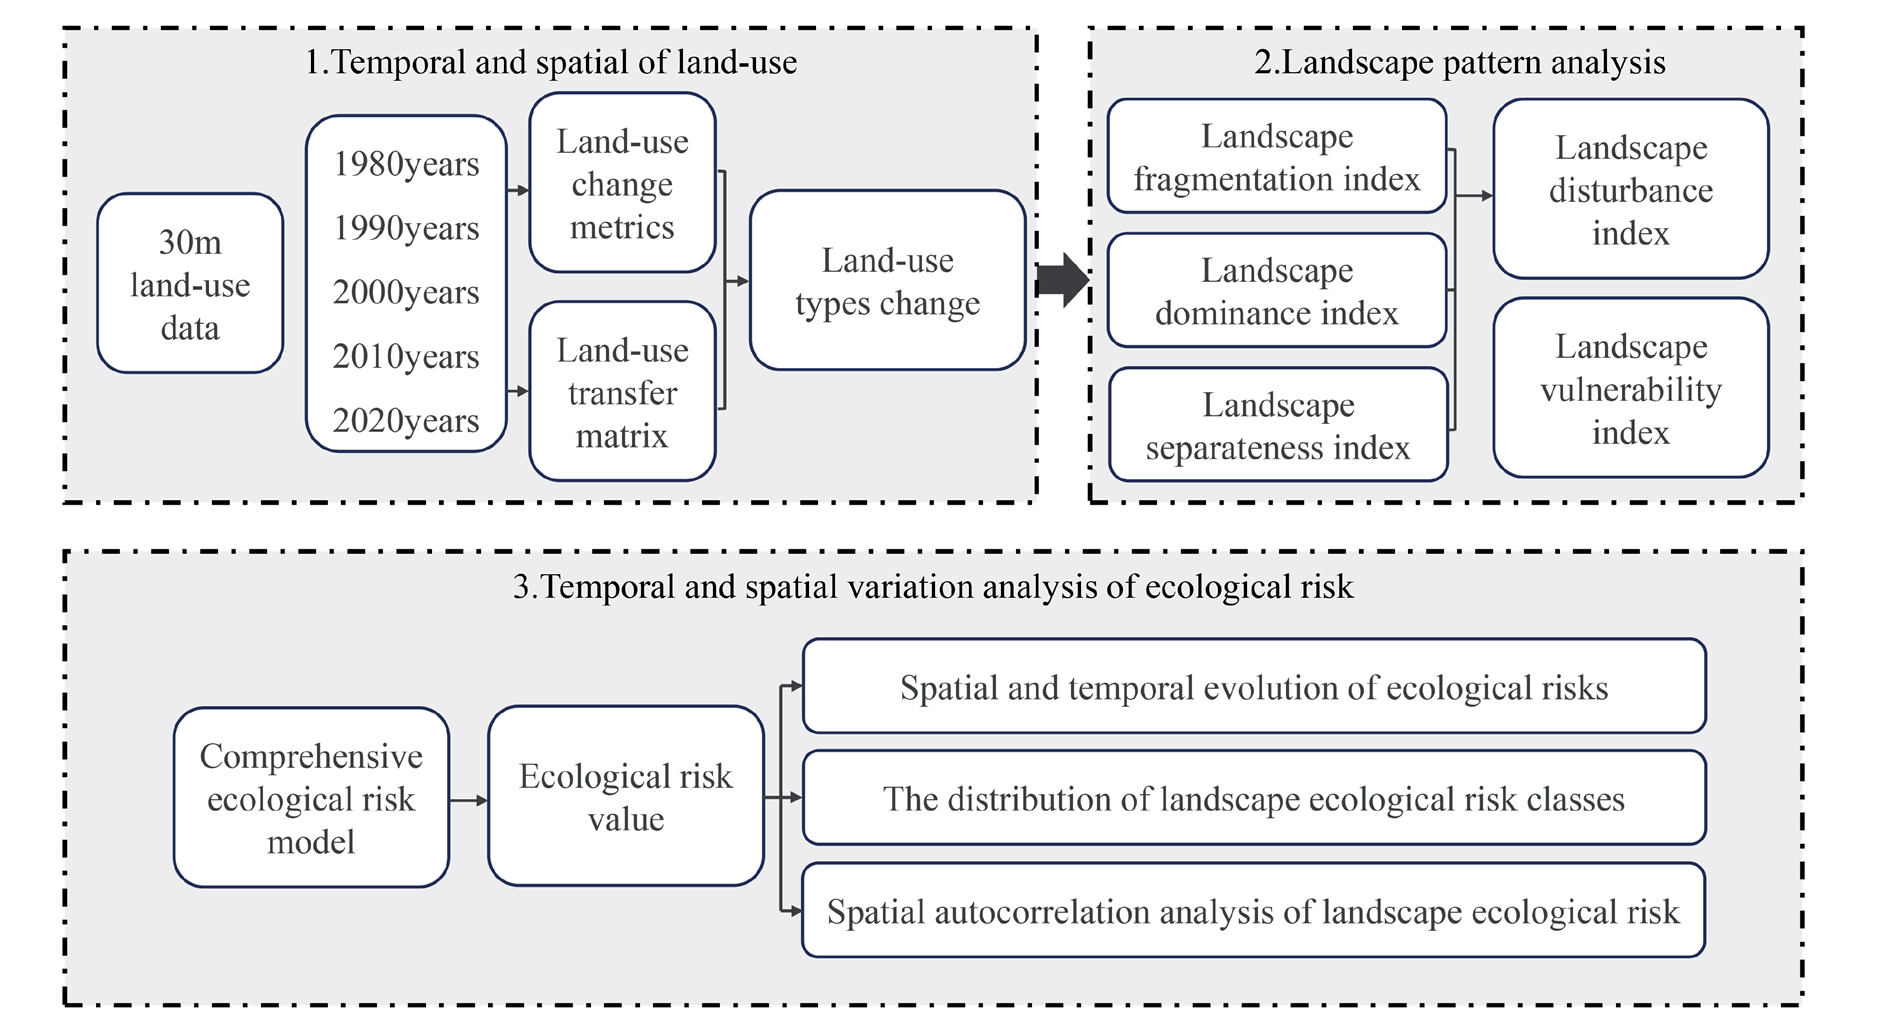
This study was founded upon the utilization of land-use vector data spanning from 1980 to 2020. In a strategic move to enhance the granularity and ecological relevance of the analysis, the land-use categories were reclassified into eight distinct types. This encompassed a refined segmentation of grassland into high, moderate, and low coverage subtypes, a categorization that was pivotal in capturing the nuanced ecological variations within the region. Subsequently, Hainan Prefecture’s land-use dynamics and transfer matrix were subjected to analysis. A systematic sampling method utilizing a 5×5 km grid was employed to compute landscape pattern indices, including landscape disturbance degree and fragmentation degree, to develop the landscape ecological risk index (ERI). The spatial association of ecological threats in Hainan Prefecture was examined. The primary technique utilized in this investigation is depicted in the flow chart (Fig. 1).
Study Area
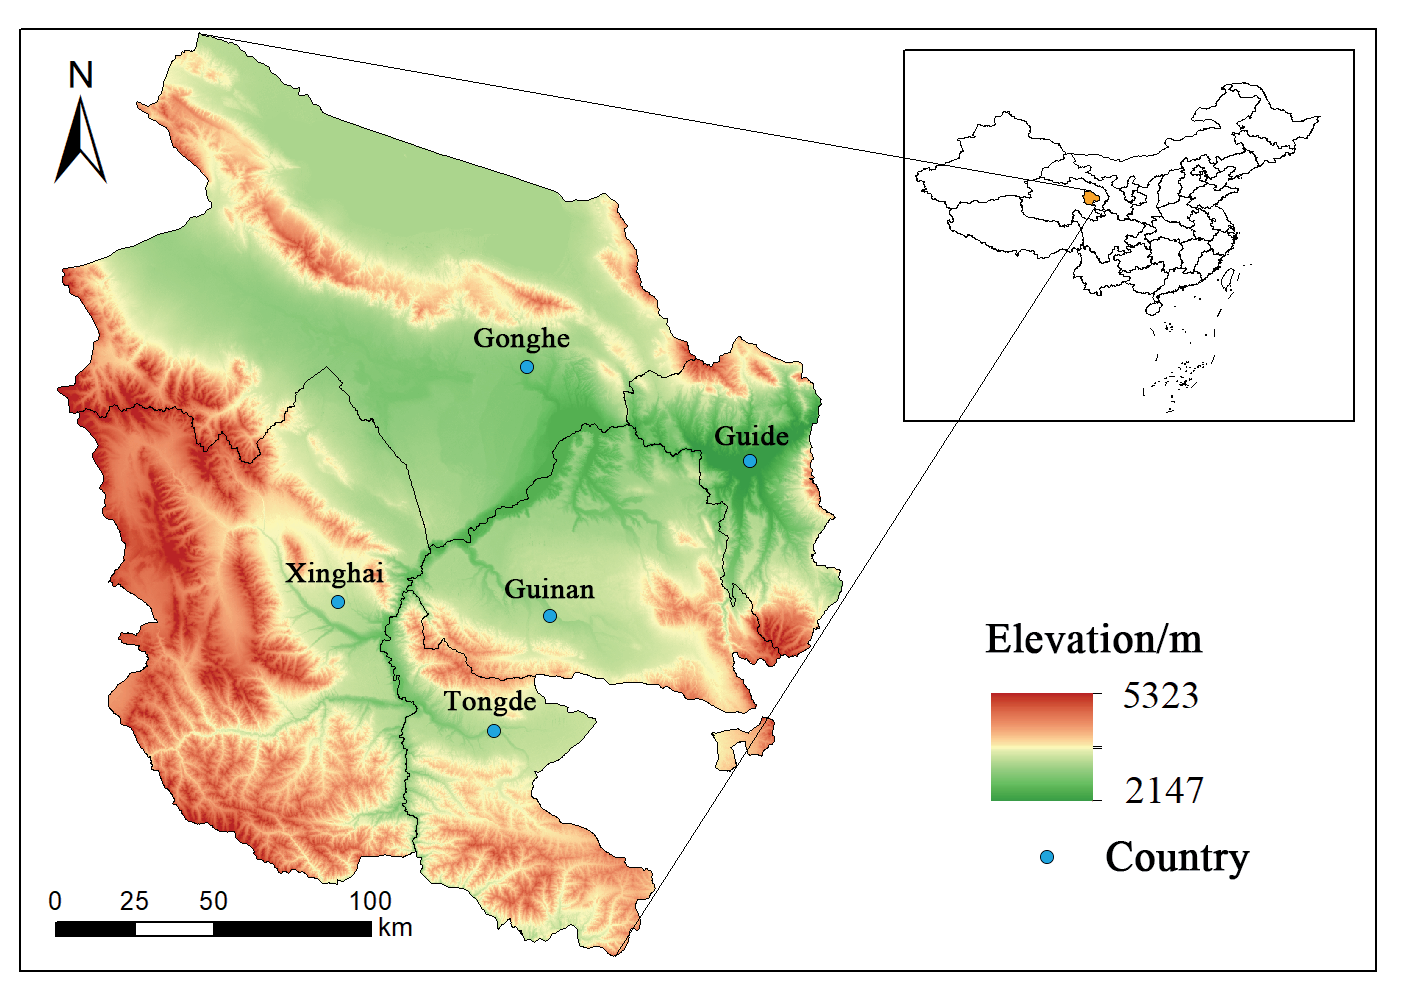
Hainan Prefecture (98°55’–105°50’E, 34°38’– 37°10’N) is located near the eastern entrance to the Qinghai-Tibetan Plateau [22], where the Yellow River meets the Huangshui River. Covering an area of roughly 45,600 Km2, the prefecture is bordered by Haidong City and Huangnan Prefecture to the east, Haixi Prefecture to the west, Guoluo Prefecture to the south, and Qinghai Lake and Haibei Prefecture to the north.
The prefecture is predominantly mountainous, with an altitude ranging from 2,147 to 5,323 m. It features basins in the middle and is interspersed with plateau hills and river valley terraces, exhibiting a complex and varied terrain [26].
Hainan Prefecture experiences a typical plateau continental climate and is situated in the mid-latitude region. The mean multi-year temperature is -1.12ºC, while the mean multi-year precipitation is 388 mm, with a brief and relatively cool summer and a protracted and arid winter. The region encompasses five counties: Gonghe, Guide, Tongde, Xinghai, and Guinan, with a total population of approximately 450,000, making it one of the most populated areas on the Tibetan Plateau. This region serves as a crucial economic and ecological hub, significantly contributing to the ecological security of the entire plateau [22] (Fig. 2).
Data Sources
This study utilized land-use vector data for Hainan Prefecture from 1990, 2000, 2010, and 2020, with a spatial resolution of 30 m, obtained from the Resource and Environment Science Data Centre of the Chinese Academy of Sciences (http://www.resdc. cn). The data exhibited an accuracy exceeding 90%, adequately fulfilling the research requirements [27]. The database classifies land-use types into six basic categories: cultivated land, forests, grassland, water area, construction land, and unutilized land, along with other minor categories. This study reorganized land-use types into eight primary types – cultivated land, forest, high / moderate / low coverage grassland, water area, construction land, and unutilized land – based on the latest Chinese standard Classification of Land-use Status Quo (GB/T21010-2017) and the actual conditions of Hainan Prefecture. The projected coordinate system has been standardized as Krasovsky_1940_Albers.
The data processing methods conformed to technical criteria, guaranteeing the accuracy and reliability of the analytical results [28]. This study sought to develop an appropriate landscape pattern index system, examine the spatial and temporal evolution characteristics of the landscape pattern and its ecological risk pattern in Hainan Prefecture, investigate the coupling relationship between the two, and offer a theoretical foundation for sustaining regional ecological security.
Research Methodology
Analysis of Land-use Change
The quantitative depiction of regional land-use change, which may show the extent of change in various landscape types at various spatial and temporal scales, depends heavily on measuring land-use dynamics [29]. To determine the features of regional land-use change, we compute the single land-use momentum degree of each land-use type in Hainan Prefecture throughout various time periods from 1980 to 2020. The following formula is used to determine the dynamic degree:
Where K is the degree of the dynamics of a particular land-use type during the study period, Ua and Ub are the areas of a particular land type at the beginning and the end of the study period, respectively, and T is the length of the study period in years; in this study, T = 41.
Characteristics of Land-Use Transfer
The land-use transfer matrix tracks the interconversion of regional land-use types over a specified duration. This facilitates the identification of transfer directions and area transformations for each category, thereby clarifying spatial patterns, evolutionary trends, and the mechanisms underlying land-use changes [30]. The formula for the land-use transfer matrix is as follows:
Sij represents the quantity of land-use type i at the commencement of the study and the quantity of land-use type j at its conclusion, where i and j are the Hainan land-use types at the study’s outset and conclusion, respectively. N signifies the total number of land-use types, which is 8 in this study.
Landscape Ecological Risk Index
A grid encompassing all research regions was utilized for systematic sampling to spatialize the landscape ecological risk index. Studies in landscape ecology indicate that risk cells should be 2-5 times the average patch size to effectively capture landscape pattern information surrounding sampling locations. Areas larger than 0.5 km2 are treated as a separate sample area, and areas smaller than 0.5 km2 are merged into neighboring sample areas [31]. Therefore, based on the average size of landscape patches, the risk units in Hainan Prefecture were divided into a sampling grid of 5×5 km, and the sampling method was an equally spaced systematic sampling method, resulting in a total of 1,905 units used as samples for ecological risk assessment. The landscape index was computed utilizing Fragstats 4.2 software, and the landscape pattern value for each risk cell was derived as the ecological risk value at the cell’s central location. Building upon previous research [15, 32], this study empirically connects land-use patterns to ecological risk by devising metrics. The landscape disturbance degree captures human impacts, while fragmentation and separation degrees analyze landscape integrity, which is crucial for risk spread. Dominance degree assesses landscape influence, and fragility degree reflects land use stability. These metrics, refined by regional studies and prior knowledge, construct the ERI for quantifying cell risk. It maps risk in space and time, highlights trends and differences, and identifies high-risk zones near human activities to reveal clustering and spillover, enabling targeted strategies. It guides restoration, land use, and resource allocation, enhancing ecological security and management precision in sustainable growth, and serves as a vital decision-making tool. Finally, a spatial distribution map of ecological risk in Hainan Prefecture was created using ArcGIS software in conjunction with ordinary kriging interpolation.
The formula for calculating the landscape ecological risk index (ERI) is as follows:
where ERIk denotes the ecological risk index of the k-th risk plot; Aki represents the area of the i-th landscape type inside the k-th risk plot; Ak signifies the overall area of the k-th risk plot; and Ri indicates the loss degree index of the i-th landscape type.
Table 1.
Landscape pattern index formulas and ecological significance.
Spatial Autocorrelation Analysis
Exploratory spatial data analysis (ESDA) is a technique for assessing the correlation properties of spatial data attribute values, generally known as spatial autocorrelation. Metrics for measuring spatial autocorrelation include global and local metrics [40]. This study performed spatial autocorrelation analysis of landscape ecological risk using ArcGIS 10.6 and GeoDa 1.6.7 platforms. Global autocorrelation is analyzed by the Moran’s I index, which is characterized by a Moran’s scatter plot. The calculation formula for Moran’s I index is as follows:
The analysis of local autocorrelation was conducted utilizing the Local Moran’s I index to define the spatial aggregation or disaggregation of the variables [39, 41]. The demonstration involved LISA clustering diagrams, which illustrated four distinct types of clustering: high-high (H-H), low-high (L-H), low-low (L-L), and high-low (H-L). These underwent Z-tests (P<0.05). The calculation formula is outlined below:
The parameter values in Eqs. (4), (5), and (6), respectively, are: n, which denotes the total number of grid cells; xi(xj), which denotes the measured value of grid cell i(j); (xi-x̄ ), which denotes the deviation of the measured value from the mean in the i-th grid cell; and wij, which denotes the normalized spatial weight matrix, and S2 denotes the variance.
Results and Discussion
Land-Use Change and Landscape Characteristics
Changes in Land-use Structure
The land-use pattern of Hainan Prefecture is characterized by a mosaic distribution of natural and semi-natural landscape types, including grassland, forests, and cultivated land, as well as artificial landscape types, such as construction land. An analysis of land cover statistics from 1980 to 2020 (Fig. 3) indicates that grassland is the predominant land-use type, comprising almost 62% of the total area, with moderate/low coverage grassland being the prevalent landscape type. The subsequent predominant land-use type is unutilized land, comprising over 12% of the area, predominantly in the western and southern regions of Gonghe County, the central region of Guinan County, and the western area of Xinghai County. High-coverage grassland accounts for approximately 9.6% of the total area, concentrated in the southern part of Qinghai Lake and Hainan Prefecture at high altitudes. About 4.5% of the region is cultivated land, mostly in the Yellow River basin and its tributaries, the Mangla and Shazhuyu rivers.
In Hainan Prefecture, the total area of each land-use type from large to small is moderate coverage grassland > unutilized land > forests > high coverage grassland > cultivated land > water area > low coverage grassland > construction land (Table 2). From 1980 to 2020, the area change trends of various land-use types in Hainan Prefecture differed. Among them, the cultivated land area increased continuously from 1,636.09 km2 to 2,048.52 km2, with a net increase of 412.43 km2. The water area and construction land area increased continuously. The forest area first saw a minor rise followed by a reduction. The high-coverage grassland area increased. The low-coverage grassland area decreased first and then increased. The moderate-coverage grassland area decreased continuously. The unutilized land area decreased continuously from 7899.30 km2 to 5403.52 km2.
Generally, Hainan Prefecture’s land-use pattern was relatively stable from 1980 to 2020 with a gentle degree of change. Type-wise, cultivated land, high/low coverage grassland, water area, and construction land all rose, with construction land growing the most, while unutilized land and moderate coverage grassland areas fell the most.
Land-use Transfer Matrix
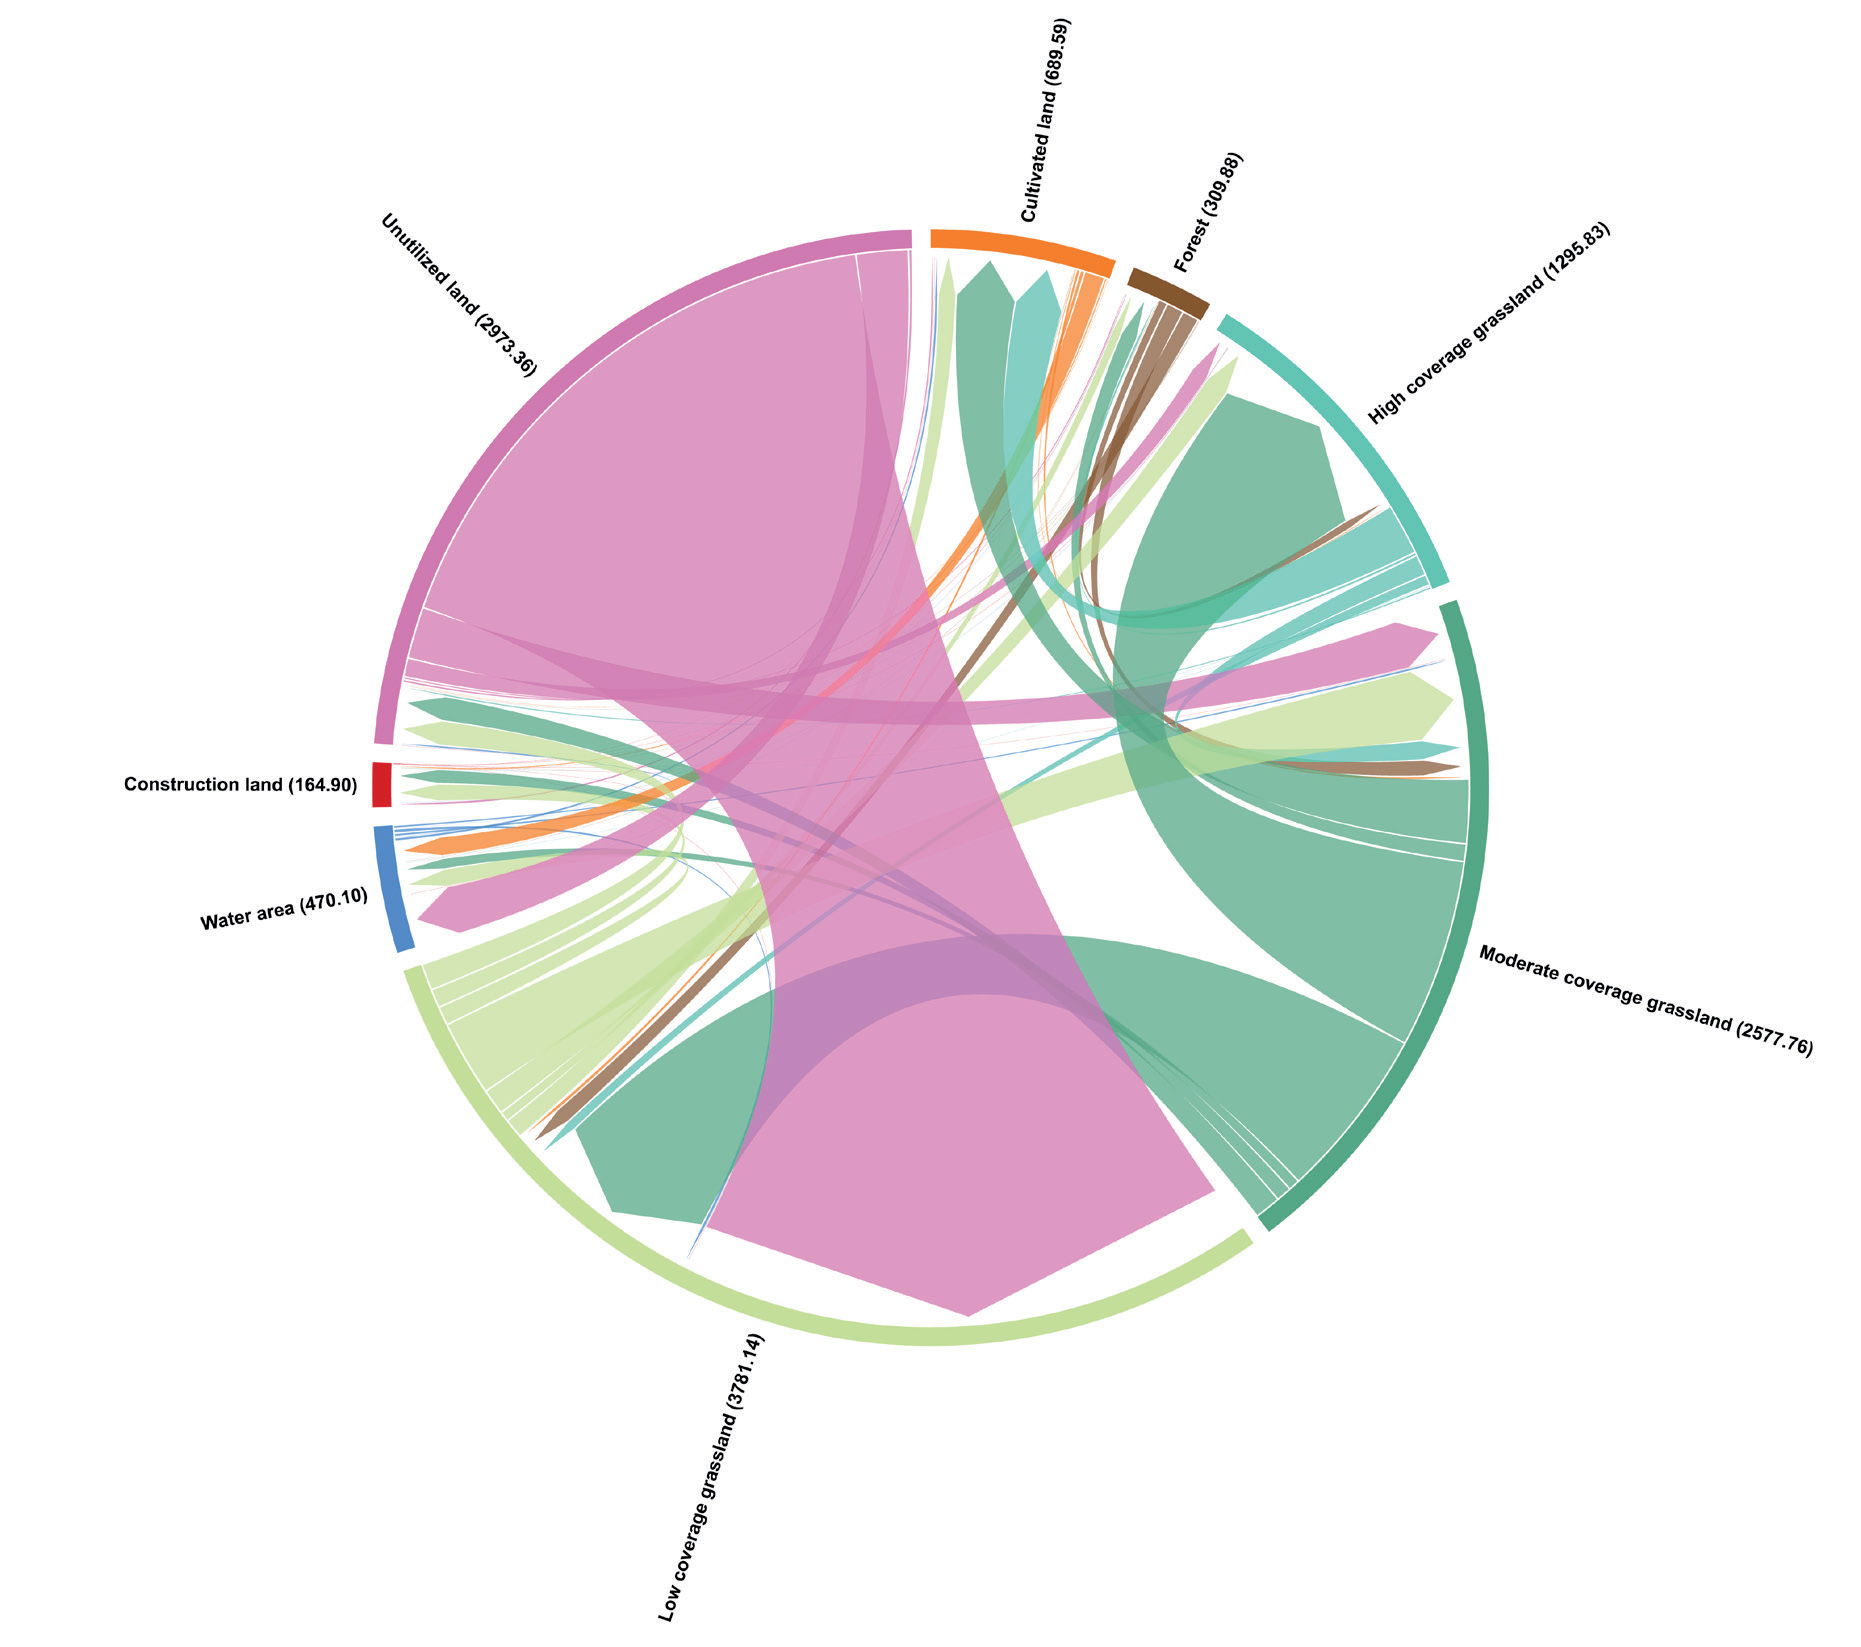
From 1980 to 2020, a total of 7,564.1 km2 of land in Hainan Prefecture underwent changes in land-use types. (Table 3, Fig. 4) Compared with the earlier period, the transfer of land-use types was more pronounced from 2000 to 2020. Unutilized land noticed the most significant loss, totaling 2,495.78 km2, representing 32.99% of the overall area impacted by the change in land-use patterns. Unutilized land was predominantly transformed into low-coverage grassland, encompassing 2,225.16 km2, and partially into water area measuring 200.52 km2, moderate-coverage grassland covering 199.59 km2, high-coverage grassland spanning 72.01 km2, and construction land totaling 14.01 km2. The most significant change in land-use area was the expansion of building land from 78.93 km2 to 232.19 km2, resulting in a net increase of 153.26 km², which is 20.26% of the total area of transformed land. Subsequently, there was an expansion in the amount of low-coverage grassland, measuring 2,274.62 km2, with increases in cultivated land, high-coverage grassland, and water bodies. The extent of moderately covered grassland and forested regions diminished. Between 1980 and 2020, the extent of moderate-coverage grassland diminished markedly from 14,857.16 km2 to 13,614.15 km2, representing a reduction of 1,243.01 km2. Similarly, forest land contracted from 3,389.03 km2 to 3,345.77 km2, a decrease of 43.26 km2, whereas other land-use types, excluding unutilized land, exhibited varying degrees of expansion.
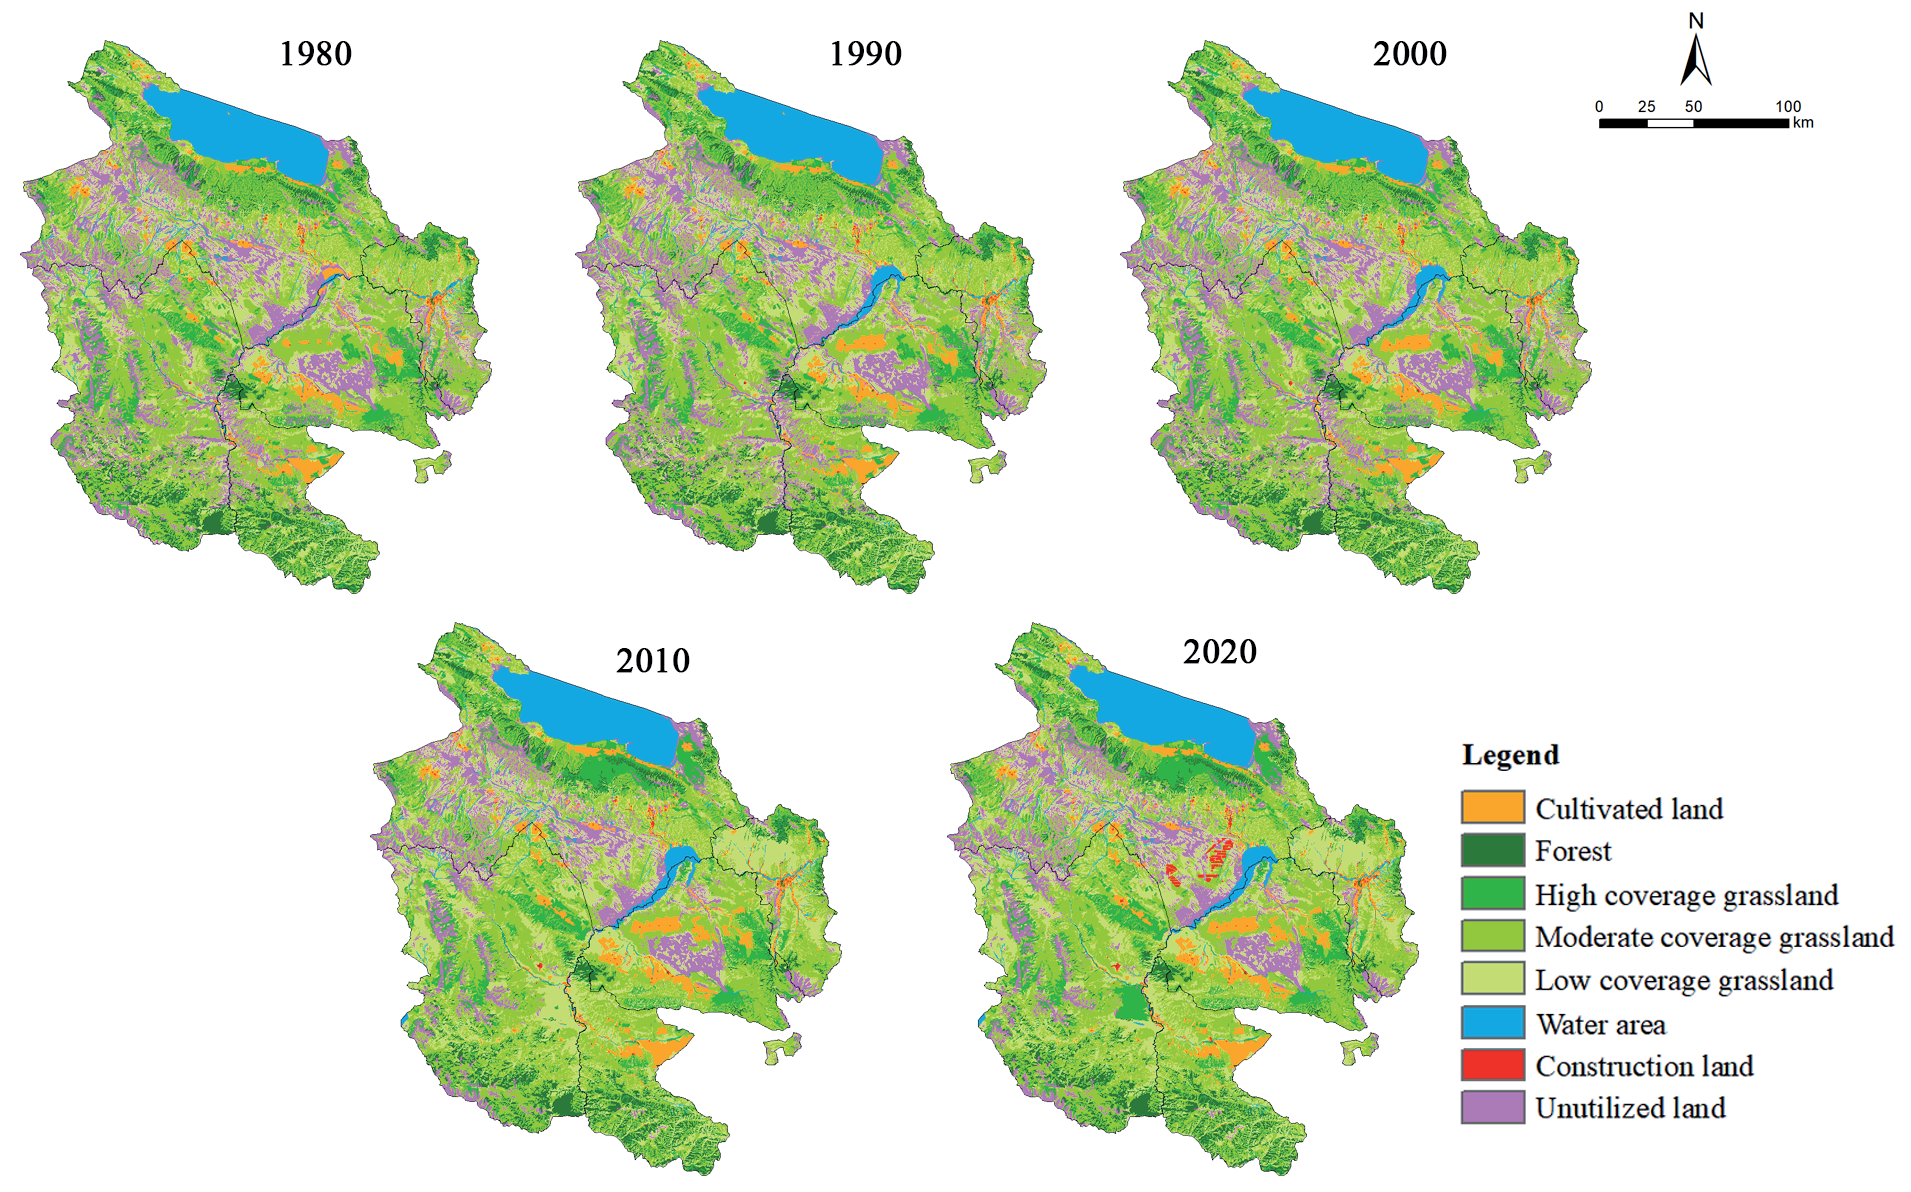
Table 2.
Statistics of land-use types in Hainan from 1980 to 2020 (unit: km2).
From the time series perspective, land-use change in Hainan Prefecture exhibits distinct stage characteristics. Prior to 2000, the land-use structure exhibited minimal variability with a relatively narrow range of change. In contrast, following 2000, the transfer activity between land-use types was significantly more pronounced, accompanied by a notable intensification in land-use change.
Landscape Pattern
Utilizing the data from 1980 to 2020 in Table 4, Fragstats 4.2 software was employed to compute the landscape pattern indices for various land-use types annually and to examine the long-term change patterns as follows:
From 1980 to 2020, the number of patches exhibited an increase in most land types, particularly cultivated land, high-coverage grassland, and water area. The trend for low-coverage grassland, construction land, and unutilized land shows an initial decrease followed by a significant increase.
Table 3.
Matrix of land-use type change in Hainan from 1980 to 2020 (unit: km²).
Except for moderate-coverage grassland, the fragmentation and segregation indices of all other land types demonstrated a consistent rising trend over the past four decades, signifying a more fragmented and segregated landscape structure. Forests, low-coverage grasslands, water areas, and unutilized land showed the most significant increases in fragmentation and segregation indices. Conversely, despite an increase in the number of patches, the fragmentation and segregation indices for construction land demonstrated a decrease owing to the fast expansion of the region.
The dominance indices for the two dominant landscape types, cultivated land and high-coverage grassland, exhibited an increasing trend throughout the period. In contrast, the dominance indices of other types exhibited less fluctuation. The disturbance index of forest, grassland, and unutilized land remained at a high level with a gradual upward trend, indicating increasing disturbance of these feature types. In contrast, the disturbance index for construction land has decreased.
A comparison of the loss degree index reveals that the loss for unutilized land is the highest and continues to rise, primarily due to increased fragmentation, segregation, and disturbance, leading to higher vulnerability than other land types. The loss degree of constructed land has decreased in recent years due to intensive development and improved disturbance resistance.
In summary, the long-term development process from 1980 to 2020 has resulted in unfavorable fragmentation, segregation, and increased disturbance changes in the landscape pattern of most natural land-use types. In contrast, construction land has progressively transitioned towards intensification and stabilization. Unutilized land remains at a high value in terms of the landscape loss degree.
Table 4.
Landscape pattern indices of different land-use types.
Analysis of Spatial and Temporal Changes in Ecological Risks
Spatial and Temporal Evolution of Ecological Risks
The value range of the landscape ecological risk index (ERI) in Hainan Prefecture is 0.001 - 0.191. From 1980 to 2020, the comprehensive Landscape Ecological Risk Index (ERI) in Hainan Prefecture exhibited a relatively stable value of approximately 0.124 across five periods. To intuitively illustrate the spatial pattern characteristics of landscape ecological risk in Hainan Prefecture across various periods, the landscape ecological risk levels are categorized into five levels: low risk (ERI≤0.095), low-medium ecological risk (0.095<ERI≤0.124), medium ecological risk (0.124<ERI≤0.153), medium-high risk (0.153<ERI≤0.182), and high risk (ERI>0.182).
From 1980 to 2020, the landscape ecological risk in Hainan Prefecture was mainly low-medium risk and medium risk (Table 5), accounting for 23.9% and 43% of the total area of Hainan Prefecture, respectively; the proportions of low, medium-high, and high risks in the total area of Hainan Prefecture were relatively small, being 7.8%, 17.7%, and 7.7%, respectively. The changes in landscape ecological risk levels in Hainan Prefecture from 1980 to 2020 exhibited variability. Regions with low and low-medium risks diminished from 1980 to 2010 and subsequently grew post-2010. The share of the medium-risk area had an increasing trend prior to 2010 and a decreasing trend subsequent to 2010. The region of medium-high risk has generally diminished. The high-risk region remained steady at around 3342.74 km2.
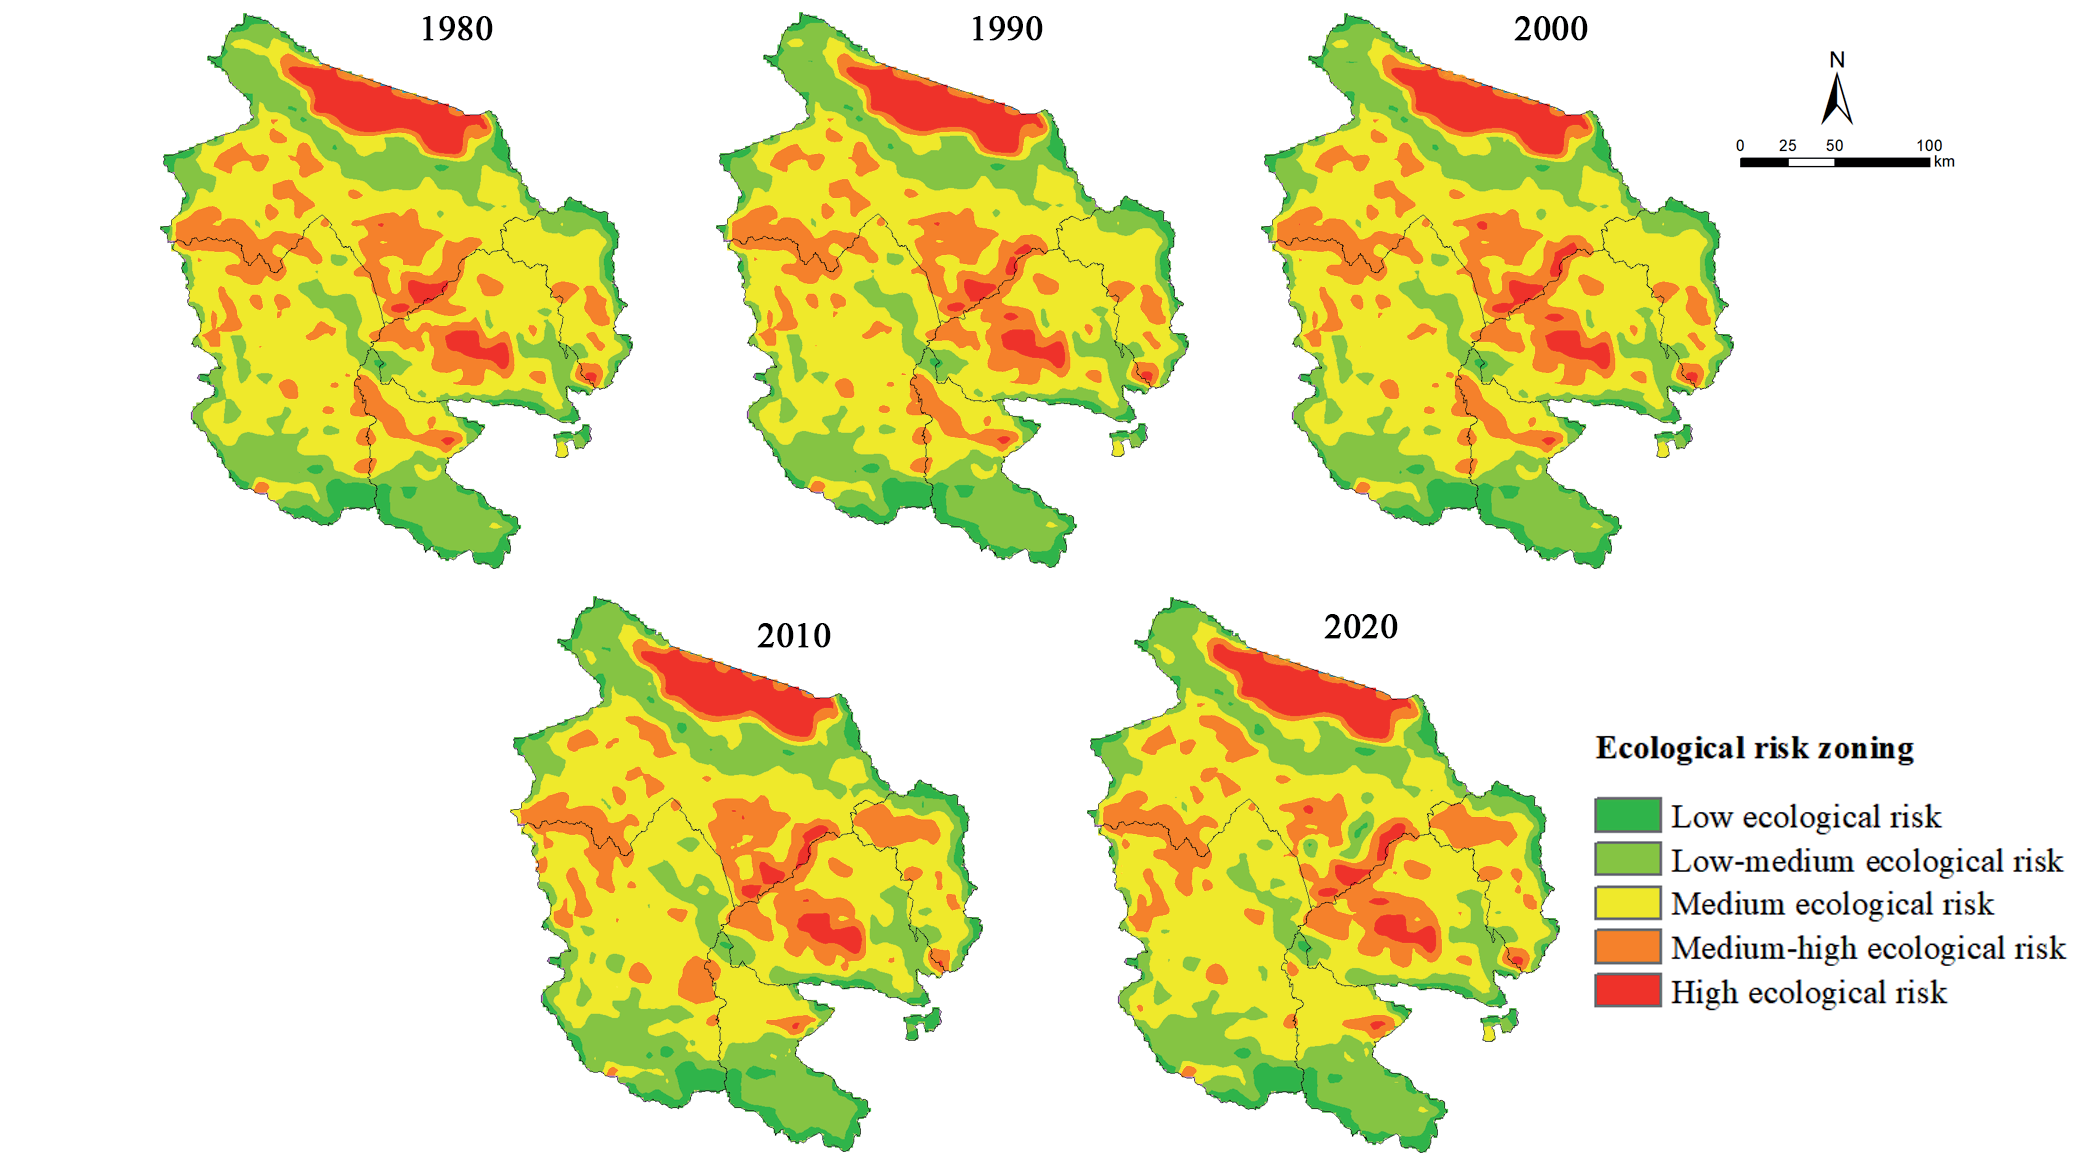
Spatial variation in the landscape ecological risk of Hainan Prefecture is evident (Fig. 5). Areas with significant ecological risk are mostly located in the Qinghai Lake region, the southeastern section of Gonghe County, the central portion of Guinan County, and the urban zones of Tongde County. In 2000, the high ecological risk region in the Longyangxia Reservoir grew, and in 2010, the high ecological risk area in the Mangla River valley in Guinan County also saw substantial growth. Areas with medium-high ecological risk are mostly located in the southwestern and southern regions of Gonghe County, as well as the central portion of Guinan County, with sporadic occurrences in the Yellow River basin.
Medium ecological risk zones are mostly located in most Xinghai County and Guide County regions, with additional presence around medium-high risk areas, illustrating the spatial transition features of landscape ecological risk levels. The distribution pattern is highly concentrated and mutually mosaic, with low-medium and low ecological risk regions concentrated in the southern part of Xinghai County, the northern part of Gonghe County, and the southern part of Tongde County.
The landscape ecological risk in Hainan Prefecture exhibits substantial spatial heterogeneity and variability. Areas of high ecological risk are predominantly located in metropolitan regions and river and lake valley belts heavily influenced by human activity, whereas regions with more intact biological settings have a lower risk level.
Ecological Risk Land Class Distribution
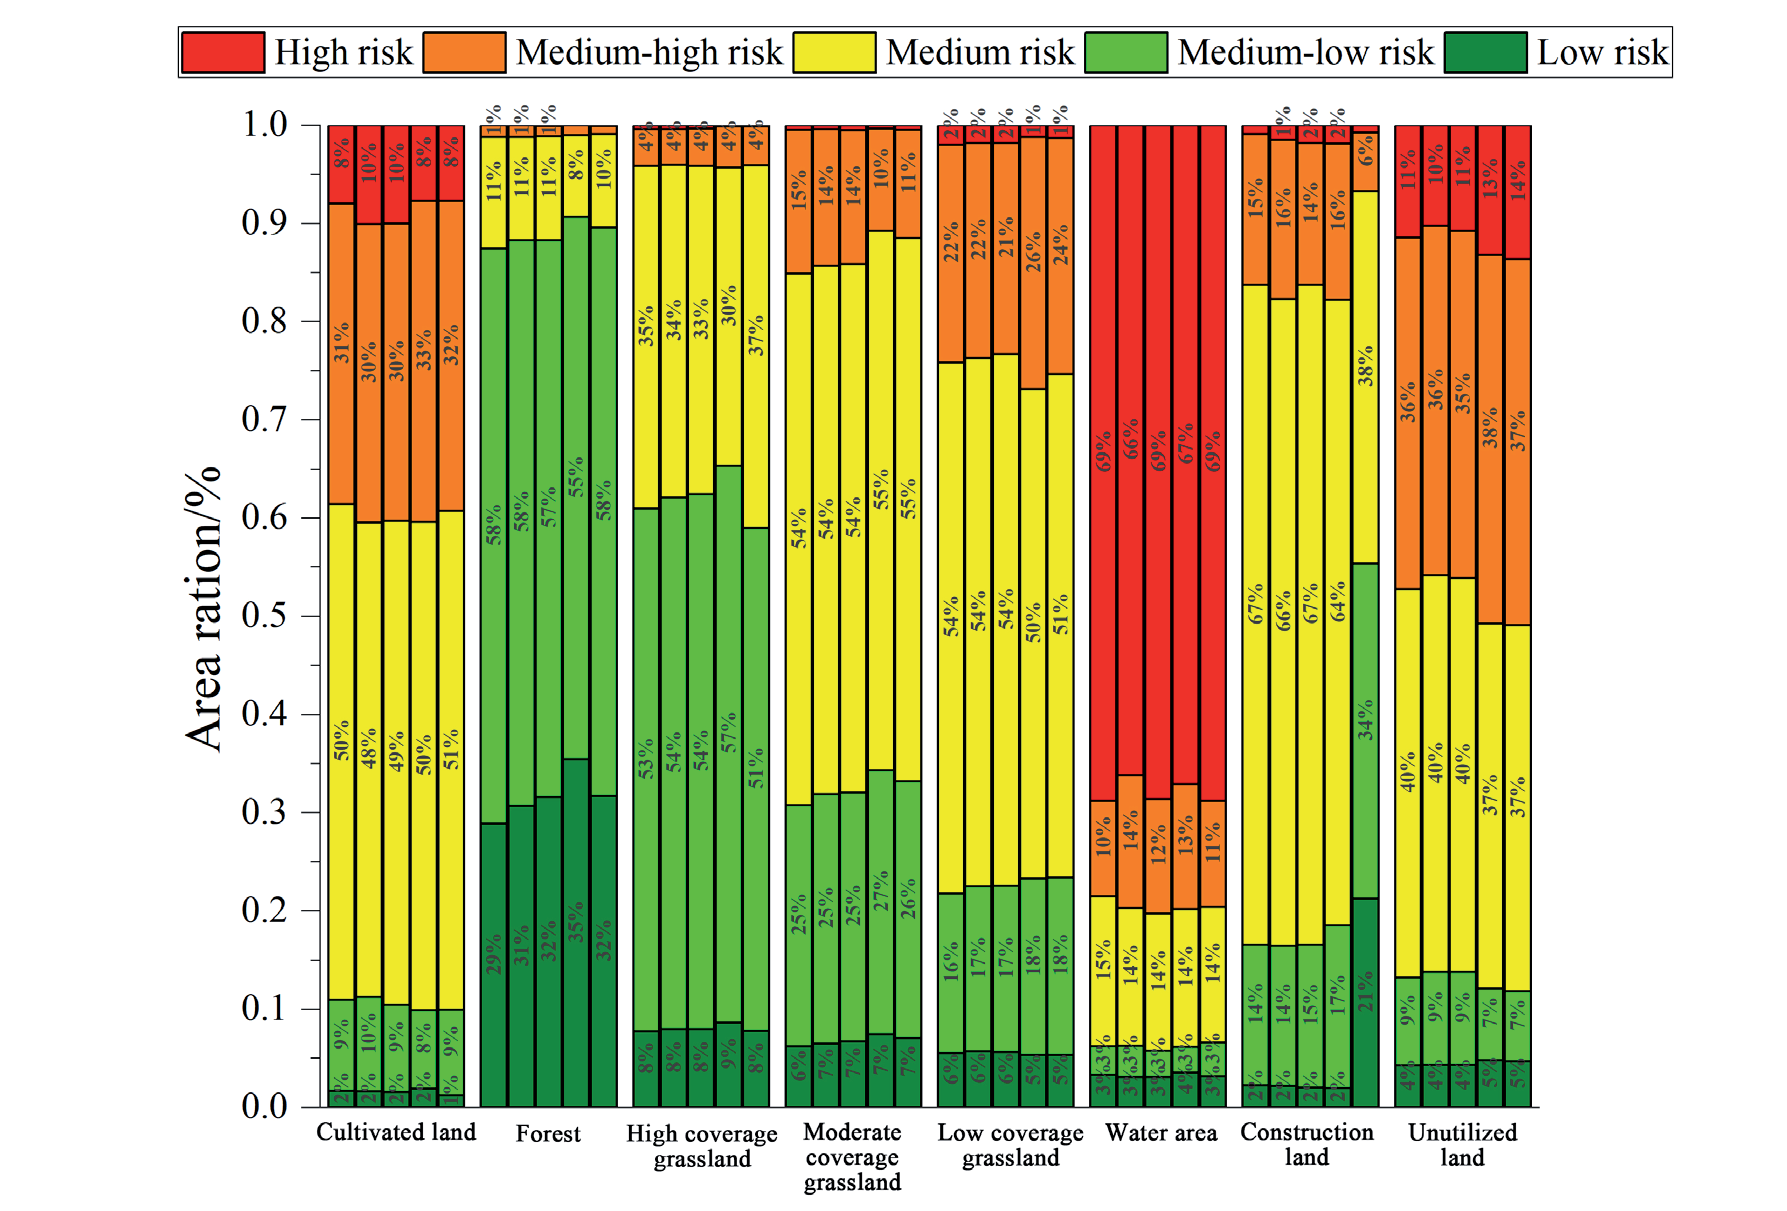
The results indicate (Fig. 6) that from 1980 to 2020, cultivated land in Hainan Prefecture was primarily distributed in the medium and medium-high ecological risk zones, accounting for approximately 66% of its total area. Conversely, forest cover was relatively concentrated in the low and medium-low ecological risk zones. As the coverage of grassland vegetation diminished, the prevalence of high, medium, and low coverage grasslands in low and medium ecological risk zones fell, but in medium and high ecological risk zones, it grew. This illustrates the incremental traits of the ecological risk levels associated with various grassland kinds, which most profoundly influence Hainan Prefecture’s landscape ecological security framework.
Table 5.
Area and proportion of landscape ecological risk levels in Hainan from 1980 to 2020.
The significant vulnerability of water areas to physical alterations resulting from ecological degradation and external disturbances is evident, with approximately 68% of the total water area situated in regions of high ecological risk. From 1980 to 2010, the majority of construction land was situated in the medium ecological risk zone, comprising approximately 66% of the total area. However, by 2020, its distribution in low and medium-low ecological risk zones had increased significantly, accounting for 21% and 34%, respectively, while the share of medium-risk zones had decreased to 38%. The ecological risk associated with construction land has diminished in recent years.
The majority of unutilized land is concentrated in areas of medium and medium-high ecological risk. These areas are typically characterized by small, independent, and dispersed patches of land with an unstable internal structure and fluctuating ecological risks.
The distribution patterns of different land-use types in terms of landscape ecological risk levels exhibit notable differences, reflecting their respective ecological risks. Among these, the moderate and low-coverage grasslands exert the greatest influence on Hainan Prefecture’s overall ecological security pattern.
Spatial Autocorrelation Analysis of Landscape Ecological Risk
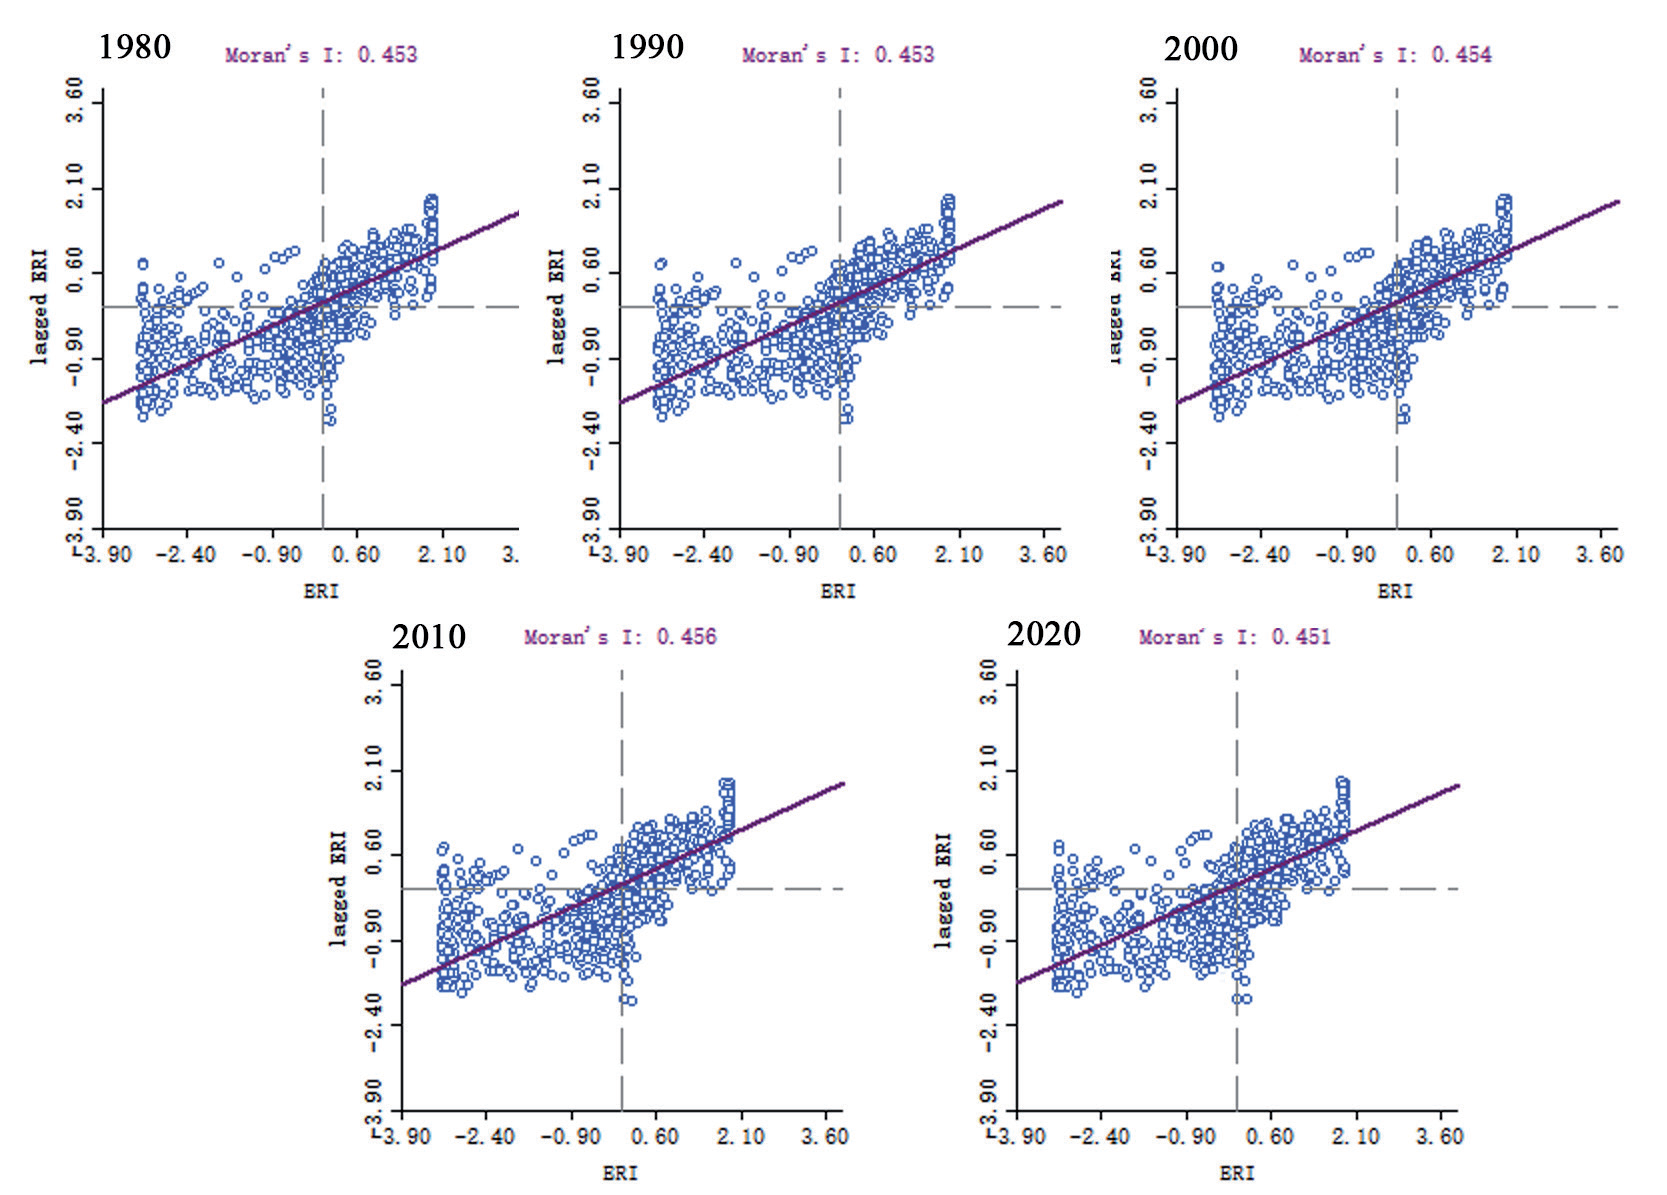
The global Moran’s I index test results, depicted in Fig. 7, show that the global Moran’s I values for landscape ecological risk in Hainan Prefecture from 1980 to 2020 ranged from 0.451 to 0.456 (P<0.05). These exhibited a significant positive correlation in spatial distribution and demonstrated characteristics of aggregated distribution. The time series indicates a gradual upward trend, implying an increase in the spatial autocorrelation of landscape ecological risk, a weakening spatial heterogeneity among various landscape types, and a rising overall trend of convergence.
Further analysis of the Moran scatter plot reveals that the scatter points in different periods are distributed in close proximity to the regression straight line, indicating pronounced characteristics of homogeneity and heterogeneity. The majority of the scatter plots fall within the first and third quadrants, indicating that landscape ecological risks are gradually increasing in “high-high” or “low-low” clustering. This implies that both high-risk and low-risk areas are becoming more concentrated spatially.
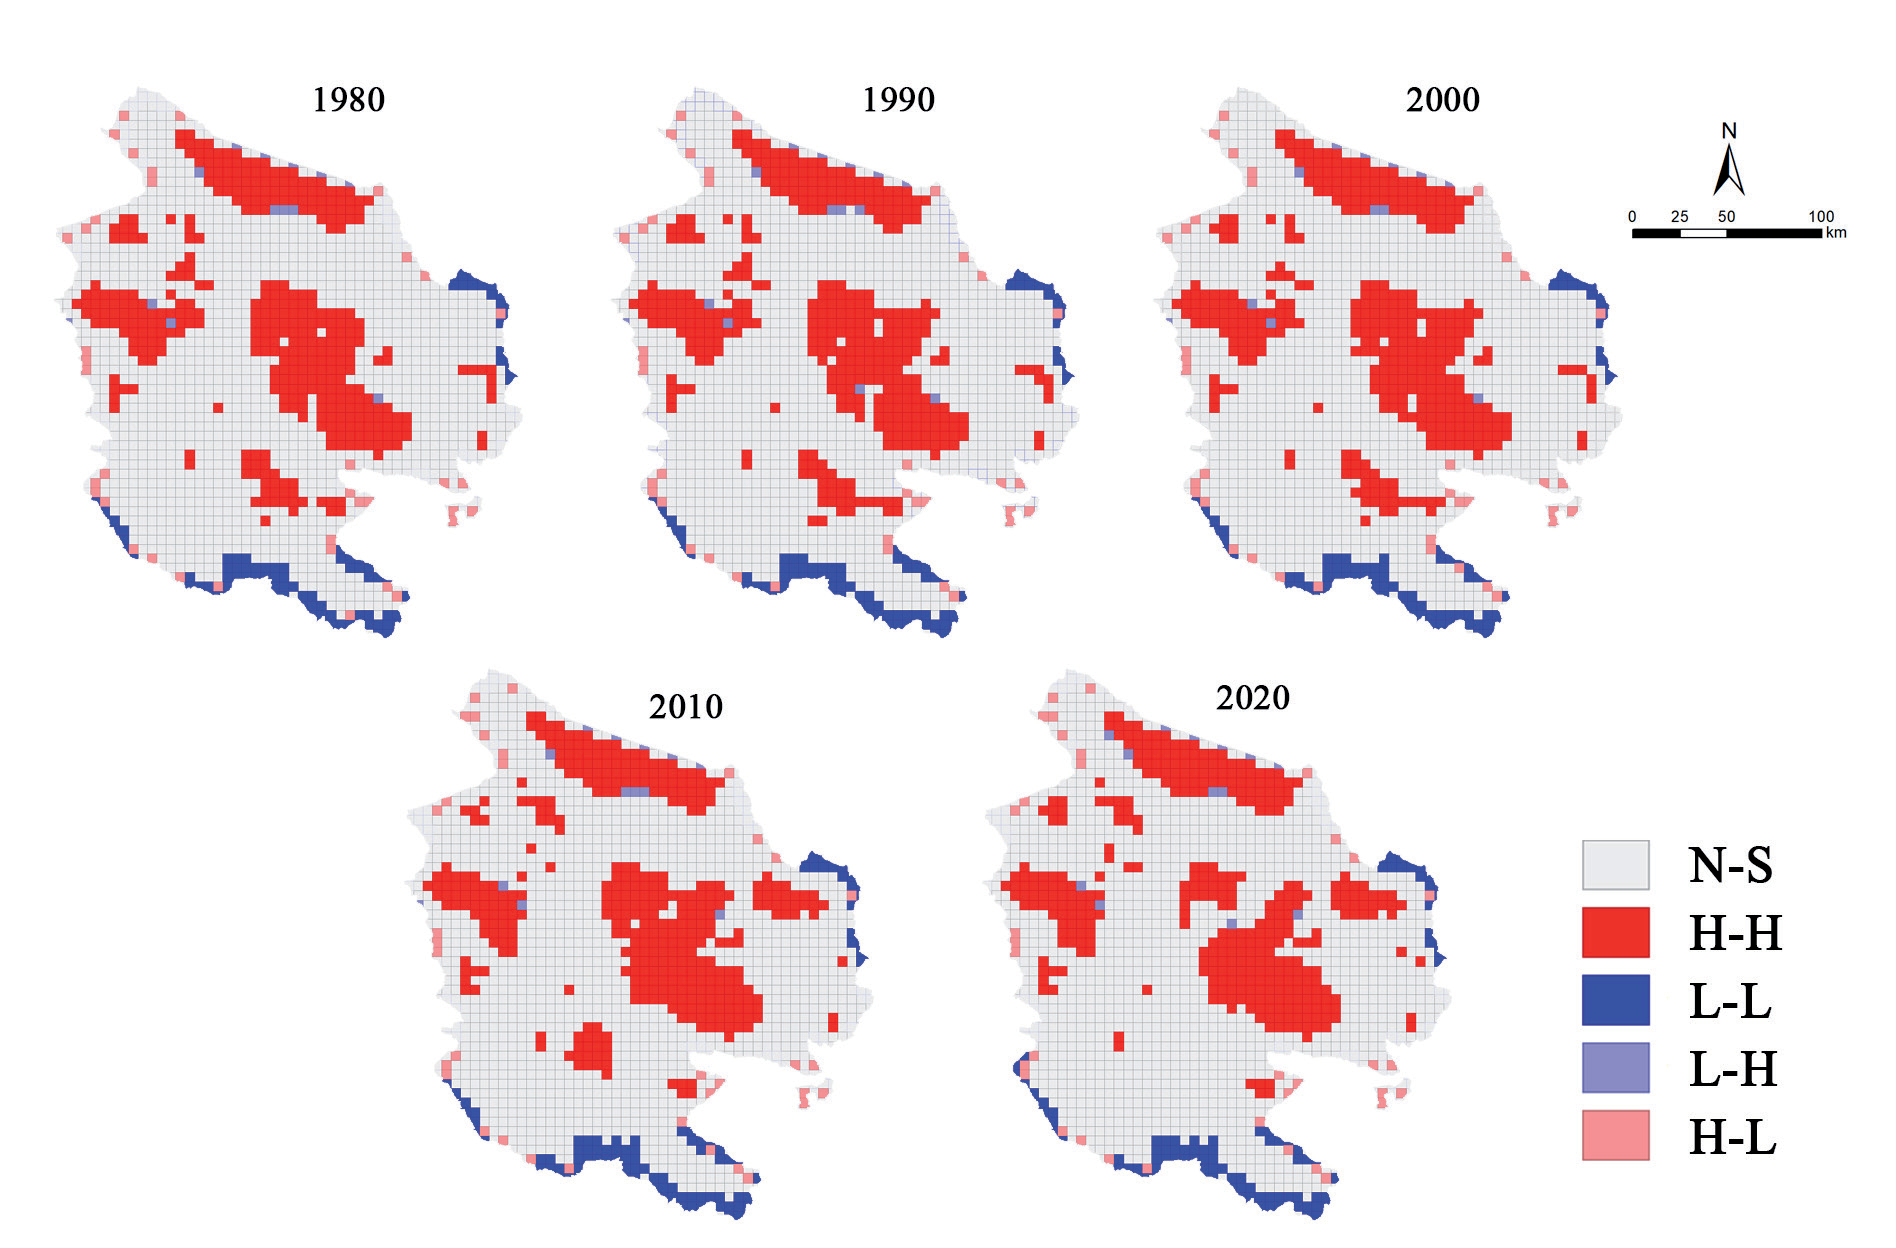
The local spatial autocorrelation analysis (Fig. 8) reveals that the LISA clustering map predominantly exhibits “low-low” (L-L) and “high-high” (H-H) clustering patterns in the landscape ecological risk of Hainan Prefecture, while “low-high” (L-H) and “high-low” (H-L) clustering occurrences are comparatively infrequent. Over time, the spatial influence of “L-L” and “H-H” clustering intensified, whilst regions exhibiting random distribution without discernible clustering trends diminished.
The “L-L” aggregation area is concentrated in Tongde County, southern Xinghai County, and northeastern Guide County, highly overlapping with the low ecological risk area. The “H-H” aggregation area was initially concentrated in the Qinghai Lake area, Longyangxia Reservoir, the valley of the Mangla River, and the northern part of Xinghai County. Over time, it gradually expanded outward, significantly expanding within the Yellow River basin in Guide County by 2010. Its spatial distribution is highly consistent with the distribution pattern of medium-high and high ecological risk areas.
The landscape ecological risk of Hainan Prefecture exhibits pronounced regional differentiation and group clustering characteristics in the spatial pattern. The high-risk and low-risk zones tend towards concentrated distribution, while the medium-risk zones gradually converge and form transition zones, leading to a decrease in heterogeneity within the region and an increase in homogenization.
Discussion
Spatial Characteristics and Functional Patterns of Land Resources
The land-use pattern of the Hainan Prefecture presents a mosaic distribution of alpine meadow grassland, alpine scrub forests, plateau river valley lakes, and other characteristic landscape types. Among these, the grassland system, representing the dominant vegetation ecosystem, occupies over 62% of the area and provides the foundation for the regional vegetation ecosystem. Grassland resources play a pivotal and irreplaceable role in ecological service functions such as wind and sand stabilization [42], water preservation [43], carbon storage [44], and oxygen production [45]. Chen et al.’s comprehensive assessment of grassland ecological functions [23] has fully confirmed the importance of grassland in maintaining regional ecological balance, providing indispensable strategic support for optimizing the agricultural and animal husbandry production structure. Its rational development and utilization are effective ways to address the challenges of agricultural transformation.
Cultivated land is intermittently distributed in river valleys and low-altitude mountainous areas where irrigation and water conservancy facilities are relatively well-developed, such as the Yellow River and the Mangla River, among others. The cultivated land area continued to expand from 1980 to 2010 but began to exhibit a declining trend after 2010. The number of patches increased, accompanied by an increase in the degree of fragmentation. The distribution pattern of cultivated land is subject to dual constraints: the natural conditions of the arid climate [46], the lack of irrigation facilities, and the limited reclaimable reserve resources in the highland region [47]. These constraints are compounded by the dual pressures of economic and social development, which are gradually replacing cultivated land with land for construction. Liu et al.’s in-depth analysis of the driving factors of cultivated land change [27] has revealed a close negative correlation between the available water resources and the expansion potential of cultivated land in arid and semi-arid regions, strongly supporting the assertion in this study about the influence of natural and human factors on the cultivated land pattern.
The spatial distribution of construction land demonstrates a trend of expansion toward the periphery along the river valley. From 2010 to 2020, construction land expanded by 143.47 km2, primarily in areas previously covered by moderate- and low-coverage grassland. The proliferation of construction land results in the loss and fragmentation of grassland habitats and the destruction of ecological services [48]. As urbanization, economic development, and city population concentration have increased, Hainan Prefecture has intensified efforts to construct roads, railways, airports, and other transport infrastructure [49]. Furthermore, Hainan Prefecture’s location at the southern end of Qinghai Lake provides a wealth of tourism resources, leading to a rapid expansion of tourism-related facilities and supporting infrastructure in recent years [50]. However, excessive construction expansion has worsened the problems of soil erosion and vegetation destruction. As shown in the case described by He et al., the disorderly expansion of construction land in a similar region has significantly increased the soil erosion modulus, causing a severe impact on the ecological environment [51]. Therefore, in the process of urban development, it is urgent to set ecological red lines and strictly control the construction expansion in the Yellow River Basin, Qinghai Lake Basin, and other ecologically sensitive areas.
As a significant ecosystem type in Hainan Prefecture, forest resources have undergone relatively consistent change, with the majority concentrated in the high-altitude mountainous regions of northern Gonghe County, southern Xinghai County, and southern Tongde County. Some forest resources have been transformed into grassland to stabilize the forest ecosystem, so it is necessary to strengthen forest protection and afforestation work and scientifically integrate newly generated grassland resources into the ecological protection and construction system. The long-term monitoring study carried out by Heino et al. clearly shows that continuous and effective forest protection strategies can significantly increase the forest coverage rate and enhance the stability of the ecosystem [52], providing a solid practical basis and scientific guidance for the management of local forest resources.
The spatial distribution indicates that unutilized land is predominantly located in Gonghe County, central Guinan County, and southern Xinghai County. Over the past 40 years, through measures such as artificial afforestation and comprehensive land management, 2,281 km2 of unutilized land has been transformed into grassland. Over the past 40 years, 2,281 km2 of unutilized land has been transformed into grassland, showing a continuous decline in area, but it still occupies a certain proportion by 2020, indicating that its reasonable planning and management cannot be ignored. On the one hand, its existence reflects the potential for land development. On the other hand, it has an unstable internal structure and fluctuating ecological risks, typically with small, independent, and dispersed land patches. Therefore, when planning and managing, it is necessary to comprehensively consider its ecological, economic, and social values. Yi et al. constructed a comprehensive assessment model to accurately weigh the ecological gains and losses and economic benefits during the development of unutilized land [53], providing a valuable example for scientific and rational planning and ensuring the sustainable use of land resources and the long-term protection of the ecological environment.
During the 40 years from 1980 to 2020, the water area in Hainan Prefecture showed a continuous increasing trend. Additionally, the number of patches, together with the fragmentation and separation indices, exhibited an increasing tendency. This means that water distribution in the region is more discrete, and the connectivity with other landscape types is affected. Concurrently, the dominance index of the water area changed, and its impact on the entire landscape pattern shifted with the expansion of the area. The water area faces many threats with the intensification of urbanization and human activities. Pollution emissions have led to water quality deterioration, and the change in land use around the water area has caused the compression of ecological space, thereby seriously weakening the ecological service functions of the water environment. Relevant studies, such as Zhang et al.’s unique study on water ecological stress [54], have revealed the inverse relationship between the expansion of surrounding construction land and the ecological buffer capacity of the water area, that is, the expansion of construction land significantly reduces the ecological buffer capacity of the water area, strongly highlighting the urgency and necessity of strengthening water protection and rational use in this study.
Landscape Ecological Risk Assessment and Optimal Allocation Strategies
From 1980 to 2020, the landscape of Hainan Prefecture was dominated by low-medium and medium ecological risk levels. The comprehensive ecological risk remained relatively stable, indicating a generally stable ecological security situation.
The spatial distribution pattern of landscape ecological risk is strongly correlated with the the plateau’s natural zonation. As the altitude increased from northeast to southwest across Hainan Prefecture, the temperature and precipitation decreased, and the natural ecosystem transitioned from low-coverage grassland to high-coverage desert to high-coverage grassland and forests. Consequently, the landscape ecological risk distribution in Hainan Prefecture was primarily influenced by natural factors, with human activities playing a more prominent role in the southeastern region of Gonghe County, the central area of Guinan County, and the towns and villages of Tongde County.
Regarding the spatial and temporal distribution of ecological risks, low-risk areas were predominantly situated in regions with extensive forest cover and rich biodiversity, representing valuable ecological resources [55]. Before 2010, the area of low-risk regions gradually increased, whereas after 2010, it declined. Cultivating public welfare forests, establishing and improving forest protection patrol mechanisms, and implementing differentiated protection policies for forests and grasslands are effective measures for protecting low-risk areas. Börner et al.’s systematic assessment of the effectiveness of forest ecosystem protection [56] has verified the significant effect of these measures in improving the service value of the forest ecosystem, providing a reliable reference for local ecological protection practices.
Moderately and lowly covered grasslands are widely distributed, accounting for about 50% of the total area of Hainan Prefecture. Their ecological risk levels are mostly at medium-low levels; although the current ecological protection measures in some areas have improved the vegetation conditions and reduced the ecological risk, the overall ecological security framework still faces potential threats, and there is still room for further risk reduction. In recent years, the execution of ecological protection measures [57] has improved the vegetation situation and has resulted in a significant reduction in ecological risk.
In terms of the spatial autocorrelation of landscape ecological risk, forests, moderate coverage grassland, and low coverage grassland, as important ecological spaces, show a decentralized “faceted” patch L-L clustering pattern. It is therefore crucial to prioritize the restoration and reconstruction of vegetation in moderate and low-coverage grassland areas. Montgomery has proposed strengthening regional monitoring to prevent soil erosion and land polishing, formulate agricultural production layout plans, and control agricultural development in ecologically sensitive areas [58]. In light of the aforementioned evidence, this study posits that it is imperative to implement measures aimed at restoring farmland to its original state as forest and grassland in ecologically vulnerable areas, such as sandy land and rocky desertification zones. Implementing stringent restrictions on deforestation and establishing effective grazing management practices can contribute to the overall reinforcement of the ecological security framework in Hainan Prefecture.
With the continuous population growth and the in-depth progress of urbanization, the distribution pattern of cultivated land and construction land in the river valley area of Hainan Prefecture has changed significantly. The ecological risk caused by human activities has been increasing yearly and shows a significant positive correlation with the change in the construction land area. Since 2010, the degree of separation of construction land patches has increased significantly, clearly reflecting the urgent need to improve the intensive use of construction land in the process of rapid urbanization. Hong et al.’s urban expansion simulation analysis [59] has demonstrated the positive role of rational construction land planning in reducing ecological risk during urban development. In view of this, expanding urban construction-intensive areas, constructing ecological corridors connecting high-risk areas, reasonably reserving development space, strengthening the intensive use efficiency of existing construction land, and strictly controlling the disorderly expansion of new urban construction land have become key measures to optimize the land use pattern and reduce ecological risk.
Economic development and ecological protection coordination should be enhanced, and the industrial structure should be adjusted and optimized. This should coincide with promoting a green, low-carbon recycling development model to effectively protect regional ecological security. A government-led, departmental linkage, multi-party participation work pattern should be established through a multi-pronged approach, including planning guidance, engineering governance, monitoring and early warning, institutional constraints, and social participation.
The aim is to continuously enhance ecological environmental quality, therefore establishing a robust basis for the development of a modern ecological society and economic system in Hainan Prefecture. In light of the water area’s high vulnerability, it is imperative that the allocation of water resources in Hainan Prefecture be optimized to prevent transitional mining. Furthermore, implementing a sewage permit system is essential to reduce the discharge of pollutants from industrial, domestic, and agricultural sources. Establishing buffer zones, including artificial wetlands, in Qinghai Lake and the Yellow River is essential to alleviate the effects of human activity on the aquatic environment.
Study Shortcomings and Recommend Process Improvements
This study presents specific limitations. There exists inherent uncertainty in the assessment process due to variations in data quality, division of risk units, and assignment of weights. Because of the absence of a unified evaluation index system and standardized criteria for risk level division, enhancing the reliability of assessment results is required. The relative nature of the evaluation results complicates their widespread comparison and application.
Another issue is the absence of mature risk management frameworks. Existing studies primarily focus on the assessment itself, lacking feasible risk management and control recommendations. The evaluation methods also require improvement. For instance, the weight assignment method is highly subjective, and factors such as ecosystem service functions need to be incorporated into the basis of judgment.
There is still room to expand the application of GIS grid methods and spatial autocorrelation analysis in risk assessment. It is essential to investigate more intuitive and accurate approaches to represent the spatial characteristics of risk.
In conclusion, the current landscape ecological risk assessment is characterized by several shortcomings, including uncertainty in assessment, a single indicator system, a lack of management countermeasures, the need for method optimization, and insufficient spatial analysis. Continuous improvement and innovation in these areas are essential.
Conclusions
This work developed a landscape ecological risk assessment index system utilizing land-use data from Hainan Prefecture from 1980 to 2020. Spatial analytic techniques quantitatively represented the process of regional land-use change and its ecological impacts. The findings were derived as follows:
(1) The land-use structure of Hainan Prefecture is dominated by grassland, which is allowed by forest and unutilized land. Between 1980 and 2020, cultivated land, construction land, and water areas continued to increase, while forest and unutilized land decreased. From a dynamic perspective, the land-use structure was relatively stable prior to 2000, with more pronounced changes occurring subsequently.
(2) The largest area of land was converted from unutilized land to other types during the 40-year period, with the main type of conversion being low-coverage grassland. This indicates that the unutilized land resources have been fully utilized, but it may also exacerbate the ecological risks in some areas.
(3) The landscape ecological risk index (ERI) was roughly 0.124, signifying a predominantly stable ecological security condition. Nonetheless, regarding spatial distribution, regions with significant ecological risk are predominantly located around Qinghai Lake, river valleys, and urban peripheries. Areas with medium and low ecological risk comprise around 66% of Hainan Prefecture, posing a possible threat to ecological safety.
(4) The landscape ecological risk exhibits pronounced spatial autocorrelation and aggregation distribution characteristics, as evidenced by Moran’s I values between 0.451 and 0.456. Zones with low ecological risk are predominantly situated in regions characterized by high-elevation forests, whereas zones with high ecological risk are usually found in locations with watersheds, undeveloped territory, elevated population densities, and extensive developed land.

