

Introduction
During mining, the influence of surface water, goaf water, and collapsed water and sand, coupled with the complexity of the hydrogeological conditions of the mine, causes frequent occurrences of inrush water in mines. As mining becomes increasingly intensive, the problem of water inrush becomes increasingly prominent [1], and the impact of mine production constrained by water hazards becomes increasingly obvious [2]. Water inrush is a complex geological hazard with multiscale and multifield interactions [3]. Surge water disasters in deep mining operations are a great threat [4]. These disasters not only cause very large economic losses and casualties but also greatly endanger tunnel construction environments and safety [5, 6]. In addition, the abnormal inflow of groundwater into roadways also causes structural instability and strength changes in the surrounding rock [7, 8], leading to mine water. To avoid the occurrence of such disasters, preventive work must be performed in advance. Therefore, it is highly important to conduct a predictive analysis on the risk level of water inrush disasters in the middle sections of mines, which also provides a basis for the protection level of different middle sections of mines.
Mathematical models for research and analysis have been widely applied in various fields. Yang L. et al. [9] investigated the regional competitiveness of cross-border e-commerce using the GEM model. Sha L. et al. [10] investigated the influencing factors of atrial fibrillation using logistic models. Also, Yang W. et al. [11] used system dynamics models to conduct scenario analyses on energy substitution issues. There are many methods of analysis for mine disaster risk analysis, such as fault tree analysis [12], set pair analysis [13], and fuzzy comprehensive evaluation [14]. These methods analyze mines from different perspectives, build corresponding mathematical models, and evaluate the risk level of the mine using relevant calculations. However, the risk evaluation of mine flooding is limited. American operations researcher Sati, a professor at the University of Pittsburgh, first proposed the analytic hierarchy process, which is a hierarchical weighting decision analysis method, in the early 1970s. Buckley J. [15] proposed the fuzzy analytic hierarchy process (FAHP) using fuzzy theory. Raquel W. et al. [16] used the FAHP in combination with other algorithms to classify micropollutants in groundwater. Bhyan P. et al. [17] used the FAHP to prioritize the sustainability performance of green buildings in the construction industry.
The TOPSIS method was first proposed by Hwang C.L. and Yoon K. in 1981. This method ranks the evaluation objects by calculating their proximity to an idealized target, and the shorter the proximity to the ideal target, the better the optimal solution. Vulevic T. et al. [18] investigated the prioritization of vulnerable areas for soil erosion using the TOPSIS method. Wang X. et al. [19] coupled the entropy weight-TOPSIS-grey relationality model to construct a sustainable development evaluation index system for resource-exhausted cities. Based on the TOPSIS algorithm and barrier degree model, Zhao Q. [20] investigated the evolutionary characteristics and barrier factors of sustainable water resource utilization. Pazouki P. et al. [21] ranked the desalination alternatives using the TOPSIS method. Dang P. et al. [22] used TOPSIS combined with a cloud model to propose a comprehensive risk assessment method for hydrogenation units based on decision-making tests and evaluation laboratories. Mostafa P. et al. [23] applied functional resonance analysis and fuzzy TOPSIS to identify and prioritize factors affecting newly emerging risks.
As a powerful numerical solution, the finite difference method (FDM) [24] has been fully used in many fields and plays an important role in risk assessment research. Andreas B. et al. [25] used finite difference theory to analyze financial risks in the financial field. Ouyang C. et al. [26] used the finite difference algorithm to numerically analyze a landslide’s dynamic process and runout characteristics. To ensure the excavation speed of coal mine roadways and improve the structural stability of the roof surrounding rock in the empty roof area of the heading face, Meng W. [27] discussed various factors affecting the structural stability of the roof surrounding rock in the empty roof area of the heading face using finite difference numerical simulations. Wang Z. [28] studied the risk assessment of surrounding rock disasters in the working space of underground phosphorus deposits and used the FDM for quantitative analysis.
Obtaining accurate risk assessment results requires combining multiple assessment methods, which has attracted significant research attention, and not relying on a single assessment method. A combination of FAHP and TOPSIS can be used to evaluate mine risks, which has outstanding features such as high comprehensiveness, the ability to cope with uncertainty, flexibility, applicability, and sustainability. Therefore, in this study, the FAHP–TOPSIS coupling model is first established to determine the risk level of water inrush in different sections. Then, the FDM is used to simulate the groundwater flow field, and the risk level area is divided. Finally, by comparing the results of the two methods, the final risk level is determined, thus achieving an accurate prediction of the risk level of water inrush in the 2960–2660-m section of the Zaozigou Mine. The unique strengths of this paper are the comparative analysis of the results of calculations and simulations to draw conclusions and the longitudinal analysis of the level of risk of a water breakout in a mine.
Materials and Methods
Geological Background
The Zaozigou Gold Mine is located in the upper reaches of Zaozigou in the western part of the Cooperative City, Gansu Province, at the eastern edge of the Tibetan Plateau, with geographic coordinates of east longitude 102°47′00″–102°51′00″ and north latitude 34°57′00″–34°59′00″. Zaozigou is a primary tributary of the Gehe River, which belongs to the Daying River watershed of the Yellow River system. This area features a typical landform characterized by hilly terrain with small undulations. The topography exhibits relatively steep cuts, displaying a landform pattern greater in the north and south and lower in the center. Overall, the terrain gradually slopes from the southwest to the northeast. Groundwater types in this area are mainly bedrock fissure water, quaternary loose rock pore water, and clastic rock fissure pore water. Bedrock fissure water mainly exists in the fissures of various rocks, including magmatic rocks, other than graywacke, before and during the Triassic period. The hydrogeologic map of the mine is shown in Fig. 1.
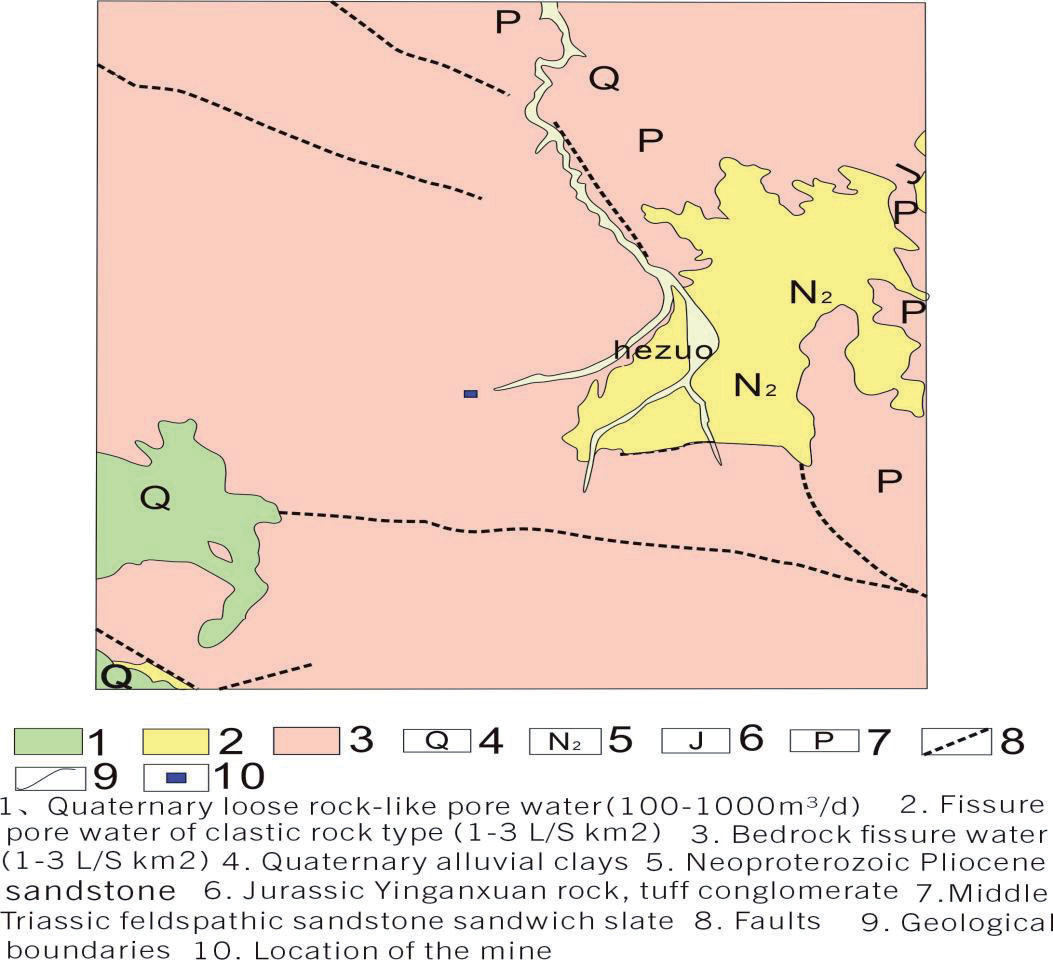
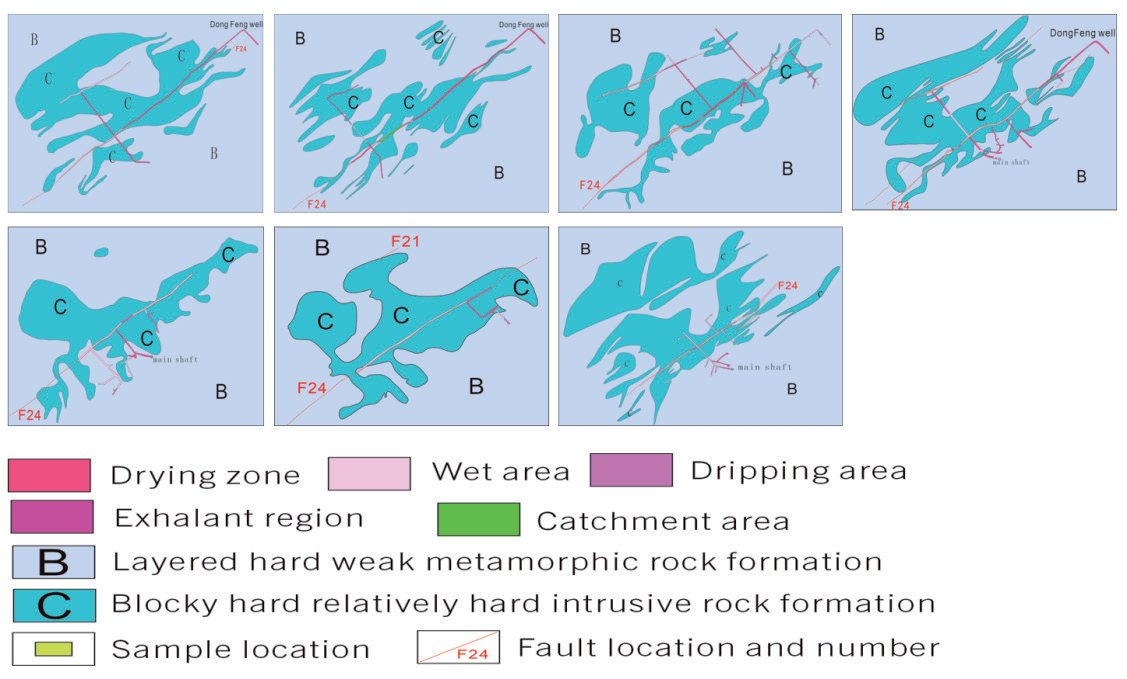
The middle section of the mining development mainly exposes bedrock fissure water. Groundwater in the form of fissure water is present within the weathered fissures and structural fractures of the Triassic slate on both sides of Zaozigou. The area is characterized by intense weathering, with the weathered fissure zone in the mining district developing an average thickness of approximately 32.29 m, whereas in some local sections, it reaches a maximum thickness of 80.65 m. Near the surface, the rocks are more fragmented, and the weathered fissures are more developed, with fissures typically opening to about 1-2 mm and some sections being filled with silty sand. As the depth increases, the water-retaining capacity of the weathered fissures gradually diminishes. Structural fractures generally exhibit extensional characteristics and are occasionally filled with clay and iron materials, with their development being controlled by regional geological structures. The groundwater residing in weathered fissures, aside from a portion that percolates through structural fractures, flows mainly downhill along the terrain from higher to lower elevations, eventually discharging as surface water or subsurface runoff into the valleys. The water content of bedrock fissure water is mainly controlled by meteorological and hydrological conditions, rock characteristics, and the degree of fissure development, and the runoff modulus is generally 1-3 L/s/km2. Fig. 2 shows the hydrogeological engineering map of the 2960-2660 m section of the Zaozigou gold mine.
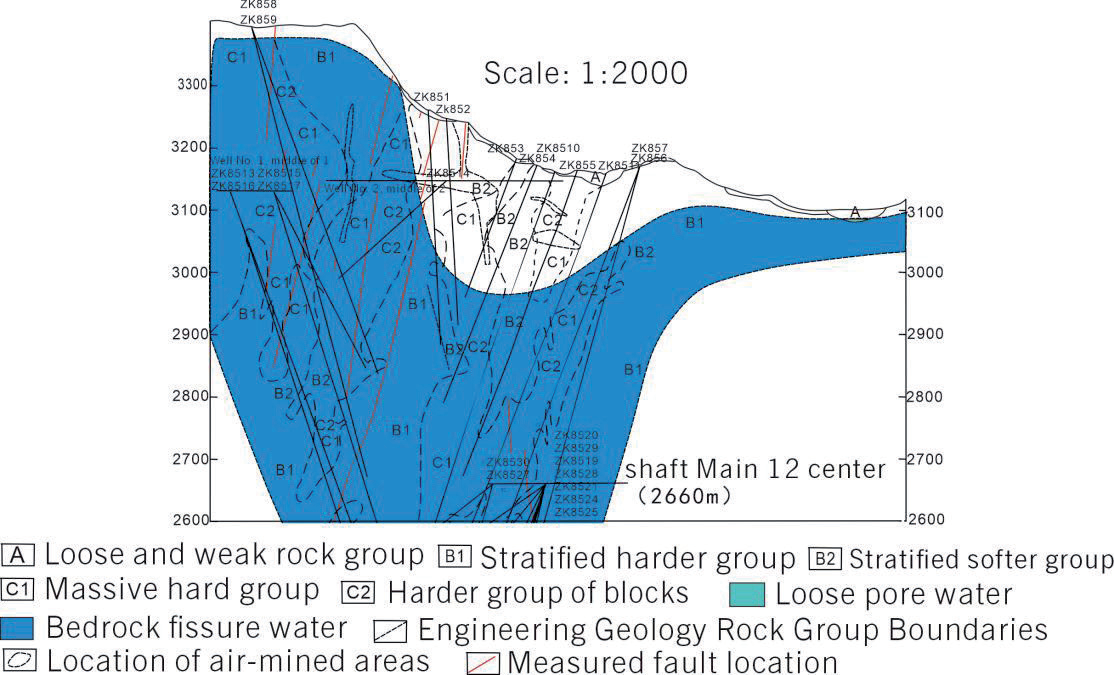
This paper focuses on evaluating the water inflow and outflow in each center section of the 85th pioneering line of the mine and obtaining relevant data through various sampling and testing experiments. Fig. 3 shows the geologic section of the 85th exploration line of the Zaizigou gold mine.
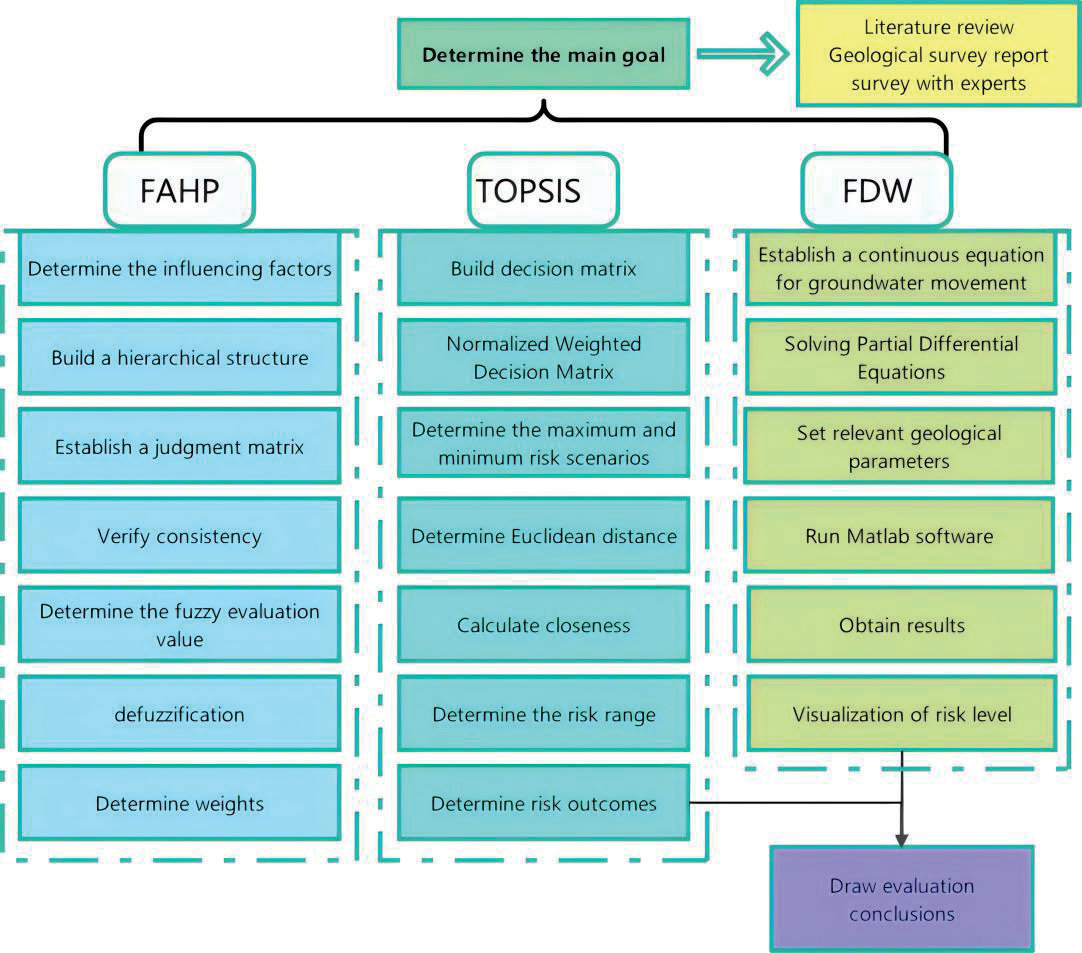
This study entails a field survey and literature review to study the hydrogeology of the Zaozigou area. This study comprises a step-by-step study in three areas. First, the FAHP method is used to derive the weights of the influencing factors by expert scoring and subsequently calculating them. Second, the risk grading criteria are determined, the risk interval is calculated using the TOPSIS method, and the risk level is subsequently determined. Finally, the FDM is used to establish the continuum equation of groundwater motion using Darcy’s law to solve the partial differential equations, and MATLAB software is used to visualize the risk levels; afterward, it is compared with the risk level calculated using the TOPSIS method, analyzed and discussed, and conclusions are drawn. The specific steps of the methodology are shown in Fig. 4.
Weight Calculation Based on the FAHP
In the literature [29, 30], triangular fuzzy numbers are a mathematical tool that can identify and express possible comparative relationships between indicators based on their median characteristics. Thus, they were introduced and applied in the construction of a judgment matrix, which is the core of fuzzy hierarchical analysis. The elements of the judgment matrix are represented as triangular fuzzy numbers M = (l, m, and μ), where l, m, and μ denotes the fuzzy lower bound, fuzzy median, and fuzzy upper bound values, respectively.
The triangular fuzzy number reciprocal judgment matrix
(1)
To ensure the scientific validity and effectiveness of the proposed triangular fuzzy number model, testing for consistency is necessary. If the consistency of the judgment matrix is below a given threshold (usually set as a consistency ratio (CR)<0.1), the triangular fuzzy judgment matrix is considered eligible and acceptable. Conversely, a correction is required to improve the consistency if it is above this threshold. Once the test is passed, each factor’s fuzzy composite judgment value is then calculated.
The fuzzy composite evaluation value for each factor is calculated as follows:
Next, the factors are defuzzified. If M1 = (l1, m1, μ1) and M2 = (l1, m1, μ1) are two triangular fuzzy numbers, then the degree of likelihood of having M1≥M2 is
Finally, the weight is determined as bij = P(Vi>Vj). The final weights after normalization are [31-33]:
TOPSIS Method for Evaluating Risk Levels
The core principle of the TOPSIS method is to utilize the distance between the positive and negative ideal solutions to rank the evaluation objects, which is widely used in multiobjective decision-making problems. The positive ideal solution is the distance of each index to reach the optimal level, whereas the negative ideal solution is the opposite [34-38]. This concept explains how the traditional TOPSIS method determines the best solution. To ensure the accuracy and reliability of the results, this study introduces the concept of combining interval mathematics and the TOPSIS method, which makes the calculated values vary within a certain uncertainty range [39]. The basic steps of the I–TOPSIS method are explained below.
The initial judgment matrix is constructed
Where rij is the judgment index, which is defined as the j-th index of the i-th program, i∈[1,m], j∈[1,n]. According to the theory of the TOPSIS method, processing the initial judgment matrix Z requires combining it with the total ranking weight matrix W obtained using the FAHP method. This step is done by weighting, i.e., multiplying the elements in the initial judgment matrix Z with their corresponding weights in the total ranking weight matrix W to obtain a weighted judgment matrix, which helps measure each alternative’s relative merits more accurately.
The weighted judgment matrix R is first normalized [40].
Next, the least risky scenario and the riskiest scenario are determined as [41]:
where J1 is a positive indicator, i.e., the larger the indicator is, the better; J2 is a negative indicator, i.e., the lower the indicator is, the better; V1+ is the value with the largest value in the first row of the normalized matrix V; Vm+ is the value with the largest value in the mth row; V1– is the value with the smallest value in the first row of the normalized matrix V; Vm– is the value with the smallest value in the mth row.
The distance between the object of judgment and the optimal solution is then calculated separately as:
where Dj+, Dj– are the distances between the judgment object and the optimal solution and worst solution, respectively.
Finally, the proximity is calculated, and the proximity Ei of the i-th factor to the optimal solution can be expressed as:
The closer the value of Ei∈(0,1), the closer Ei is to 1, indicating that the factor is closer to the optimal solution and the risk level is higher. In a vice-versa situation, the risk level is lower [42, 43].
FDM Numerical Simulation Analysis
The unsteady groundwater movement can be described by the continuum kinetic equation [44], which assumes that the groundwater movement in the loosely deposited stratified rock layers in the area under study is widely distributed and occurs mainly in the horizontal direction.
where Kz represents the cross-flow recharge coefficient; dz represents the vertical distance passed by the cross-flow; Th represents the hydraulic conductivity in the horizontal direction of the aquifer; Hz represents the head of the recharge layer of the aquifer; W represents the amount of recharge water measured per unit of time and unit of area of the aquifer (with the outflow taking a negative value); S represents the water storage coefficient of the aquifer; H represents the initial water level [45].
In this work, the continuity equation is first established based on Darcy’s law [46] because, in a closed system, the inflow and outflow are balanced.
where q is the flow rate per unit area, usually expressed as flow/time. Also, k is the coefficient of permeability, which indicates the ease with which a fluid can pass through a porous medium. ∇h is the gradient of the head, i.e., the rate of change of the head along the flow direction. The above equations are solved using FDM, which solves partial differential equations by replacing derivatives with difference approximations:
(15)
In porous media, a formation’s compressibility or volume change significantly affects fluid flow. This effect can be characterized by the water storage coefficient, which is the amount of water stored or released in a unit volume of porous medium per unit pressure change. The change in pore volume due to a change in the water head can be expressed by the following equation:
where S is the water storage coefficient, representing the change in unit pressure and the rate of change in the water level, and V represents the pore volume caused by the change in the water head.
Mine Hierarchy Analysis
In this work, according to the engineering characteristics of the mine below 3000 m in elevation in Zaozigou, multiple factors affecting mine inrush water are carefully analyzed, and the rock physical properties, geological characteristics, hydrological characteristics, and engineering conditions of the four aspects of the mine are considered [47, 48]. The structural model of the factors influencing water inrush in the mine is shown in Fig. 5.
(1) Rock permeability: Rock permeability determines a rock’s ability to transport water. High permeability causes water inrush, which is commonly referred to as the coefficient of permeability. The permeability coefficient is the water seepage rate in a rock under a unit hydraulic gradient.
(2) Density: The density of fissures in rocks significantly affects water permeability and transport capacity. The higher the fracture density, the higher the rock’s permeability and the higher the water inrush risk.
(3) Porosity: A rock’s porosity also affects its ability to let water seep through it. A rock with high porosity holds more water, increasing the likelihood of water inrush.
(4) Rock inclination: Rock inclination affects the path and speed of groundwater transportation, which increases the risk of inrush water in the mine.
(5) Fault distribution: Fault distribution also affects groundwater transport and velocity and is quantified by the number of faults.
(6) Lithological changes: Changes in the lithology and geological characteristics of a mine also affect inrush water. For example, the rock layer’s integrity and the lithology’s hardness and unevenness increase the possibility of water inrush.
(7) Water-richness: The greater the degree of water-richness, the greater the probability of water inrush. Aquifer water richness is generally reflected by the size of the unit water influx obtained from borehole pumping tests in the well field.
(8) Thickness of aquifer: An aquifer is a stratum with high water content and excellent permeability, and the greater the thickness of the aquifer, the greater the likelihood of water inrush.
(9) Water absorption rate: The water absorption rate of rock formations in mines is an important factor affecting water inflow and outflow. A high water absorption rate of the rock layer means the rock will absorb water quickly, which increases the risk of water inrush in the mine.
(10) Depth of the mine: As the depth of mining increases, the hydrogeological conditions underground become more complex, which also affects water inrush in the mine.
(11) Extraction methods: There are many different mine extraction methods, and each method has different degrees of influence on the inrush water in a mine.
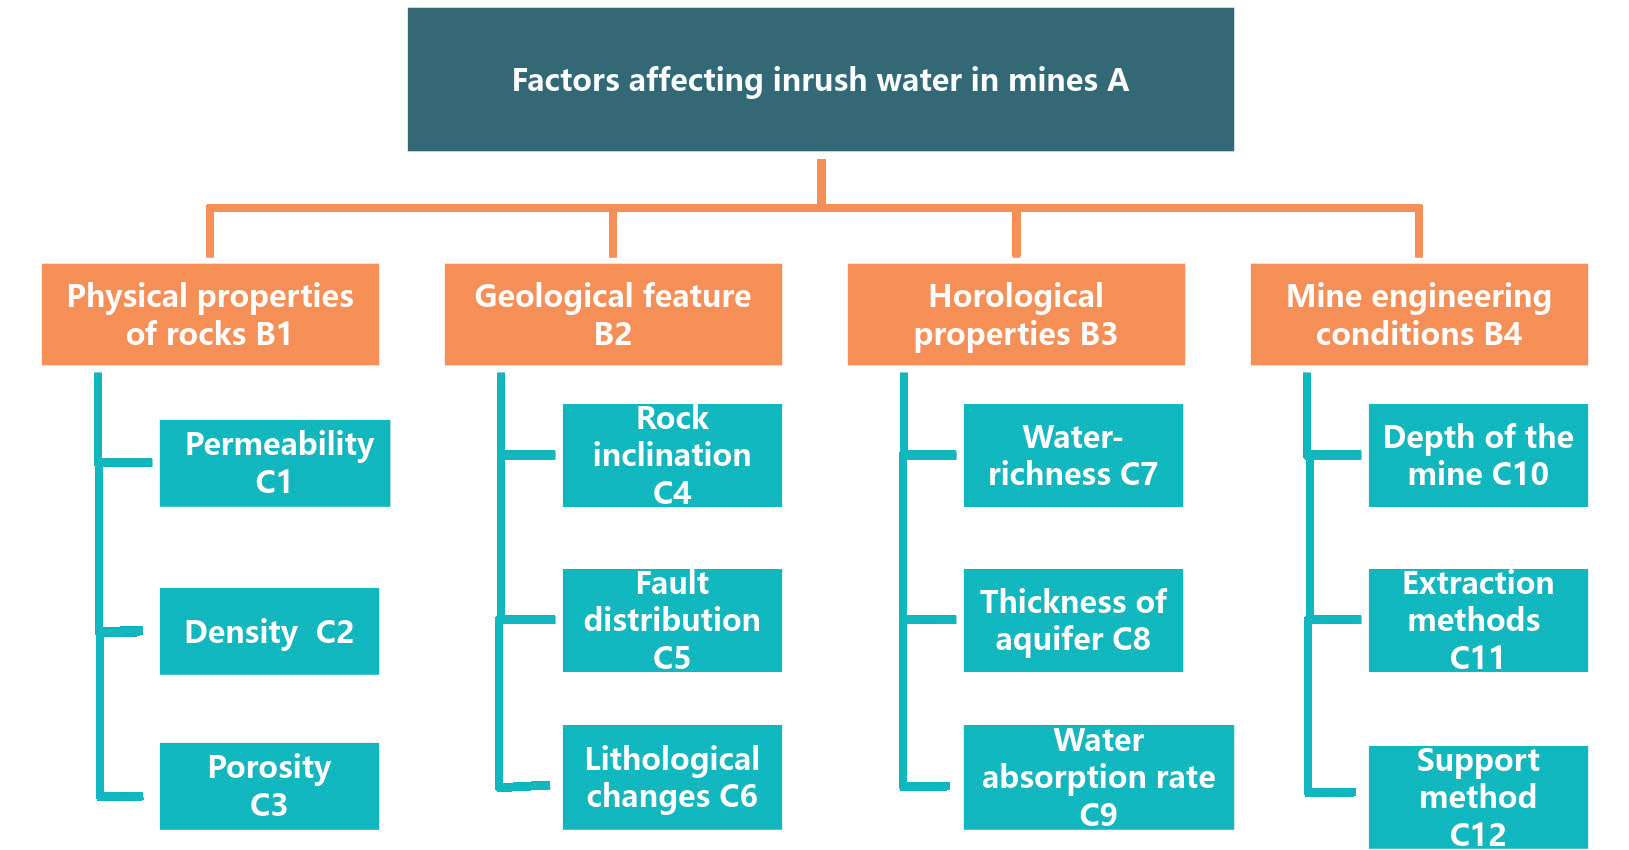
(12) Support method: Reasonable mine support is important to prevent water influx. The reasonable selection of support materials and methods can enhance the overall stability of a mine, and the possibility of water influx can be reduced.
The density, porosity, water absorption, and water-richness data in Table 1 were obtained from sampling experiments, and the rock permeability, rock dip, fault distribution, aquifer thickness, and mine depth data were obtained from the Zaizigou ground investigation. The No. 2660 m section is S7, the 2710 m section is S6, and the 2960 m section is S1.
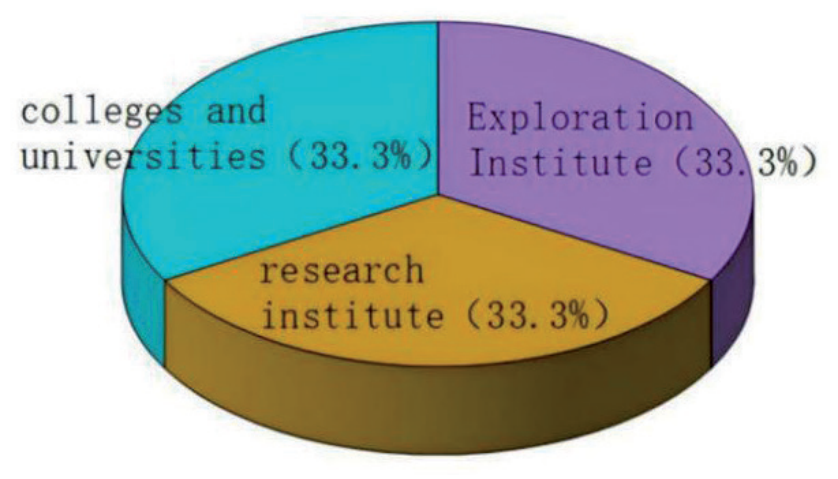
The FAHP analysis method forms a fuzzy complementary judgment matrix by comparing the relative importance of various factors. A survey questionnaire was created using a scoring system of 1 to 9 points, and experts were invited to compare and rate the results. This study invited 30 experts from universities, research institutes, and geological exploration institutes. The percentage of experts from each institution is shown in Fig. 6, and the basic information is shown in Table 2. Evidently, the experts are evenly distributed, and the invited experts are professionals with extensive work experience, higher education, and certain professional titles.
Results and Discussion
FAHP–I–TOPSIS Risk Analysis
The weights are calculated according to the FAHP method combined with the results of expert scoring as shown in Table 3.
Combining the relevant literature [49] and consulting relevant experts, the factors affecting the risk occurrence of mine inrush water are classified into five levels: level 1 indicates low risk, level 2 indicates lower risk, level 3 indicates general risk, level 4 indicates higher risk, and level 5 indicates high risk. The related risk factor indicators are graded as shown in Table 4.
Table 1.
Indicator data for risk factors.
Table 2.
Basic information from the experts.
Based on the grading scale of the risk factor indicators (Table 3), six typical samples were established, and an initial evaluation matrix was created using the best value, the worst value, and the boundary values of neighboring grades.
The relative proximity corresponding to each risk level was calculated and is shown in Table 5.
The risk level of each middle section of the mine is assessed according to the relative proximity of the water in the middle section of the mine. Among them, level 1 indicates low risk and no additional preventive measures are needed; level 2 indicates that lower risk and real-time monitoring means can be used and that protective measures can be implemented when necessary; level 3 indicates that average and necessary preventive measures need to be taken and real-time monitoring strengthened; level 4 indicates that greater risk and protective and monitoring measures must be implemented in real-time; and level 5 indicates that high risk and protection must be implemented and real-time monitoring must be conducted. At the same time, the experimental analysis of inrush water was carried out, which is based on site conditions and expert recommendations and is needed to optimize the construction plan.
Table 3.
Results of weight calculation using the FAHP method.
| B1 | B2 | B3 | B4 | Total weight W | |
|---|---|---|---|---|---|
| 0.110 | 0.212 | 0.633 | 0.045 | ||
| C1 | 0.627 | 0.069 | |||
| C2 | 0.280 | 0.031 | |||
| C3 | 0.094 | 0.010 | |||
| C4 | 0.091 | 0.019 | |||
| C5 | 0.691 | 0.146 | |||
| C6 | 0.218 | 0.046 | |||
| C7 | 0.635 | 0.402 | |||
| C8 | 0.287 | 0.182 | |||
| C9 | 0.078 | 0.049 | |||
| C10 | 0.078 | 0.004 | |||
| C11 | 0.635 | 0.029 | |||
| C12 | 0.287 | 0.013 |
The risk level of water inrush hazard is predicted for seven middle sections from 2660-2960 m in the deep part of the Zaozigou mining area. By optimizing the weights of the C1–C12 indicators calculated using the FAHP method and combining them with the principles of the I–TOPSIS method, the proximity of the indicators of the S1–S7 water inrush risk level in each section was finally obtained [50]. The distances and proximities of the different mid-section water inrush risk classes below 3000 m in elevation to the positive and negative ideal solutions are shown in Table 6.
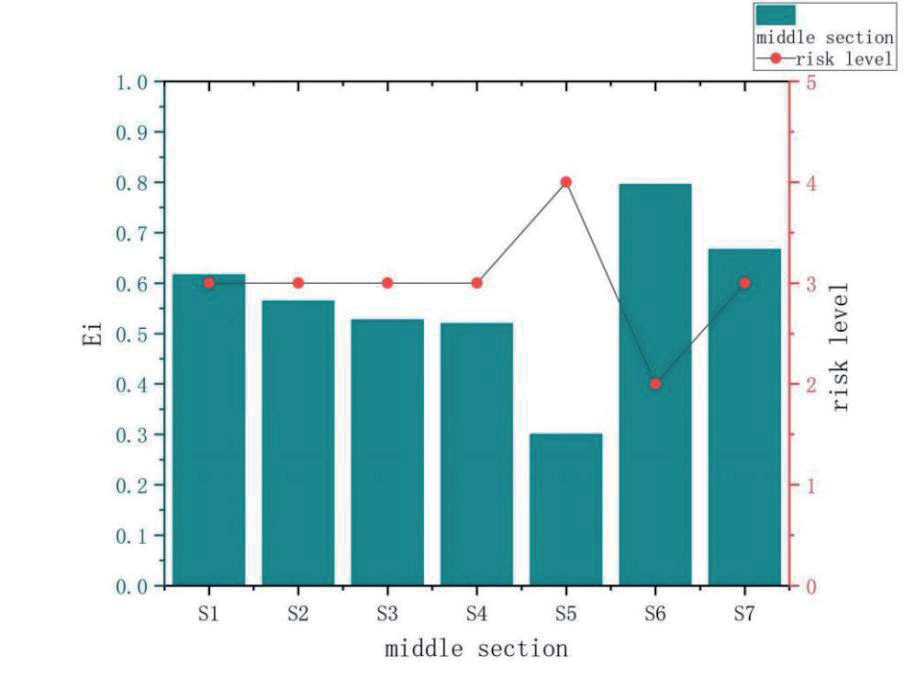
According to the results in Table 5 and referring to Table 4 above, the risk level of water influx in the middle section of S1–S7 can be obtained, and the results of the risk level are shown in Fig. 7.
The risk level of the middle section of S5 is 4, and level 4 indicates higher risk. Protective measures must be taken, and real-time monitoring must be strengthened. The risk level of the middle section of S1, S2, S3, S4, and S7 is 3 in decreasing order of S4>S3>S2>S1>S7. Level 3 indicates general, and it is necessary to take the necessary precautions and strengthen real-time monitoring. The risk level of the middle section of S6 is 2, and level 2 indicates lower risk. Real-time monitoring methods can be targeted, and protective measures can be taken when necessary.
Numerical Simulation Risk Analysis
The scope and area of the simulated groundwater flow field, including the geology around the mine and the topography and geomorphology of the mine area, were determined. In this work, the simulation area was set to 1000 m×1000 m×350 m. According to the relevant geological data, the hydrogeological parameters of permeability and porosity were set. The simulation area was discretized, the grid was divided, a three-dimensional grid was established, and finite difference calculations were performed on each grid cell. Next, the groundwater flow’s direction and horizontal distribution were determined according to geological conditions, such as stratigraphic tendencies and fracture structures. Then, the boundary conditions of the groundwater basin, including the water level, water pressure, and head, were set. Boundary conditions such as inflow, outflow, and head change were set according to the actual situation. According to the geological information and measured data, appropriate values of hydrogeological parameters were assigned to different geological units. The equations of the finite difference model were established according to Darcy’s law and other hydrogeological principles [51, 52]. Finally, the codes were written using MATLAB software.
Table 4.
Classification of risk factor indicators.
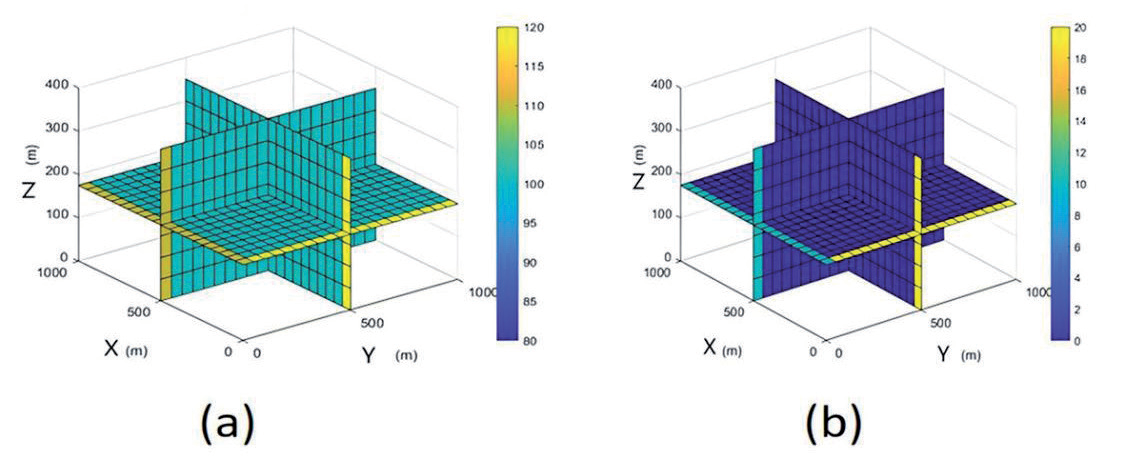
The software was run to simulate the groundwater flow field numerically. The distributions of the groundwater flow direction and head change around the mine were calculated, and the final simulation results are shown in Fig. 8.
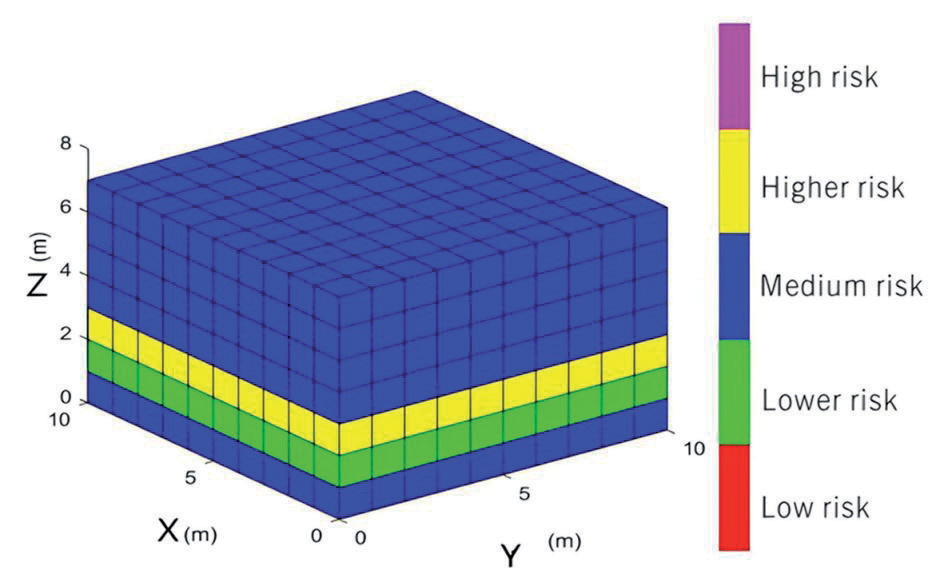
The simulation results define the risk level threshold by the amount of head change: a head change greater than 20 is considered high risk, a head change less than or equal to 20 and greater than 15 is considered higher risk, a head change less than or equal to 15 and greater than 10 is considered medium risk, a head change less than or equal to 10 and greater than 5 is considered lower risk, and a head change less than or equal to 5 is considered low risk. The 1000×1000×350 grid is divided into 10×10×7 equal rectangular grids; the seven grids in the Z direction represent the seven middle sections of the well, and the final risk level is shown in Fig. 9.
Table 5.
Criteria for the hierarchical classification of indicators.
| Risk level | Ei |
|---|---|
| Level 1 | (0.8405,1) |
| Level 2 | (0.6752,0.8405) |
| Level 3 | (0.5049,0.6752) |
| Level 4 | (0.2981,0.5049) |
| Level 5 | (0,0.2981) |
Discussion
Fig. 7 and Fig. 9 reveal that the results of the two studies are highly consistent, both of which show that the risk of water inrush in the middle section of 2760 m is greater, the risk of water inrush in the middle section of 2710 m is lower, and the risk of water inrush in the other sections is average. Thus, it is necessary to pay close attention to the water inrush in the middle section of 2760 m during mining. The analysis revealed that the risk of water inrush in each section is not in a single increasing or decreasing state but is related to the specific geological conditions of the mine.
In addition, Niu C. et al. [53] and Sun Z. et al. [54] reported that the water richness of the ore layer is an important factor in evaluating the water inrush risk. Yin H. et al. [55] reported that the occurrence of water inrush underground is influenced by many factors. Therefore, this finding coincides with the conclusion drawn in this study that the risk of water inrush underground does not simply increase or decrease with the mining depth.
Several limitations were also discovered while conducting this study. First, the FAHP method used in the research method to calculate the weights of various factors is based on expert scoring, so the collected data have a certain degree of subjectivity. Second, among the twelve influencing factors proposed in this study, it was not considered whether there was mutual influence among the influencing factors. Third, in terms of the research methods, the boundary conditions set for the simulation part are in an ideal state, whereas the actual mine boundary conditions have various complexities. For future works, in addition to narrowing this limitation through more in-depth research, the research and protection for higher-risk middle sections in combination with the law of groundwater migration should be investigated.
Conclusions
(1) Many factors influence the occurrence of water inrush disasters in deep mines. This study analyzes and identifies 12 factors that influence water inrush disasters from four aspects: rock physical properties, geological characteristics, hydrological characteristics, and mine engineering conditions. Among them, the impact of water richness is the greatest.
(2) The results showed that the risk of water inrush is greater in the 2760 m section of the Zaozigou mine, whereas the risk of water inrush is lower in the 2710 m section. The risk of water inrush in the remaining middle section is average. Therefore, when deep mining is conducted in a mine, strict attention should be given to the water inrush situation in the 2760 m section, and real-time monitoring and corresponding waterproof measures should be taken to avoid the occurrence of mine floods.
(3) Finally, the results revealed that the risk of water inrush in each section of the Zaozigou mine is not in a single increasing or decreasing state but is related to the specific geological conditions of the mine. Therefore, prediction and prevention work must be performed in advance when underground mining is conducted.

