

Introduction
Agriculture plays a pivotal role in ensuring food security and economic stability worldwide. However, with the intensification of agricultural activities, the sector has become a major contributor to greenhouse gas emissions, accounting for approximately 10-12% of global emissions [1]. In China, agricultural carbon emissions represent about 16-17% of the country’s total emissions, posing a significant challenge to achieving the nation’s “dual carbon” goals – carbon peaking by 2030 and carbon neutrality by 2060 [2, 3]. The rapid modernization of China’s agricultural sector has led to extensive use of chemical fertilizers, pesticides, and irrigation systems, which have significantly increased carbon emissions and environmental degradation [4]. As policymakers strive to achieve a green transition, understanding the regional disparities and carbon pressure variations in the agricultural sector is crucial for developing effective mitigation strategies [5]. Despite the government’s efforts in promoting sustainable agricultural practices, regional imbalances in carbon emissions and ecosystem carrying capacities persist, necessitating a comprehensive analysis of these disparities to formulate region-specific low-carbon policies.
Numerous studies have investigated the relationship between economic development and environmental impact, with the Environmental Kuznets Curve (EKC) hypothesis providing a widely recognized framework [6]. The EKC theory posits that environmental degradation initially intensifies with economic growth but eventually declines once a certain level of economic development is achieved. However, empirical studies have shown varying EKC patterns across different regions and agricultural production systems, suggesting the need for more nuanced regional analyses [7, 8]. In China, existing research indicates that provinces with higher agricultural outputs often experience slower emission reductions, complicating the decoupling process between economic growth and carbon emissions [9]. The Tapio decoupling model has been widely used to assess the dynamic relationship between agricultural economic growth and carbon emissions [10]. This model categorizes the relationship into different decoupling states, such as weak decoupling, strong decoupling, and expansive coupling, offering a more detailed understanding of how agricultural sectors respond to economic and environmental policies.
Despite the growing body of literature on agricultural carbon emissions, several gaps remain. Previous studies have primarily focused on carbon emissions alone, without considering the ecological carrying capacity of regional ecosystems [11]. This study introduces the Agricultural Carbon Pressure Index (ACPI), which provides a more comprehensive evaluation by integrating both agricultural carbon emissions and the ecosystem’s ability to absorb them. Additionally, existing research has not sufficiently accounted for the significant regional disparities in agricultural production modes, resource endowments, and policy implementation. This study addresses this gap by conducting a province-level analysis covering 31 regions from 2003 to 2022. Furthermore, spatial analysis methods, such as Moran’s I coefficient and local indicators of spatial association (LISA), have been underutilized in assessing the geographic clustering and spillover effects of agricultural carbon pressure [12]. Incorporating these methods into the analysis allows for a better understanding of the spatial dynamics and regional disparities in agricultural carbon emissions.
In response to these challenges, this study aims to calculate and analyze the Agricultural Carbon Pressure Index across China’s 31 provinces, considering both agricultural carbon emissions and ecosystem carbon sequestration capacity. The study also examines the decoupling relationship between agricultural economic growth and carbon emissions using the Tapio decoupling model. Furthermore, spatial clustering patterns and regional disparities in agricultural carbon pressure are explored through spatial autocorrelation analysis. By providing an in-depth analysis of regional differences and spatial patterns, this research contributes to the existing body of knowledge and offers valuable insights for policymakers to formulate targeted carbon reduction strategies.
The remainder of this paper is structured as follows. The next section presents the methodology and data sources, including the calculation methods and data collection process. Following this, the results and discussion section provides a detailed analysis of the trends, regional disparities, and spatial patterns of agricultural carbon pressure. Finally, the conclusion section summarizes the key findings and offers policy recommendations to support sustainable agricultural development in China.
Experimental
Data Sources
This study conducts a statistical analysis of data from 31 provinces and municipalities in China (excluding Hong Kong, Macao, and Taiwan due to data availability constraints). The primary data sources used in this research are as follows: First, data related to agricultural production, including fertilizer usage, plastic film consumption, agricultural diesel consumption, pesticide usage, crop planting area, irrigated area, and agricultural output value, were mainly obtained from the China Statistical Yearbook and provincial statistical yearbooks from 2004 to 2023. Second, foundational data for calculating the ecosystem’s carbon carrying capacity, such as forest and grassland coverage, were sourced from the China Statistical Yearbook, regional statistical yearbooks, the China Rural Statistical Yearbook (2004-2023), the EPS database, as well as publications from the Ministry of Natural Resources and the National Forestry and Grassland Administration. Additional calculation coefficients were derived from relevant research conducted by domestic and international scholars. For missing data, values were linearly interpolated based on adjacent years, and a canonical correspondence analysis was performed using the average data of each indicator over the past five years. To eliminate the effects of price factors and dimensional differences on the analysis results, relevant data were uniformly deflated and standardized.
Research Methods
Agricultural Carbon Emissions
Following existing research, this study uses the carbon emission coefficient method provided by the United Nations Intergovernmental Panel on Climate Change (IPCC) to estimate the agricultural carbon emissions of 31 provinces in China [13]. The academic community widely recognizes that resource consumption and land operations during agricultural production contribute to greenhouse gas emissions. In this study, fertilizers, pesticides, agricultural plastic film, agricultural machinery, irrigation, and tillage were selected as primary sources of carbon emissions in agricultural production [14, 15]. The formula for estimating agricultural carbon emissions is as follows:
where ET represents the total agricultural carbon emissions; Ef is the carbon emissions from fertilizers; Ep denotes emissions from pesticides; Em represents emissions from agricultural plastic film; Ee denotes emissions from agricultural machinery; and Ei represents emissions from agricultural irrigation. The calculation formulas for carbon emissions from each source are as follows:
where Gf denotes fertilizer usage, with a = 0.8956 kg/kg; Gp is pesticide usage, with b = 4.9341 kg/kg; Gm represents the consumption of agricultural plastic film, with c = 5.18 kg/kg; Ge is the total power of agricultural machinery, with d = 0.18 kg/kW; Ae is the farmland area, with g = 16.47 kg/hm2; and Ai represents the irrigated area, with h = 266.48 kg/hm2. The coefficients a, b, c, d, g, and h are carbon emission factors for each source, with values primarily referenced from the IPCC and relevant research findings from both domestic and international studies.
Agricultural Carbon Emissions
The OECD decoupling model was first applied to the study of environmental and economic relationships, particularly in analyzing the variations between economic growth and energy consumption during the industrialization of developed countries [16]. Later, Tapio further refined this approach by incorporating both absolute and relative changes in the research subjects, thereby proposing the Tapio Decoupling Model. This model overcomes the limitations of the OECD decoupling model in terms of baseline selection, offering greater accuracy and objectivity. Thus, this study adopts the Tapio Decoupling Model to analyze the decoupling relationship between agricultural economic development and carbon emissions in 31 provinces in China. The specific formula is as follows [17]:
where e represents the decoupling index; ΔZ denotes the change in agricultural carbon emissions; Z represents the agricultural carbon emissions; ΔG indicates the change in total agricultural output value; and G is the total agricultural output value. The classification criteria for specific decoupling states are shown in Table 1.
Carbon Carrying Capacity
Carbon carrying capacity (carbon sequestration) refers to the amount of CO₂ that vegetation within a region can fix through photosynthesis [18]. In the context of agriculture, carbon carrying capacity specifically denotes the maximum capacity of a region’s ecosystem to net absorb CO₂ produced by agriculture-related activities over a given period. For calculating the carbon carrying capacity at the provincial level, this study primarily considers the carbon sequestration capacities of forest, grassland, and farmland ecosystems. The formulas used to calculate the carbon carrying capacity are as follows:
where Qi represents the yield of the i-th major crop; di is the carbon content rate of the i-th crop; fi is the moisture content of the i-th crop; and Ei is the economic coefficient of the i-th crop. Here, Z denotes agricultural carbon emissions; CC represents the regional carbon carrying capacity; CCF and CCG are the carbon sequestration capacities of forests and grasslands, respectively; and CCP is the carbon sequestration capacity of farmland. MI denotes the area of the I-th type of vegetation, while SI represents the average annual carbon absorption capacity of the I-th vegetation type. Based on studies by experts and scholars, this study adopts a forest carbon absorption coefficient of 3.81 t/hm² and a grassland carbon absorption coefficient of 0.21 t/hm². Using the formulas above, the carbon sequestration capacities of forest, grassland, and farmland ecosystems can be calculated. Summing these values provides the total carbon carrying capacity of the regional ecosystem. Based on this calculation, a model for measuring agricultural carbon carrying capacity is established as follows:
where ACC denotes the regional agricultural carbon carrying capacity, and r is the agricultural carbon carrying capacity coefficient, defined as the proportion of agricultural industry value added to the regional gross domestic product (GDP).
Table 1.
Decoupling state discrimination.
Agricultural Carbon Pressure Index
Agricultural carbon emissions impose a certain level of pressure on the ecological environment. This study introduces the concept of the Agricultural Carbon Pressure Index (ACPI), which reflects the degree of pressure that agricultural carbon emissions exert on a region’s ecological environment. The ACPI considers both agricultural carbon emissions and the carbon sequestration capacity of the ecological environment, providing a more comprehensive assessment of the balance between human agricultural carbon activities and the natural environment. The model for calculating the ACPI is as follows:
where ACPI represents the Agricultural Carbon Pressure Index, with values ranging between 0 and 1. When ACPI = 0.5, it indicates that the carbon carrying capacity (CC) and the agricultural carbon capacity (ACC) are equal, representing the critical threshold for agricultural ecological safety. As the ACPI approaches 1, the pressure from agricultural carbon emissions greatly exceeds the agricultural carbon carrying capacity, indicating a high environmental risk. Conversely, when the ACPI approaches or falls below 0.5, it suggests that the agricultural ecological environment is safe. Based on the ACPI values, the environmental risk of regional agricultural carbon emissions is classified into five levels, ranging from safe to extremely severe risk (Table 2).
Theil Index
The Theil Index, derived from the concept of entropy in information theory and also known as the Theil Entropy Measure, is widely recognized for its decomposability, which allows for a clear identification of regional disparity structures and sources of differences [19]. This index has been extensively used to analyze regional differences in carbon emissions and energy efficiency. In this study, we introduce the Theil Index to explore the regional disparity characteristics of the Agriculture Carbon Stress Index.
In the formula, nq represents the number of provinces included in each region; n is the total number of provinces; Tq is the Theil index of agriculture carbon pressure within each region; di, d̅ q nd d̅ denote the agriculture carbon pressure index of province i within each region, the average agriculture carbon pressure index within each region, and the national average tourism carbon pressure index, respectively; Tw and TB represent the Theil index within and between regions, respectively; T signifies the overall Theil index of the agriculture carbon pressure difference, ranging from 0 to 1. A higher T value indicates a greater disparity in the regional agriculture carbon pressure index.
Spatial Autocorrelation Analysis
Spatial autocorrelation analysis includes both global and local spatial autocorrelation [19]. The global Moran’s I index is used to measure the overall spatial autocorrelation of carbon emissions across regions, with values ranging from [-1, 1]. A value greater than 0 indicates a clustering pattern, with values closer to 1 showing a more pronounced clustering tendency. Conversely, a value less than 0 indicates a dispersed pattern, while a value of 0 suggests no spatial correlation. The formula for calculating Moran’s I is as follows:
where n is the number of administrative units; Wij represents the spatial weight matrix between administrative units i and j; xi and xj are the agricultural carbon pressure indices for units i and j; and x̅ is the mean agricultural carbon pressure index across all units.
Local spatial autocorrelation examines spatial heterogeneity, meaning that the degree of spatial autocorrelation varies across regions. The Local Indicators of Spatial Association (LISA) is used to test local spatial autocorrelation:
In this formula, when Ii is greater than 0, it indicates a positive spatial correlation in the neighboring regions, which includes “high-high” and “low-low” types, where adjacent areas exhibit high (or low) carbon emission clustering. When Ii is less than 0, it indicates a negative spatial correlation, including “high-low” and “low-high” types, where adjacent regions show significant differences in carbon emissions.
Regional Division of the Study Area
In accordance with China’s official classification standards, we divided China into three regions for this study: the eastern, central, and western regions. The eastern region includes Beijing, Tianjin, Hebei, Liaoning, Shanghai, Zhejiang, Jiangsu, Fujian, Shandong, Guangdong, and Hainan. The central region comprises Shanxi, Jilin, Heilongjiang, Anhui, Jiangxi, Henan, Hubei, and Hunan. The western region includes Inner Mongolia, Guangxi, Chongqing, Sichuan, Guizhou, Yunnan, Tibet, Shaanxi, Gansu, Qinghai, Ningxia, and Xinjiang.
Results and Discussion
Agricultural Carbon Emissions
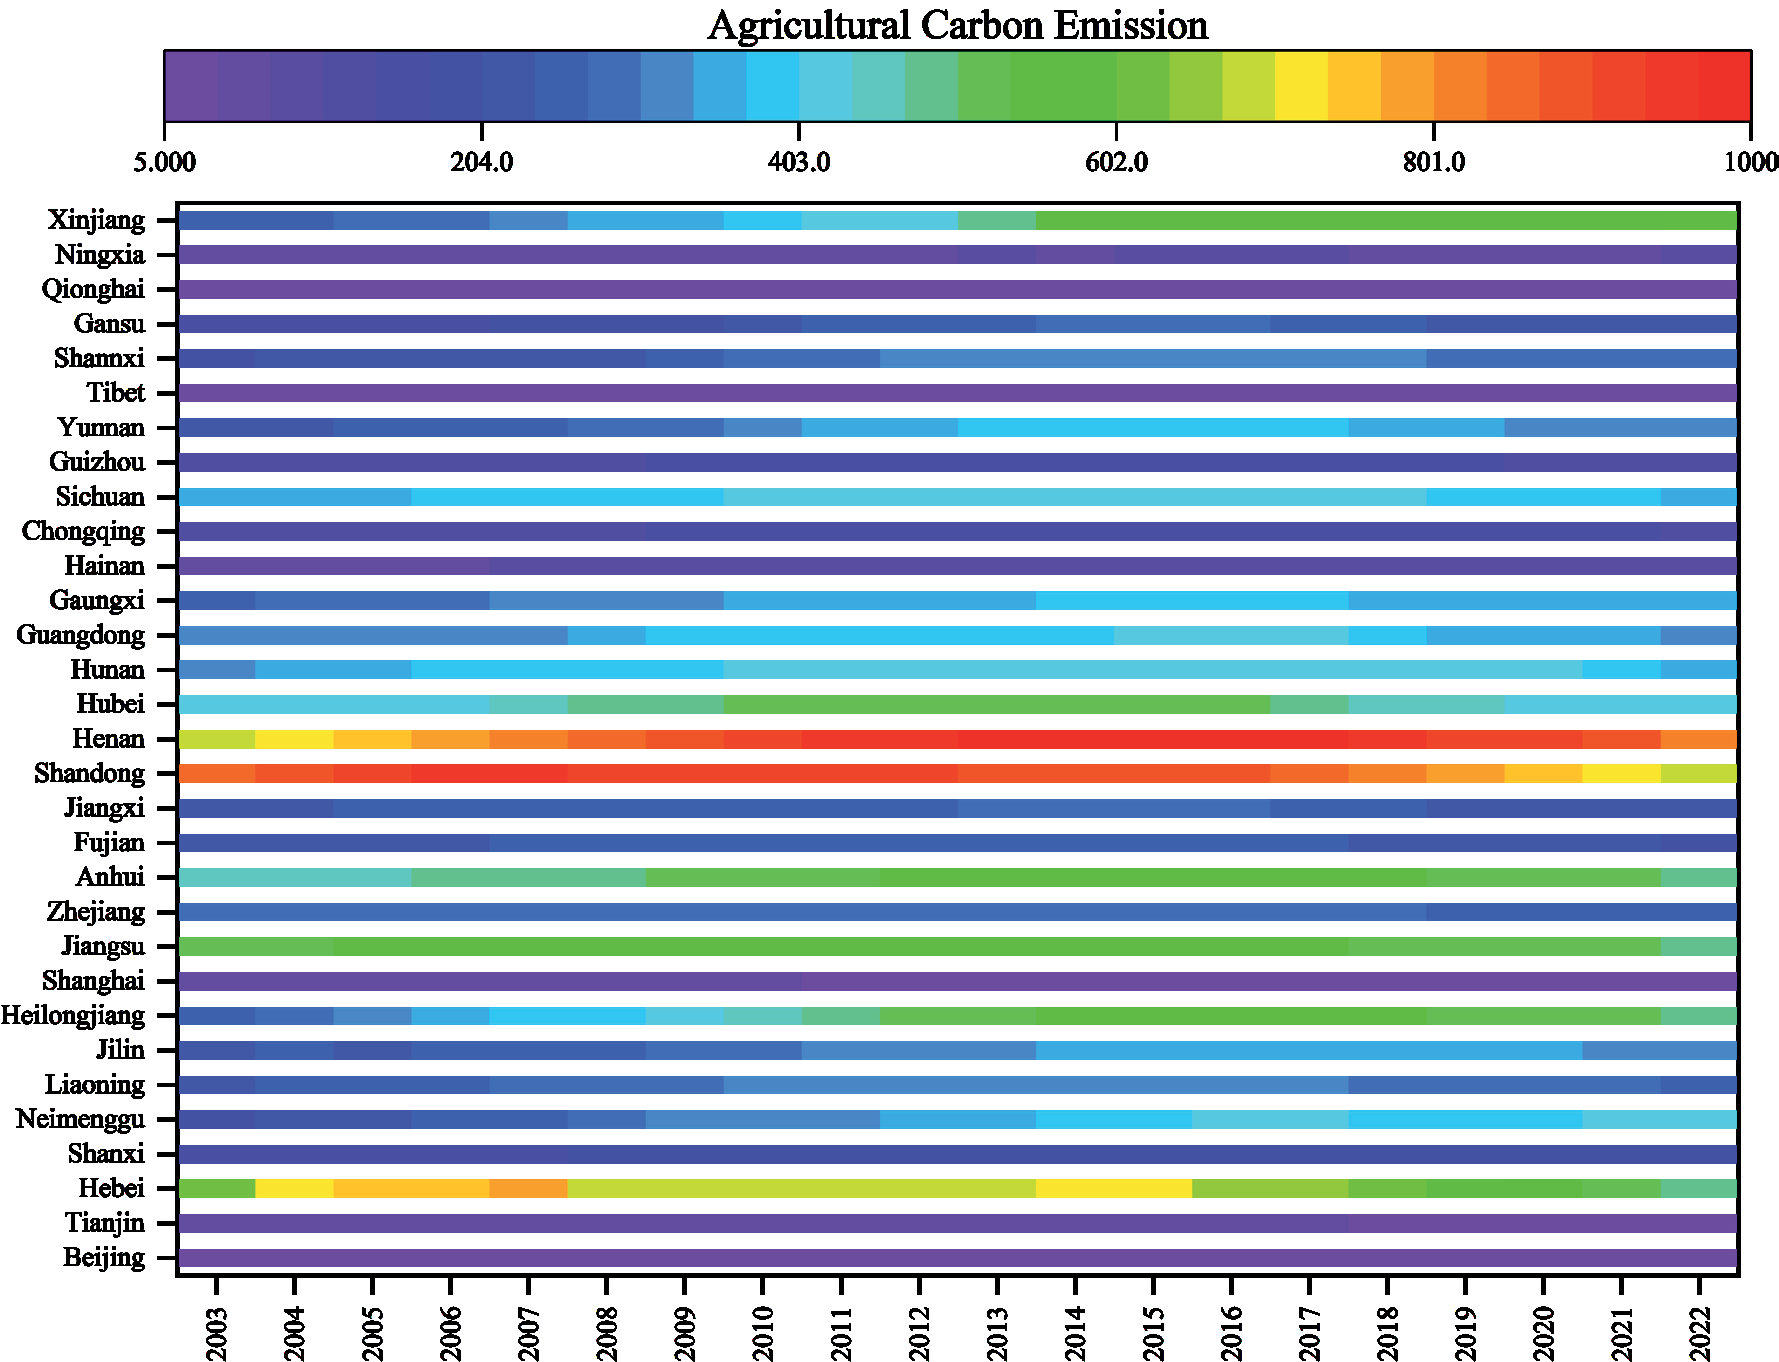
From 2003 to 2022, China’s agricultural carbon emissions exhibited a significant fluctuation trend, reflecting the various stages of agricultural development and the gradual implementation of carbon reduction policies (Fig. 1). Overall, agricultural carbon emissions in most provinces rose steadily between 2003 and 2010, likely due to China’s economic growth, increased rural mechanization, and higher usage of fertilizers and pesticides [20, 21]. During this period, adjustments to the rural economic structure led to the use of more land for crop cultivation, which further contributed to increased agricultural carbon emissions. Additionally, the widespread adoption of agricultural machinery, while improving production efficiency, also resulted in higher energy consumption and carbon emissions.
After 2010, agricultural carbon emissions in some provinces began to stabilize or even decrease. This shift may be closely linked to the implementation of national energy-saving and emission-reduction policies in agriculture, particularly under the guidance of the Comprehensive Energy-Saving and Emission-Reduction Work Plan and the National Agricultural Energy-Saving and Emission-Reduction Implementation Plan. These policies encouraged farmers to adopt more environmentally friendly agricultural technologies. Furthermore, with technological advancements, modern agriculture has gradually transitioned toward precision and smart farming, which has helped reduce energy consumption and carbon emissions in agricultural production.
The marked regional differences in agricultural carbon emissions are largely influenced by factors such as regional economic development levels, land resource allocation, and agricultural industry structure. Data indicate that economically developed provinces in the eastern region, such as Shandong, Henan, and Jiangsu, have higher agricultural carbon emissions. For example, Shandong’s agricultural carbon emissions reached 8.596 million tons in 2003, peaking at 9.857 million tons in 2015, reflecting the high-intensity characteristics of agricultural production in the province. This may be associated with large-scale grain and vegetable cultivation and the extensive use of modern agricultural machinery [22]. In contrast, agricultural carbon emissions are relatively low in western provinces like Tibet and Qinghai. For instance, Tibet’s emissions increased from 81,700 tons in 2003 to 127,300 tons in 2022, a relatively modest rise. The agricultural activities in these regions are smaller in scale and primarily focus on pastoralism and small-scale farming, with terrain and climate constraints limiting large-scale agricultural operations, thus keeping emissions low [23]. However, resource-rich areas like Inner Mongolia and Xinjiang, with vast arable land and higher mechanization levels, also show higher carbon emissions. For instance, Xinjiang’s emissions increased from 2.468 million tons in 2003 to 5.73 million tons in 2022, one of the highest increases nationwide, highlighting the energy consumption and emission pressures associated with large-scale mechanized agriculture in these regions.
Over time, variations in agricultural carbon emissions display significant fluctuations in specific years. For example, during the 2008 global financial crisis, the growth rate of carbon emissions slowed in some provinces, possibly due to rising agricultural input costs and reduced demand for agricultural products, which led to a temporary decline in production activities [24]. Additionally, after 2008, China’s economic development focus shifted, with carbon emissions in some agricultural areas stabilizing or even decreasing.
Another notable year is 2016, when agricultural carbon emissions in several provinces peaked. For instance, Inner Mongolia’s emissions reached 4.064 million tons in 2016. This phenomenon may be linked to intensified agricultural activities and an expanded agricultural product market at that time. Concurrently, the implementation of more robust environmental policies nationwide, especially with the release of the 13th Five-Year Plan for Green Agricultural Development [25], accelerated energy-saving and emission-reduction measures in agriculture, prompting gradual declines in emissions in high-emission regions.
The impact of agricultural carbon emissions on the ecological environment varies significantly across regions. In high-emission areas in the eastern and central regions, agricultural activities are intensive, and production efficiency is high. However, the associated energy consumption and greenhouse gas emissions have a pronounced negative impact on the environment. For instance, the high carbon emission levels in Shandong and Henan over the years pose potential threats to local air quality, water resources, and soil health, thereby affecting ecosystem stability. In contrast, in low-emission regions in the west, although agricultural activities are relatively sparse and ecological pressure is low, the fragile ecosystem means that even slight increases in carbon emissions could have significant impacts. The ecological sensitivity in these regions necessitates stricter environmental protection and resource management measures to prevent cumulative long-term environmental damage from carbon emissions.
Between 2003 and 2022, the sharp increase in agricultural carbon emissions was particularly noticeable between 2003 and 2010. This period’s growth reflects the dual drivers of economic development and investment in agricultural technology. China’s rapid economic growth spurred the modernization of agriculture, with a significant rural-to-urban population [26] shift leading to a gradual transformation from small-scale family farming to intensive, mechanized production. This transition increased the demand for fertilizers, pesticides, and energy. While the extensive use of fertilizers and pesticides boosted crop yields, it also added considerable carbon emissions. The advancement of mechanization improved production efficiency, but also required more fossil fuels, further increasing emissions. This growth is not merely quantitative but also represents a qualitative shift in agricultural production methods. Data show that carbon emissions in provinces like Henan and Shandong rose significantly during this period, reflecting a shift from labor-intensive to capital- and technology-intensive agricultural production.
Differences in agricultural structure across regions have a substantial impact on carbon emissions. Eastern coastal areas such as Shandong, Jiangsu, and Zhejiang primarily focus on high-yield grain crops, while western and northeastern regions have a larger share of pasture and livestock farming. These structural differences lead to significant disparities in carbon emissions. For example, grain crop production requires substantial fertilizer and water inputs, which directly or indirectly result in CO₂ emissions, leading to higher carbon emissions. Conversely, carbon emissions in pastoral and grassland areas primarily stem from methane emissions due to livestock digestion and the energy consumption associated with livestock farming.
Additionally, the proportion of cash crops (such as vegetables and fruits) in different regions also influences carbon emissions. Cash crops typically require more intensive management and resource inputs, resulting in relatively higher carbon emissions. For instance, Guangdong and Fujian cultivate a significant amount of cash crops, and while their emissions are not as high as those in northern provinces, they are on the rise. This increase reflects a shift in agricultural carbon emissions structure due to diversified agricultural demand driven by economic development and higher living standards.
From an ecological perspective, high-carbon-emission regions place significant pressure on ecosystem resilience. High levels of agricultural carbon emissions in eastern and central regions, such as Henan, Shandong, and Jiangsu, exacerbate the vulnerability of ecosystems already heavily impacted by human activities. Increased carbon emissions challenge the carrying capacity of local ecosystems, further undermining their stability. As agricultural carbon emissions rise, risks to air, water, and soil quality intensify, posing threats not only to the ecological environment but also to the sustainability of agricultural production.
In contrast, western regions and some ecologically fragile areas maintain relatively low agricultural carbon emissions, creating a dynamic balance with their fragile ecosystems. These areas are often sparsely populated and rely on traditional farming practices, keeping carbon emissions low. However, as modernized agriculture gradually expands, carbon emissions in these ecologically sensitive western areas are also beginning to rise, revealing potential environmental risks. The carrying capacity of ecosystems in high-carbon-emission regions warrants close attention. In densely farmed areas in the east and central regions, a critical question is how to promote agricultural development without disrupting ecological balance.
Certain years show notable fluctuations in carbon emissions, such as 2008 and 2016. The impact of the 2008 global financial crisis partially affected agricultural activities, with lower market demand and fluctuations in agricultural product prices leading to reduced inputs and slower carbon emission growth in some regions. In 2016, agricultural carbon emissions peaked in several provinces, possibly driven by higher market demand for high-yield crops and improved climate conditions. Rising crop prices led to increased production, accompanied by higher fertilizer and pesticide use, resulting in significant increases in carbon emissions.
Government policies and natural climate variations also play important roles in carbon emission fluctuations. After 2016, stricter environmental policies, such as the Blue Sky Protection Campaign, led to greater attention to green practices in agriculture. Additionally, extreme weather events and climate variability influenced agricultural production. Climate changes that cause yield increases or decreases in specific regions affect agricultural inputs and carbon emissions.
In recent decades, China’s agriculture has gradually shifted toward modernization, intensification, and large-scale production. This transformation has increased production efficiency but also added to carbon emissions. Traditional smallholder farming, relying on manual and animal labor, had low fossil fuel demands and, thus, low carbon emissions. In contrast, modern agriculture, with extensive mechanization and chemical inputs (such as fertilizers and pesticides), has significantly increased yields but has also introduced substantial carbon emissions. The ongoing development of intensive agriculture may create a “carbon lock-in” effect, where reliance on chemical inputs and mechanization makes it increasingly difficult to reduce emissions. For example, Henan’s recent transition in agricultural production modes has placed it among the highest emitters nationwide, reflecting the carbon cost of intensive production. While this model has temporarily boosted agricultural output to meet food demand, it poses long-term challenges to ecological sustainability. The rise in modern agricultural carbon emissions highlights the urgent issue of balancing yield with carbon reduction to achieve sustainable, green agricultural development.
Decoupling Relationship Between Agricultural Carbon Emissions and Agricultural Economy
Fig. 2 reveals that the decoupling relationships in various provinces and cities from 2003-2007, 2007-2012, 2012-2017, 2017-2022, and 2003-2022 exhibit diverse characteristics. Overall, “strong decoupling” and “weak decoupling” appear in most provinces across different periods, indicating that these regions have, at various stages, achieved a relative decoupling of agricultural carbon emissions from economic growth. For instance, Tianjin consistently displayed a strong decoupling relationship throughout all periods, suggesting that it effectively controlled agricultural carbon emissions while developing its agricultural economy. On the other hand, “recessive decoupling” and “expansive coupling” occurred less frequently, primarily in certain regions and specific years. For example, Beijing showed a recessive decoupling relationship between 2012- 2017 and 2017-2022, possibly reflecting a slowing in agricultural economic growth accompanied by a decrease in agricultural carbon emissions.
Beijing exhibited strong decoupling during 2003- 2007, 2007-2012, and 2003-2022, demonstrating effective long-term decoupling of agricultural carbon emissions from economic growth. However, from 2012 to 2022, Beijing’s decoupling relationship shifted to recessive decoupling, suggesting that its agricultural economic growth slowed or even declined, accompanied by a reduction in carbon emissions. Similarly, Tianjin showed strong decoupling across all periods, indicating that it achieved an ideal decoupling effect through effective carbon reduction measures alongside agricultural economic growth. This stable, strong decoupling implies that Tianjin has been successful in controlling carbon emissions in its agricultural sector. Hebei also demonstrated strong decoupling in most periods, particularly during 2007-2012 and 2012-2017, with indices of -0.178 and -1.124, respectively, highlighting its significant carbon emissions control during agricultural economic growth. Shanghai’s decoupling status varied, with strong and negative decoupling periods, reflecting volatility in its carbon emission control. For example, from 2017 to 2022, Shanghai showed an extremely strong negative decoupling (-19.979), indicating a sharp decline in both its agricultural economy and carbon emissions. Jiangsu demonstrated diverse decoupling relationships, mainly strong and weak decoupling, indicating gradual control over carbon emissions during agricultural economic growth, although decoupling weakened during certain periods, such as 2007-2012. Zhejiang also showed variable decoupling types, with weak decoupling from 2003-2007 and 2007-2012 and strong and negative decoupling from 2012-2022, highlighting the challenges of balancing agricultural economic growth with carbon emissions.
In some regions, such as Beijing and Tibet, specific periods displayed “recessive decoupling” or “expansive coupling,” reflecting an unstable relationship between the agricultural economy and carbon emissions. Recessive decoupling usually occurs when agricultural economic activities decline. For example, Beijing showed recessive decoupling from 2012-2017 and 2017-2022, likely due to accelerated urbanization and reduced agricultural land, which led to a contraction in the agricultural economy and a simultaneous decrease in carbon emissions. Expansive coupling indicates synchronous growth in both the agricultural economy and carbon emissions, often seen in resource-rich or agriculturally expanding areas. For instance, Inner Mongolia showed expansive coupling during 2012- 2017, likely due to an increase in agricultural activities, resulting in rising carbon emissions.
In long-term data from 2003 to 2022, most regions achieved weak or strong decoupling, such as Tianjin, Hebei, Shandong, and Hubei, indicating effective control over carbon emissions as agricultural economies grew. This suggests a balance between economic growth and environmental protection in these regions. However, some regions, such as Shanghai and Zhejiang, exhibited long-term negative decoupling, indicating that their agricultural economies grew slowly or even declined, while carbon emission reductions failed to keep pace with economic changes, leading to unstable decoupling relationships.
Overall, decoupling types in the eastern and central regions were relatively stable, with most regions achieving strong or weak decoupling, largely due to investments in energy-saving technologies and supportive policies. In contrast, decoupling types in some western and northeastern regions were more variable. For example, Inner Mongolia experienced expansive coupling, while Tibet showed recessive decoupling, reflecting the volatility of agricultural economic development in these areas, likely influenced by factors such as natural resources, policies, and market demand.
In economically advanced regions like Beijing-Tianjin-Hebei and the Yangtze River Delta, multiple provinces achieved strong or weak decoupling in different periods. For instance, Tianjin consistently displayed strong decoupling, indicating effective control over carbon emissions amid agricultural economic growth. This decoupling relationship largely stems from technological advancements and shifts in production models [27]. Economically developed regions like Beijing-Tianjin-Hebei have transitioned towards intensive, efficient agricultural models, achieving growth in agricultural output alongside reductions in carbon emissions through measures like improving land-use efficiency, reducing fertilizer and pesticide use, and promoting energy-saving technologies in agriculture.
The achievement of strong decoupling may also be linked to economic structure optimization. In these regions, agriculture’s share within the overall economic structure has gradually declined, resulting in controlled total agricultural carbon emissions. Thus, strong decoupling reflects not only the optimization of agricultural production but also the diminishing role of traditional agriculture in the broader economy, reducing the carbon burden of economic growth and promoting a more sustainable agricultural structure. In parts of the Yangtze River Delta, such as Shanghai, Zhejiang, and Fujian, some periods displayed negative and strong negative decoupling. For instance, Shanghai showed strong negative decoupling from 2003-2007 and 2007-2012, suggesting that while the agricultural economy grew, carbon emissions did not decrease at a comparable rate. Possible reasons include: (1) Resource Efficiency Issues [28]. In these regions, agricultural production still relies heavily on chemical inputs such as fertilizers and pesticides, meaning carbon emissions reductions lag behind economic growth. Although this input-intensive growth model promotes agricultural economic growth, it also incurs resource consumption and increased carbon emissions. (2) Environmental Carrying Capacity Challenges. The phenomenon of strong negative decoupling reflects increasing ecological pressures in these regions. For example, coastal regions like Shanghai face limited agricultural land, where high-intensity agricultural production exacerbates the tension between carbon emissions and environmental carrying capacity. Negative decoupling highlights environmental challenges in these regions, suggesting that economic growth may be achieved at the cost of ecological stability.
In resource-rich regions such as Inner Mongolia and Tibet, decoupling types like expansive coupling and recessive decoupling were observed. For instance, Inner Mongolia displayed expansive coupling from 2012 to 2017, indicating synchronous growth in the agricultural economy and carbon emissions. Tibet showed recessive decoupling from 2017 to 2022, indicating a decline in both the agricultural economy and carbon emissions. Further analysis reveals that expansive coupling is closely associated with the development of agricultural resources in these areas. Agricultural expansion in Inner Mongolia, characterized by extensive land cultivation and increased machinery use, has driven agricultural economic growth. However, this extensive growth also led to simultaneous increases in carbon emissions, reflecting the carbon-intensive nature of resource-dependent agriculture. Although agricultural economic growth is significant, the rapid rise in carbon emissions places pressure on the ecological environment. In contrast, Tibet’s recessive decoupling reflects a shift in its economic growth model, with a gradual transition from agriculture to service industries leading to reduced agricultural carbon emissions. This decoupling type indicates a gradual reduction in agricultural activities in resource-limited, structurally homogenous regions, resulting from economic restructuring rather than active carbon reduction measures.
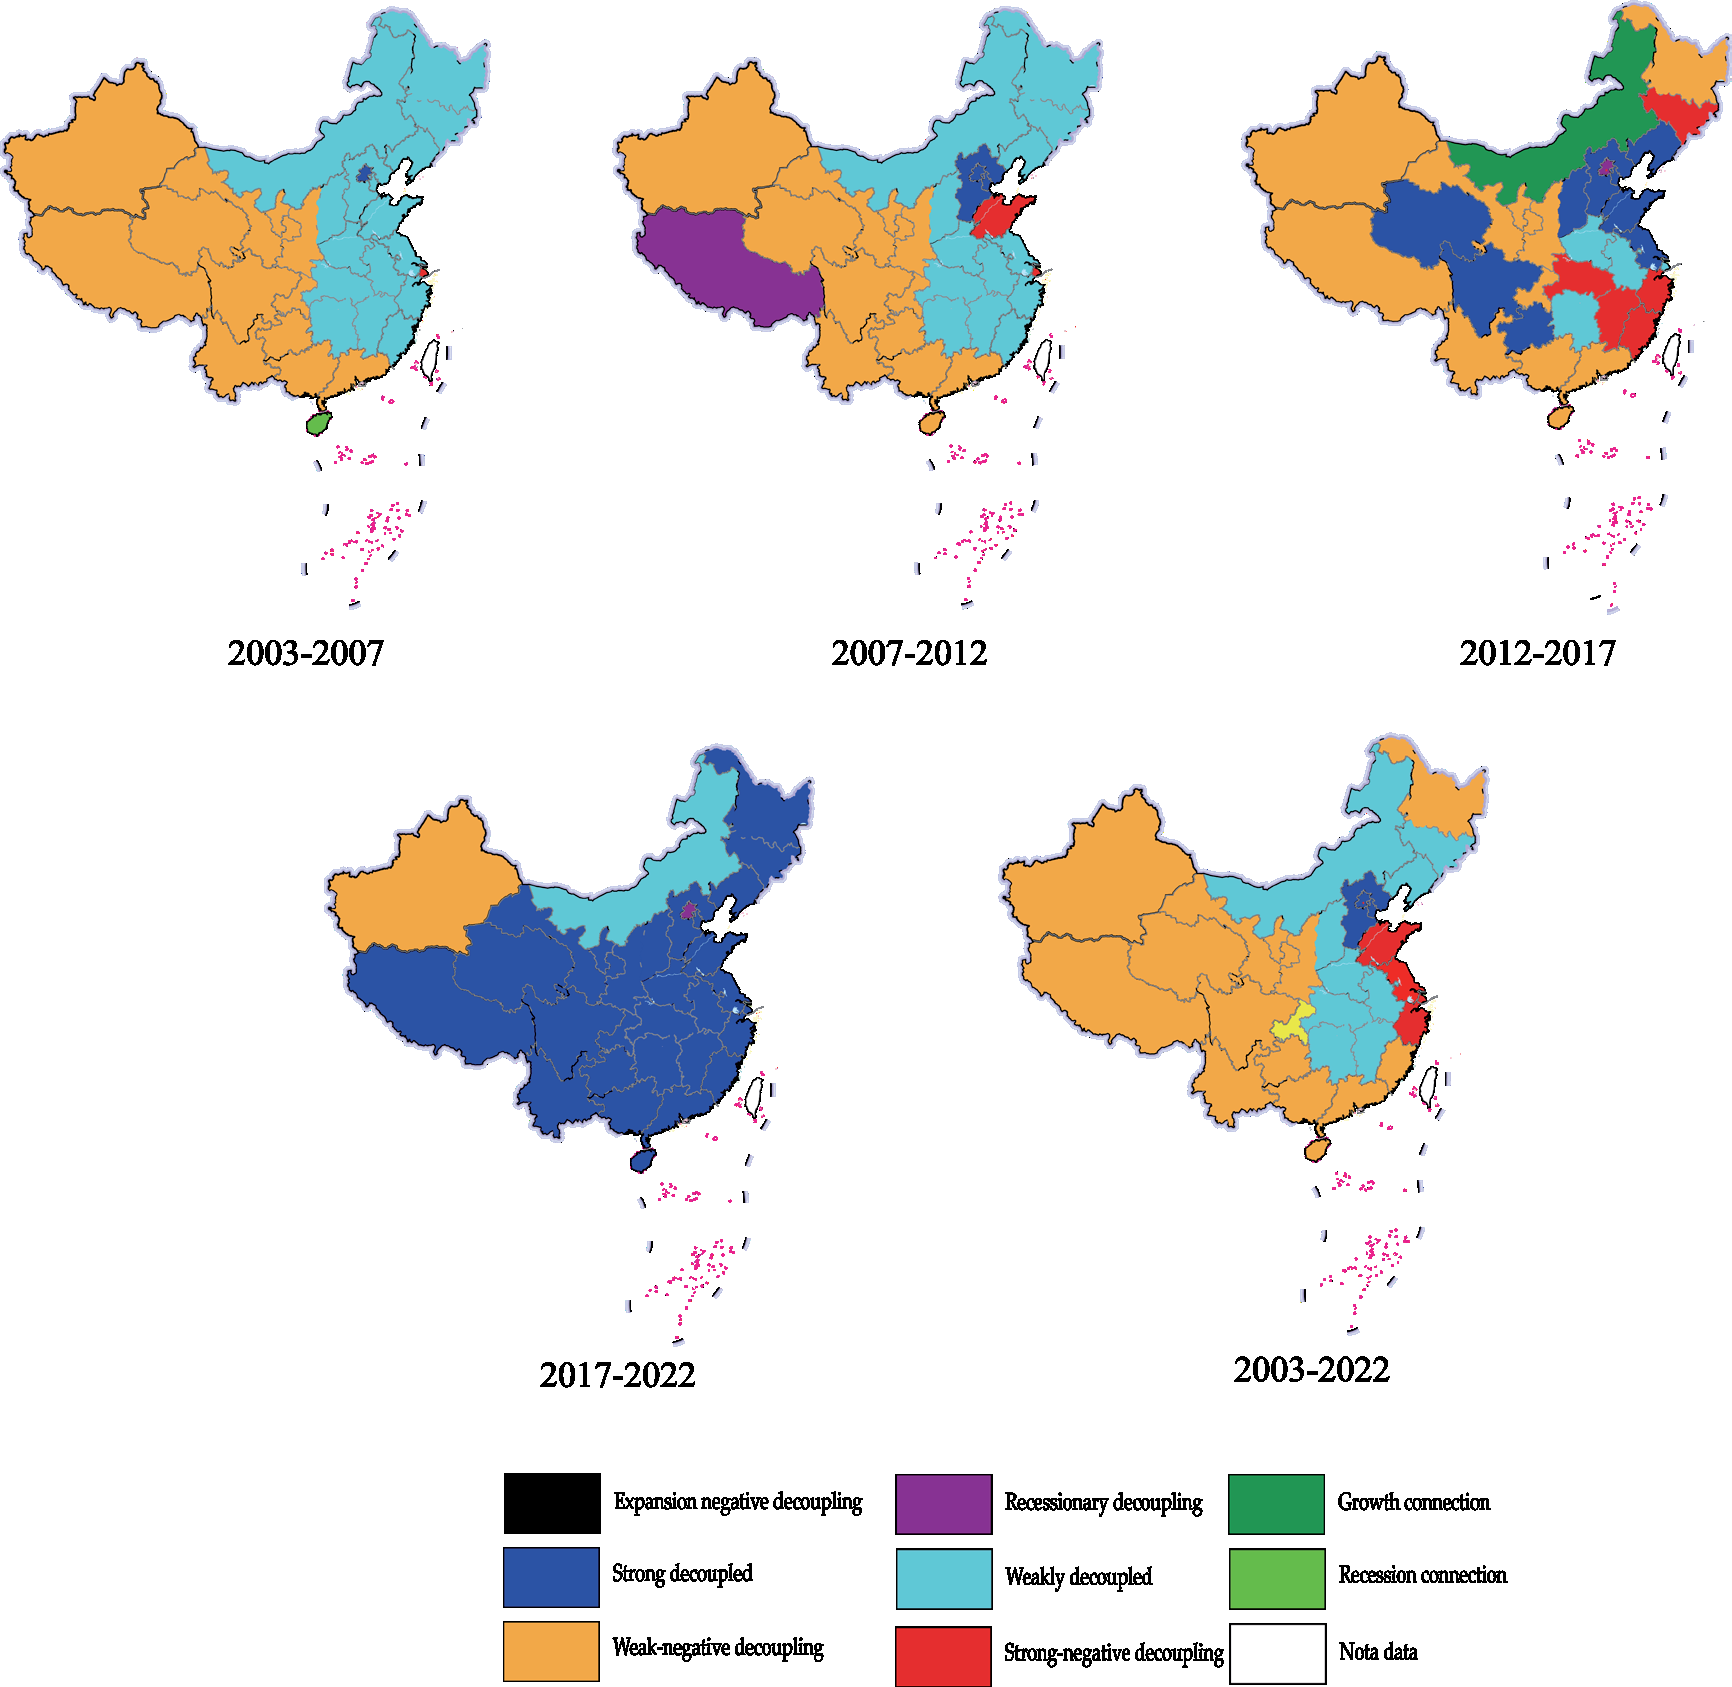
The data show that various provinces exhibited strong and weak decoupling relationships at different stages, closely related to agricultural policies in each phase. Since the 12th Five-Year Plan, China has significantly prioritized agricultural carbon reduction, with regions gradually promoting energy-saving technologies, facilitating the decoupling of agricultural carbon emissions from economic growth. In the Beijing-Tianjin-Hebei region, the achievement of strong decoupling is closely linked to local energy-saving policies. Through reductions in fertilizers and pesticides and the promotion of clean and renewable energy applications, agricultural carbon emissions were effectively controlled. Policy-driven decoupling reflects the growing impact of green policies as China modernizes its agriculture, promoting a balance between agricultural economic growth and ecological sustainability.
However, policy impacts were less pronounced in some resource-rich regions. For example, Inner Mongolia and Xinjiang displayed expansive coupling in certain periods, likely because these regions prioritized economic benefits in agricultural development, with less emphasis on ecological protection and carbon reduction. This decoupling relationship variation reveals differences in policy enforcement and orientation across regions, highlighting disparities in regional policy effectiveness.
In the long term, decoupling types from 2003 to 2022 reveal significant regional differences. Economically developed coastal areas like Beijing-Tianjin-Hebei and the Yangtze River Delta achieved strong and weak decoupling, indicating a path toward sustainable development by reducing environmental pressures while maintaining agricultural output and economic growth. However, in resource-dependent provinces in the central and western regions, the existence of expansive coupling and negative decoupling suggests continued sustainability challenges. Resource-driven growth models yield economic benefits in the short term but also entail higher carbon burdens. Without structural transformation, these regions may struggle to achieve long-term carbon reduction goals in agriculture.
Agricultural Carbon Pressure Index (ACPI)
Safe Zone (ACPI≤0.5)
Throughout all periods, provinces such as Heilongjiang, Qinghai, Tibet, Inner Mongolia, Yunnan, and Guizhou maintained ACPI values below 0.5, indicating minimal environmental pressure from agricultural carbon emissions and classifying them as within the safe zone. These provinces generally have abundant ecological resources and lower agricultural activity intensity, enabling the ecosystem to effectively absorb carbon emissions. For instance, Tibet’s ACPI value remained at an extremely low level, rising only slightly from 0.018 in 2003 to 0.030 in 2022, suggesting that its carbon carrying capacity far exceeds agricultural carbon emissions. Tibet’s agricultural activities are limited, primarily focusing on pasture cultivation, which exerts minimal carbon pressure on the environment. Similarly, Heilongjiang’s ACPI stayed below 0.5, declining from 0.18 in 2003 to around 0.12 in 2022, showing that the province’s carbon absorption capacity remains strong despite relatively intensive agricultural activities. The low ACPI values in these safe zone provinces highlight their ecosystems’ robust carbon absorption capabilities, indicating that agricultural activities exert minimal negative impacts on the environment.
Low-Risk Zone (0.51≤ACPI≤0.61)
In low-risk zones, a certain balance exists between agricultural carbon emissions and the ecosystem’s carbon absorption capacity, though environmental pressure is gradually increasing. Representative provinces in the low-risk zone include Henan, Hubei, and Liaoning. These areas have relatively high agricultural carbon emissions, but the ecosystem’s carbon absorption capacity remains adequate. For example, Henan’s ACPI decreased from 0.58 in 2003 to around 0.51 in 2022, indicating high agricultural activity levels yet an ecosystem capable of absorbing the carbon emissions. Hubei’s ACPI increased from 0.43 in 2003 to 0.52 in 2022, showing that agricultural carbon emissions are gradually increasing and exerting more pressure on the environment, though it remains in the low-risk zone. Provinces in the low-risk zone need to monitor agricultural carbon emissions closely to avoid crossing into moderate or high-risk levels.
Moderate-Risk Zone (0.62≤ACPI≤0.65)
In provinces such as Anhui, Hebei, and Shanxi, ACPI values occasionally range between 0.62 and 0.65, placing them in the moderate-risk zone. These regions have high agricultural carbon emissions that are starting to surpass the ecosystem’s carbon absorption capacity, posing a certain threat to the environment. For instance, Shanxi’s ACPI rose from 0.58 in 2003 to around 0.66 in 2012, entering the moderate-risk zone, indicating that carbon emissions from agricultural activities are nearing the ecosystem’s carrying capacity. Similarly, Anhui’s ACPI reached around 0.65 in 2017 and 2022, signaling that its agricultural carbon emissions pose a moderate risk to the environment, warranting measures to avoid escalating risks. Provinces in the moderate-risk zone should closely monitor agricultural carbon emissions to prevent prolonged environmental stress.
Agricultural carbon emissions in these areas have approached or even exceeded the ecosystem’s absorption capacity, exerting significant pressure on the environment. This moderate-risk status reflects a “borderline balance” between agricultural inputs and ecological carrying capacity, characterized by: (1) Increased agricultural inputs. These provinces are often major grain producers with high fertilizer, pesticide, and irrigation use, raising agricultural output but also carbon emissions, pushing ACPI values closer to high-risk thresholds; (2) Ecosystem fragility [29]. Compared to safe zones, moderate-risk areas have higher environmental vulnerability with limited forest cover and carbon absorption capacity. Thus, the balance between agricultural carbon emissions and ecosystem capacity is precarious. Should emissions rise further, this balance may collapse, rapidly elevating environmental risk. Moderate-risk zones reveal the inherent conflict between high-input agricultural practices and fragile ecosystems, where any imbalance could quickly intensify environmental risks.
High-Risk Zone (0.66≤ACPI≤0.7)
Provinces in the high-risk zone, including Shandong, Zhejiang, and Guangdong, have ACPI values nearing or exceeding 0.7, indicating significant environmental pressure from agricultural carbon emissions. For example, Shandong’s ACPI rose from 0.65 in 2003 to around 0.72 in 2012, highlighting the high environmental pressure from intensive agricultural activities. Shandong, a major agricultural province, has intensive agricultural activity, and its ecosystem’s carbon absorption capacity is nearing its limit. Zhejiang’s ACPI remained around 0.76 after 2007, even approaching 0.80 in 2022, indicating a pronounced negative impact from agricultural carbon emissions. This may be due to Zhejiang’s focus on cash crop cultivation, which involves high levels of fertilizers and energy inputs. Provinces in the high-risk zone should implement active emission-reduction measures and optimize agricultural production structures to alleviate carbon pressure on the ecosystem.
Analyzing these high-risk zones reveals cumulative effects between resource-intensive agricultural practices and environmental stress: (1) High carbon emissions from cash crops [30]. Regions with large-scale cash crop production, such as vegetables, fruits, and flowers, require significant fertilizer, pesticide, and irrigation inputs, resulting in substantial carbon emissions. For instance, Zhejiang’s cash crop production model has kept its ACPI value above 0.76 for several years, generating high economic returns but also placing considerable carbon pressure on the environment; (2) Cumulative resource use pressure [31]. In these areas, intensive land and water resource use has gradually depleted soil organic matter, weakening the soil’s carbon absorption capacity. Furthermore, the sustained intensity of resource use has gradually accumulated carbon loads on the ecosystem, making carbon emissions less manageable. High-risk zones fundamentally reflect an imbalance between economic returns from resource-intensive agriculture and environmental costs. As ecosystems’ carbon absorption capacity diminishes, ecological risks in these areas continue to accumulate, increasing the potential for environmental degradation.
Extreme-Risk Zone (ACPI>0.7)
In extreme-risk zones, regions like Shanghai, Beijing, and Tianjin have consistently maintained ACPI values above 0.9, sometimes approaching 1, indicating that agricultural carbon emissions significantly exceed the ecosystem’s carbon absorption capacity, posing serious environmental risks. For instance, Shanghai’s ACPI has remained above 0.97 since 2003, suggesting that agricultural carbon emissions far surpass the ecosystem’s carrying capacity, leaving the ecosystem unable to absorb emissions effectively. As an urban agriculture area, Shanghai has limited agricultural activities, yet the ecosystem’s weak carbon absorption capacity means agricultural emissions exert considerable environmental pressure. Similarly, Beijing and Tianjin have maintained ACPI values above 0.9, reflecting substantial carbon pressures on their ecosystems. These areas, focusing on facility-based and high-density agriculture, exhibit relatively high carbon emissions despite limited agricultural land. Extreme-risk provinces urgently need to enhance their ecosystems’ carbon absorption capacity through technological advancements while promoting low-carbon agricultural techniques to mitigate environmental pressure.
This extreme risk highlights a contradiction between urban agricultural models and ecosystem saturation: (1) High-density carbon emissions in urban agriculture [32]. In these areas, agriculture mainly involves facility and horticultural farming, such as greenhouse crops and ornamental plants, where carbon emission density is extremely high despite limited scale. Urban environments inherently have limited carbon sinks, leading to ACPI values approaching 1, pushing the ecosystem’s carrying capacity to its limit; (2) Uncontrolled saturation risks in ecosystems. Due to urbanization, natural carbon sinks such as forests and wetlands in Shanghai and Beijing have shrunk, saturating the ecosystem’s carbon absorption capacity. Further increases in agricultural carbon emissions could destabilize the urban ecological environment, exacerbating issues such as declining air quality and water eutrophication. Extreme-risk zones fundamentally reflect an imbalance between ecosystem fragility and high-density agricultural emissions. Without substantial emission reductions or agricultural model changes, carbon pressure will continue to cause irreversible environmental damage.
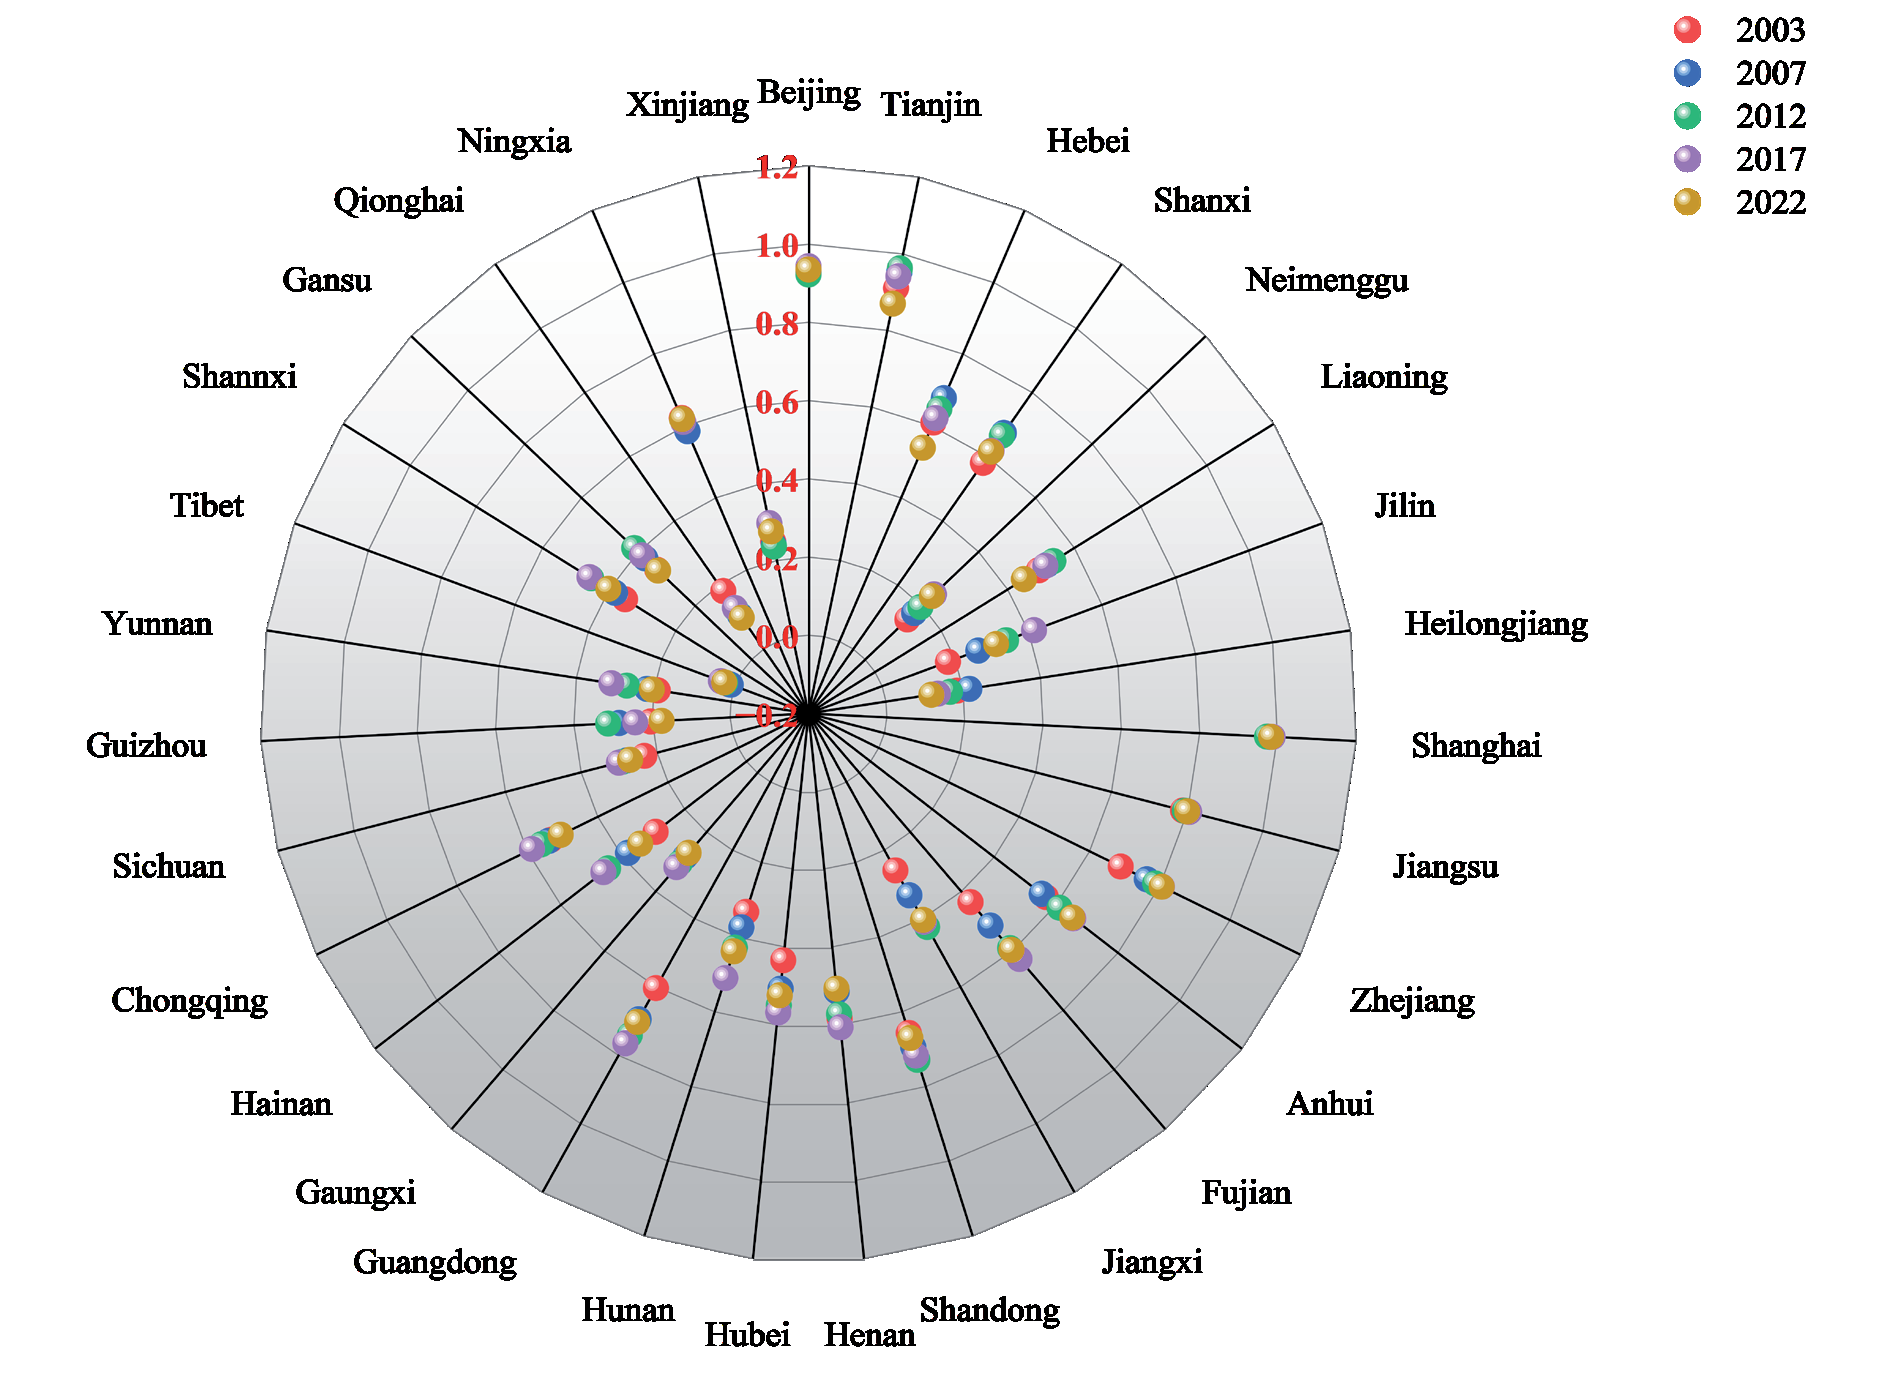
Through a regional analysis of the Agricultural Carbon Pressure Index (ACPI), it is clear that ACPI values across different regions reveal not only the superficial relationship between carbon emissions and absorption but also structural differences in agricultural development models, resource utilization, and ecological carrying capacities in China. The phenomena observed in high- and extreme-risk zones deserve particular attention, as agricultural carbon emissions in these areas have surpassed sustainable development thresholds (Fig. 3).
Theil Index
Intra-Regional Disparities
In the eastern region, the intra-regional Theil index was 2.42 in 2003 and rose slightly between 2007 and 2022, remaining stable between 2.42 and 2.44. This suggests that differences in agricultural carbon pressure within the eastern region have been stable. The eastern region is economically advanced, with a diverse array of agricultural production models, ranging from high-density facility farming to extensive agriculture, resulting in relatively high and stable ACPI disparities between provinces.
In the central region, the Theil index rose gradually from 2.08 in 2003 to 2.12 in 2012, and has since remained steady. This slight increase indicates growing differences in agricultural carbon pressure within the central region. The central region is a major grain-producing area with concentrated agricultural activities, yet economic imbalances have prompted certain provinces to pursue high-value cash crops or facility agriculture, contributing to regional disparities in agricultural carbon pressure.
In the western region, the Theil index increased from 2.12 in 2003 to 2.15 in 2017, before slightly declining to 2.12 in 2022. This trend reflects a gradual expansion in agricultural carbon pressure disparities within the western region. While the western region has lower agricultural activity overall, certain resource-rich provinces (e.g., Xinjiang, Inner Mongolia) have expanded agricultural activities, raising carbon emissions and thus widening the contrast with other sparsely populated western provinces.
Intra-regional disparities show that the eastern region has the highest and most stable carbon pressure disparities, while disparities within the central and western regions have gradually increased. This result highlights that, with economic development and structural changes in agriculture, internal agricultural carbon emission patterns are becoming more varied across different regions, with intra-regional differences especially emerging in the central and western areas.
Inter-Regional Disparities
The inter-regional Theil index was 1.00 in 2003, slightly increasing to 1.01 in 2012 and 2017, but generally remaining within the 1.00 to 1.01 range. This stability suggests that disparities in agricultural carbon pressure between the three regions have not changed significantly. Structural differences between the eastern and central-western regions are evident: the eastern region’s carbon pressure index is relatively high due to economic development and diverse production models, while the central and western regions mainly focus on grain production and extensive farming with lower carbon emissions. However, the slow changes in agricultural carbon pressure across regions have kept inter-regional disparities at a relatively low level.
The stability of inter-regional disparities indicates that, despite differences in agricultural carbon pressure indices, the relative positioning of each region has remained unchanged, reflecting a level of regional balance. This balance may benefit from national policy adjustments, such as the promotion of low-carbon agricultural technologies in the central and western regions, which has moderated the increase in carbon emissions in these areas and prevented a significant widening of inter-regional disparities. The stability of inter-regional disparities demonstrates that the eastern, central, and western regions have maintained relatively balanced positions in terms of agricultural carbon emissions, likely due to the combined effect of policy controls and the unique agricultural production characteristics of each region.
Overall Regional Disparities
The overall Theil index increased from 3.22 in 2003 to 3.27 in 2017 before slightly declining to 3.24 in 2022. The rise in overall regional disparities mainly reflects the increase in intra-regional disparities, particularly in the central and western regions, which have seen internal disparities expand in recent years, thus driving up overall disparities. The high disparities within the eastern region, coupled with increasing disparities in the central and western regions, have collectively contributed to the rise in the overall Theil index.
In particular, the central region has experienced a diversification of agricultural production in recent years, increasing the imbalance in agricultural carbon pressure, thus widening internal disparities and raising the overall Theil index. As China’s agricultural modernization progresses, certain provinces are transitioning toward high-value cash crop production, which raises carbon pressure, while others continue to rely on traditional agriculture with relatively low carbon pressure. This uneven transformation has intensified internal disparities, leading to an increase in overall disparities.
The rise in overall regional disparities indicates that, while inter-regional disparities remain stable, intra-regional disparities in carbon pressure are gradually widening. This increase in overall disparities reflects imbalances in agricultural production methods and economic development levels, posing a challenge that future carbon reduction policies will need to address (Table 3).
Global Spatial Autocorrelation Analysis
Based on the global spatial autocorrelation analysis of China’s Agricultural Carbon Pressure Index (ACPI) from 2003 to 2022, significant spatial clustering was observed, although this clustering trend has shown a gradual decline over the years. In 2003, Moran’s I coefficient was 0.4736, indicating a strong positive spatial correlation, meaning neighboring regions tended to have similar levels of agricultural carbon pressure. However, over time, the Moran’s I coefficient gradually decreased, reaching 0.3999 in 2017, showing a noticeable weakening in spatial clustering, with a slight rebound to 0.4051 in 2022. Despite this increase, the 2022 value remains lower than in 2003. This trend suggests a move toward a more balanced distribution of agricultural carbon pressure across regions, with decreasing disparities between different areas.
In terms of statistical significance, the z-values remained above 5 from 2003 to 2022, and p-values were consistently 0.000, significantly below the common significance threshold of 0.05. This indicates that the spatial autocorrelation of the ACPI in each year is statistically significant, meaning that the spatial clustering of agricultural carbon pressure is not random but influenced by a combination of geographical, economic, and policy factors. This significant spatial clustering reflects an uneven spatial distribution of agricultural carbon pressure across China, highlighting unique spatial structures in agricultural development.
Table 3.
The Regional Differences in the Agricultural Carbon Pressure Index (ACPI).
The declining trend in Moran’s I coefficients suggests a gradual reduction in the spatial inequality of China’s agricultural carbon pressure. Several factors likely contribute to this trend. Firstly, policy-driven regional development initiatives have played a crucial role. Since the 11th Five-Year Plan [33], the Chinese government has promoted agricultural modernization, particularly in the central and western regions, with efforts to implement low-carbon agricultural practices and increase local agricultural support [34]. Through investments and policy incentives, the central and western regions have gradually adopted low-carbon agricultural techniques similar to those in the eastern region, thereby narrowing the carbon emissions gap. The national rollout of these low-carbon technologies has reduced regional carbon pressure differences, thereby weakening spatial clustering.
Another key factor is the diffusion of technology and the convergence of agricultural production models [35]. The economically advanced eastern region has led in applying low-carbon agricultural technologies and efficient production methods, and these technologies have gradually spread to the central and western regions, leading to convergence in agricultural production practices across regions. As agricultural production models have become more similar, the regional disparities in agricultural carbon pressure have diminished, further reducing spatial clustering. Additionally, agricultural structural adjustments have influenced spatial clustering. With China’s progress in agricultural modernization, the agricultural structure in the central and western regions has diversified from single-crop cultivation to include cash crops, which not only add more economic value but also reduce carbon pressure on the environment, thereby narrowing the carbon emissions gap with the eastern region.
Although the Moran’s I coefficient generally declined, a slight rebound in spatial clustering occurred in 2022, with the Moran’s I coefficient rising from 0.3999 in 2017 to 0.4051. This modest increase may reflect the emergence of new imbalances. In recent years, rapid economic growth in the eastern coastal regions has driven intensified agricultural activities [36], increasing agricultural carbon emissions and contributing to higher carbon pressure in the eastern region. Meanwhile, although the central and western regions have made progress in adopting low-carbon technologies, constraints such as resources, technology, and talent have limited the effectiveness of emission reduction in certain areas. This has resulted in ongoing disparities in carbon pressure across regions. Furthermore, some resource-rich areas in the central and western regions (e.g., Xinjiang, Neimenggu) have seen rapid agricultural expansion in recent years, particularly in livestock and facility-based farming, leading to rising carbon emissions and a corresponding increase in spatial clustering.
This trend in spatial clustering has important implications for policy formulation. First, further efforts should be made to promote regional balanced development, particularly in high-carbon-pressure areas in the east. Increasing the adoption of low-carbon agricultural technologies can help alleviate carbon pressure in these regions. At the same time, the central and western regions should accelerate the dissemination and application of low-carbon technologies to narrow regional disparities in carbon emissions, ultimately reducing spatial clustering. Second, policymakers should focus on addressing high-carbon agricultural practices in specific regions, especially in high-carbon-pressure areas like Xinjiang and Inner Mongolia, by providing more technical and financial support to limit the expansion of high-carbon agriculture. Lastly, the eastern, central, and western regions should strengthen collaborative efforts, including the sharing of technologies and resources, to jointly promote the development of low-carbon agriculture and facilitate balanced development within and between regions.
Overall, from 2003 to 2022, the spatial clustering of agricultural carbon pressure in China has shown a general downward trend, indicating a gradual narrowing of regional differences in carbon pressure and a move toward a more balanced spatial distribution of agricultural carbon emissions. However, the slight rebound in Moran’s I coefficient in 2022 suggests that carbon pressure may be rising in specific areas, posing a renewed challenge to regional balance. In response, future carbon reduction policies need to be tailored to local conditions, taking into account each area’s agricultural characteristics and ecological capacity to implement more targeted measures. This will help achieve sustainable agricultural economic growth and harmonious environmental protection (Table 4).
Local Spatial Autocorrelation Analysis
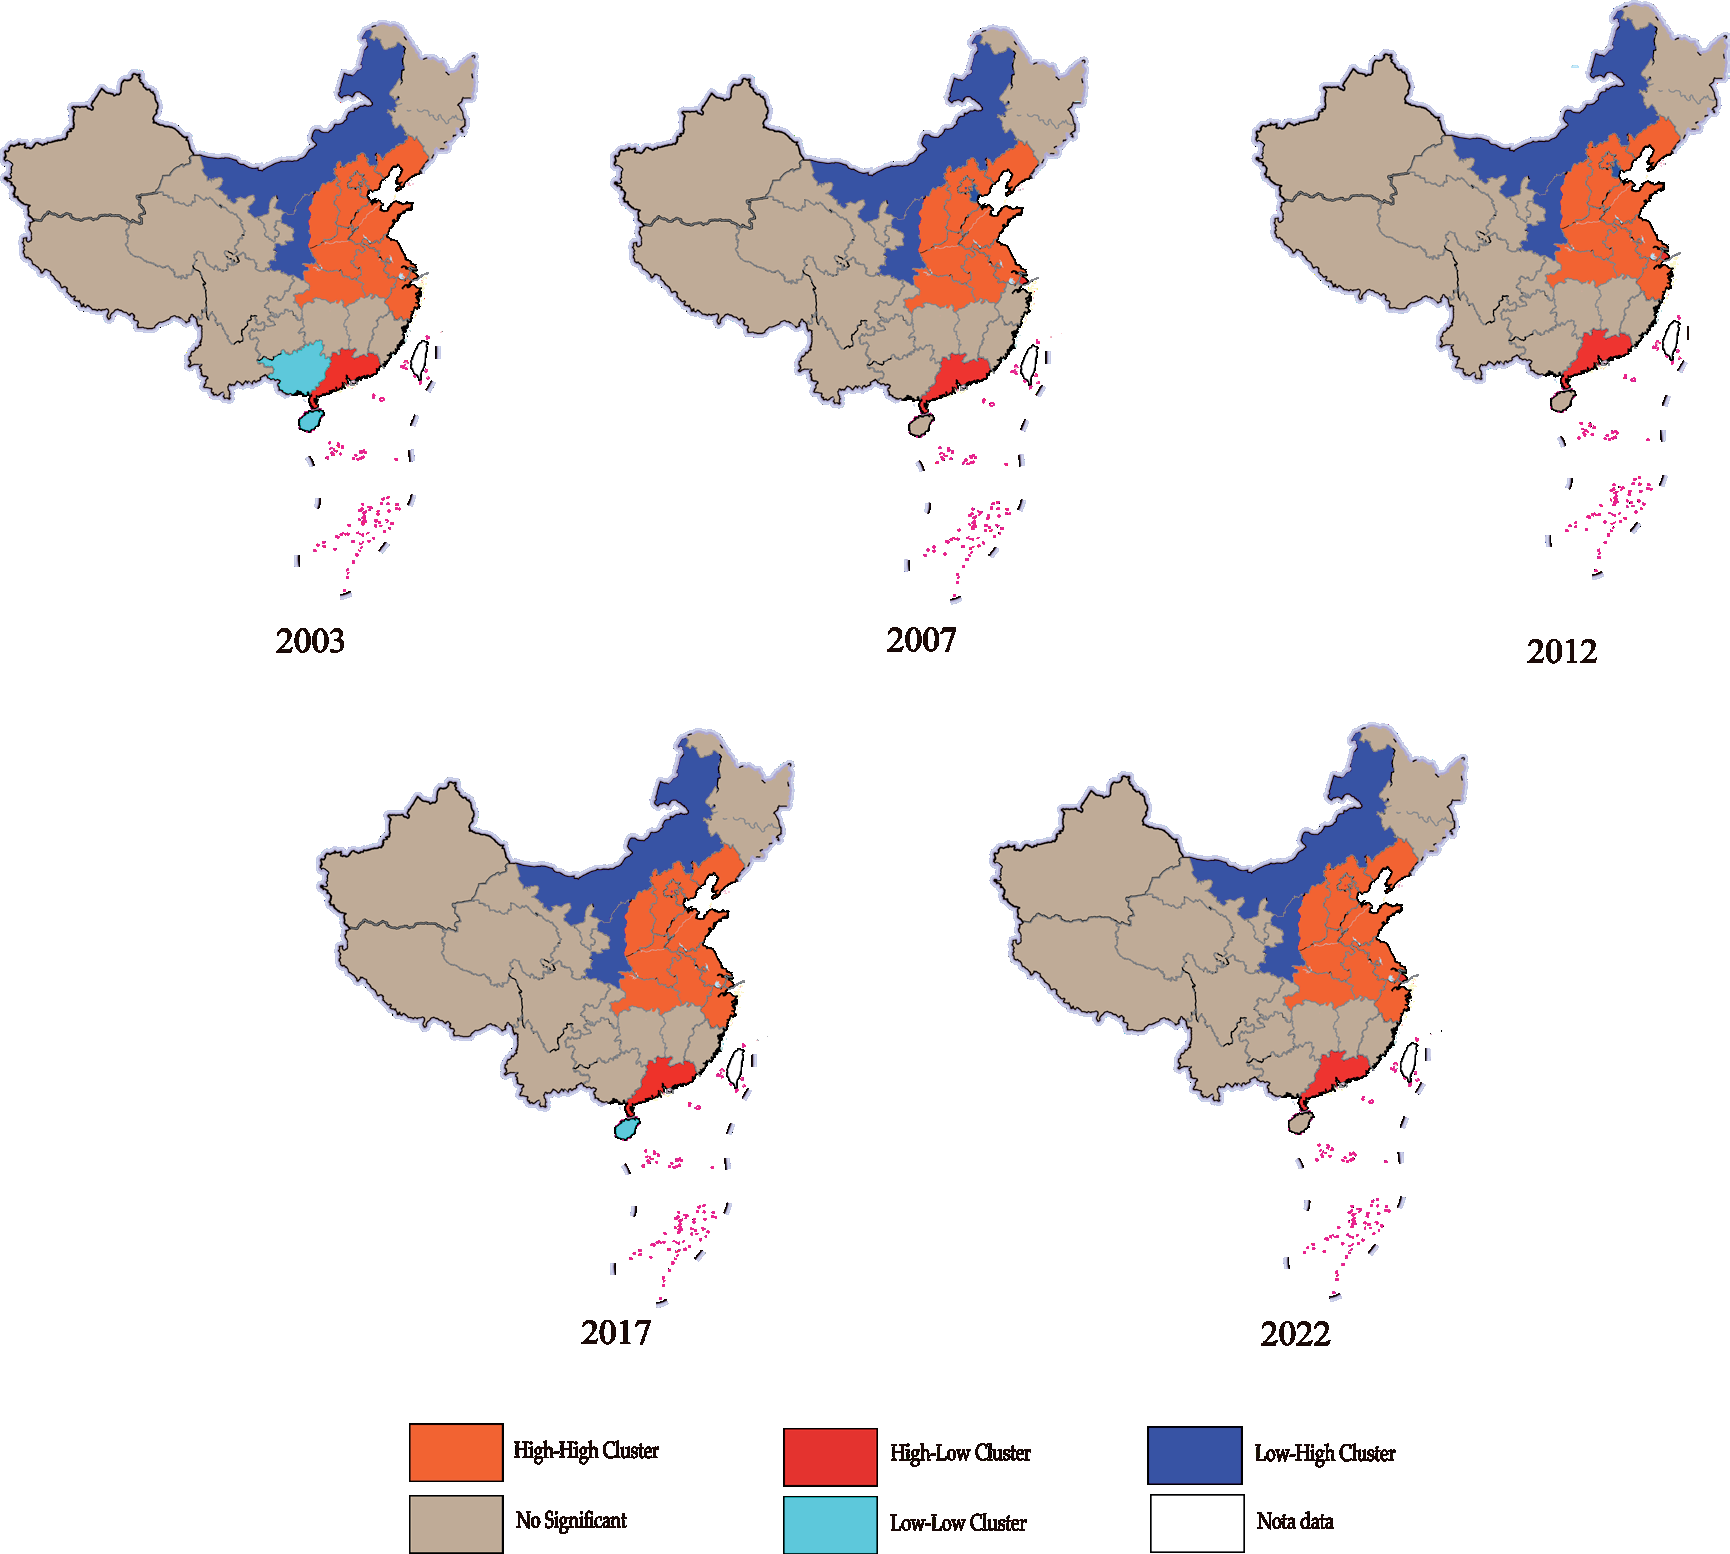
The Local Indicators of Spatial Association (LISA) cluster analysis of China’s Agricultural Carbon Pressure Index (ACPI) from 2003 to 2022 (Fig. 4) reveals distinct regional differences in spatial clustering characteristics. In 2003, the LISA cluster map displayed a “High-High” clustering area along the eastern coast and a “Low-Low” clustering area in the western and northeastern regions. Specifically, eastern coastal provinces such as Shandong, Jiangsu, and Zhejiang formed a high carbon emission cluster, where agricultural activities are intensive, carbon emissions are high, and neighboring provinces share similar characteristics. This pattern indicates a resource-intensive agricultural production model. Meanwhile, areas like Inner Mongolia and Xinjiang in the northeast exhibited a “Low-Low” clustering pattern due to lower agricultural activities and the ecosystem’s substantial carbon absorption capacity. Additionally, Guangdong Province showed a “Low-High” clustering, indicating relatively low carbon pressure locally but in contrast with higher carbon-emitting neighboring provinces like Jiangxi and Fujian, reflecting Guangdong’s success in regional carbon reduction.
Table 4.
Global Spatial Autocorrelation Analysis of ACPI in China.
| Year | Morgan’s I | E(I) | Variance | z | p |
|---|---|---|---|---|---|
| 2003 | 0.4736 | -0.0303 | 0.007 | 6.2024 | 0.000 |
| 2007 | 0.4507 | -0.0303 | 0.007 | 5.9160 | 0.000 |
| 2012 | 0.4205 | -0.0303 | 0.007 | 5.5413 | 0.000 |
| 2017 | 0.3999 | -0.0303 | 0.007 | 5.2892 | 0.000 |
| 2022 | 0.4051 | -0.0303 | 0.007 | 5.3509 | 0.000 |
In 2007, the overall spatial clustering characteristics in the LISA map remained consistent with those in 2003, but the “High-High” clustering zone along the eastern coast expanded. This expansion may be attributed to the intensified agricultural production in the eastern region, leading to increased carbon pressure and reinforcing the high carbon emission clustering effect in provinces like Shandong, Jiangsu, and Zhejiang. Meanwhile, the “Low-Low” clustering in the western and northeastern regions remained stable, indicating the continued ability of these areas’ ecosystems to absorb agricultural carbon emissions effectively. At this time, disparities between eastern and central regions in carbon emissions increased, reflecting divergent agricultural production patterns.
By 2012, the high carbon pressure clustering along the eastern coast persisted, with provinces such as Shandong, Jiangsu, and Zhejiang continuing to exhibit high emissions, indicating that the environmental pressure from agricultural carbon emissions had not significantly eased in these areas. However, the “Low-Low” clustering in the northeast and western regions showed signs of contraction, possibly due to increased carbon pressure from agricultural expansion in some western areas, such as Xinjiang and Inner Mongolia. Overall, the spatial contrast between high carbon pressure clustering in the east and low carbon pressure in the west and northeast remained pronounced, suggesting the persistence of these spatial patterns.
The LISA cluster map in 2017 displayed some new dynamics. The “High-High” clustering along the eastern coast remained prominent, particularly with intensified carbon pressure in Jiangsu, Shandong, and Zhejiang, indicating that agricultural production’s environmental impact was becoming more concentrated in these areas. In the southwest, Yunnan Province began to display a “Low-Low” clustering pattern, suggesting that low-carbon production methods may have reduced the environmental carbon pressure from agricultural activities. Guangdong continued to exhibit a “Low-High” clustering pattern, showing low carbon emissions locally but contrasting with higher carbon pressure in neighboring provinces, highlighting differences in carbon emission patterns among southeastern coastal provinces.
In 2022, the LISA cluster map continued to show a pattern of spatial clustering with some adjustments. The “High-High” clustering along the eastern coast persisted, with no apparent relief in carbon pressure in provinces such as Shandong, Jiangsu, and Zhejiang, indicating ongoing environmental pressure from high-density agricultural practices. Meanwhile, the “Low-Low” clustering in the northeast and western regions remained stable, reflecting the continued strength of these areas’ ecosystems in carbon absorption. However, some western provinces, such as Xinjiang, faced increased carbon pressure from agricultural expansion, which could influence the extent of low-carbon clusters in the future. In this year, Fujian Province exhibited a “High-Low” clustering pattern, with higher carbon emissions locally than its neighboring provinces, showing variance in agricultural production models.
Overall, the LISA cluster map reveals significant spatial clustering of China’s ACPI. The “High-High” clustering in eastern coastal regions underscores the sustained and notable carbon pressure exerted by high-density agricultural production models in these provinces. This spatial clustering reflects the differences in regional agricultural development models, placing higher demands on carbon reduction efforts. In contrast, the “Low-Low” clustering in the western and northeastern regions indicates robust ecological carrying capacity and carbon absorption capabilities, with minimal environmental pressure from agricultural carbon emissions.
In response to this clustering pattern, eastern high-carbon-pressure regions should further promote low-carbon agricultural techniques to reduce carbon emission intensity. In the central and western regions, which are low-carbon areas, ongoing ecological protection should be prioritized to prevent the excessive expansion of high-carbon-emitting agricultural models. Additionally, for “High-Low” or “Low-High” areas, regional cooperation and coordination should be strengthened to encourage the sharing of low-carbon technologies across regions, ultimately achieving balanced carbon emissions in agricultural production.
Policy Recommendations
Based on the analysis of China’s agricultural carbon emissions and carbon pressure index, the following policy recommendations aim to achieve effective control of agricultural carbon emissions, promote balanced regional development, and foster sustainable coordination between agriculture and the ecological environment.
High-carbon-pressure areas in the eastern region (such as Shandong, Jiangsu, and Zhejiang) should focus on promoting low-carbon agricultural technologies and optimizing existing high-emission production models [37]. It is recommended that the government increase financial subsidies and technical support in these areas to encourage the adoption of practices like precision fertilization, water-saving irrigation, and the use of clean energy in agriculture, gradually reducing the intensity of fertilizer and pesticide use. In high-density economic crop planting zones, energy-saving machinery and green pest control technologies should be encouraged to reduce agricultural carbon emissions. Establishing demonstration farms can showcase the practical benefits and economic advantages of low-carbon agriculture to nearby farmers, thus improving the acceptance and application rate of low-carbon techniques.
The eastern region could gradually shift towards ecological and high-value-added agriculture to reduce carbon emissions and environmental stress [38]. This region should explore urban agriculture, facility-based agriculture, and agritourism, utilizing high-tech methods to develop green and organic agriculture, thereby meeting market demand while lowering carbon emissions. High-carbon-pressure provinces can focus on efficient, low-carbon, and ecological agricultural practices to boost the market competitiveness of agricultural products, reducing reliance on resource-intensive production. Furthermore, regions should develop economic crops suited to local conditions, optimizing crop structure to minimize environmental impact from agricultural production.
The central and western regions should prioritize ecological protection while maintaining agricultural production, avoiding the unrestrained expansion of high-emission agricultural models [39]. In areas with rapid agricultural expansion, like Xinjiang and Inner Mongolia, strict land use and environmental protection regulations should be enforced to prevent uncontrolled growth in high-density and facility-based agriculture, ensuring that agricultural development does not exceed the ecological carrying capacity. Additionally, an ecological compensation mechanism can provide incentives to provinces that maintain low carbon emissions and excel in environmental protection, encouraging sustainable agricultural growth while keeping carbon pressure low.
Eastern, central, and western regions should cooperate to create mechanisms for sharing technology and resources. The government can facilitate the transfer of advanced low-carbon agricultural technologies from the eastern to the central and western regions through technical training and low-carbon projects, enhancing agricultural production capabilities and reducing interregional carbon emission disparities. Furthermore, support for introducing advanced planting management practices and agricultural facilities from the eastern region to central and western areas should be provided, enabling cross-regional knowledge sharing and talent exchange. Special attention should be paid to the cost of these technologies to ensure affordability for farmers in the central and western regions, thereby effectively raising low-carbon production levels in these areas.
A nationwide agricultural carbon emission monitoring system should be established to regularly assess the carbon emissions and carbon pressure levels of various regions [40]. Based on regional carbon pressure indices, zonal management should be implemented to set differentiated carbon reduction targets. For example, “High-High” clustering areas in the east should have stricter carbon emission control goals, with corresponding policy support to ensure gradual reductions in emissions. For “Low-Low” clustering areas in the central and western regions, efforts should be made to maintain low carbon emissions and prevent pressure rebounds. Carbon reduction goals can be incorporated into the agricultural development assessment system as part of performance evaluations for agricultural departments and local governments, ensuring steady progress in carbon reduction efforts.
To balance regional carbon pressure, it is recommended to promote an ecological compensation mechanism nationwide, encouraging regions to increase carbon sink construction [41]. For low-pressure, well-preserved ecosystems, such as the “Low-Low” clustering areas in the northeast and west, measures like afforestation, reforestation, and grassland protection should be encouraged to enhance carbon absorption. Through financial subsidies or tax incentives, the government can support ecological projects in these areas, boosting carbon sink capacity as a supplement for regions with higher carbon emissions. Additionally, eastern regions under greater carbon pressure can purchase carbon credits from western regions, achieving a national carbon balance.
To ensure the effective implementation of low-carbon agricultural policies, it is crucial to raise environmental awareness among agricultural producers and rural communities. The government can promote the importance of low-carbon production and its environmental benefits through public campaigns, training, and education. By organizing training sessions and distributing informational materials, farmers’ understanding of low-carbon agricultural technologies can be enhanced, encouraging active participation in carbon reduction and environmental protection. Additionally, agricultural enterprises should be guided to fulfill environmental responsibilities by integrating carbon reduction goals into their business objectives, thereby advancing the green transition of agricultural production.
The government should boost research and development (R&D) funding to support institutions and agricultural enterprises in developing low-carbon agricultural technologies and equipment tailored to different regions. Particularly in high-carbon clustering areas, emphasis should be placed on researching locally applicable carbon reduction techniques, such as energy-efficient irrigation, greenhouse gas capture, and renewable energy utilization. Encouraging innovation in carbon reduction technologies for agricultural machinery, pesticides, and fertilizers can help lower emissions in agricultural production. Establishing dedicated funds for low-carbon agriculture projects and fostering collaborations between research institutions, universities, and enterprises can accelerate the development and dissemination of R&D outcomes, providing technological support for sustainable agricultural development.
The above policy recommendations are tailored to the characteristics of China’s agricultural carbon emissions and carbon pressure index, proposing region-specific strategies based on varying levels of carbon pressure. Through the promotion of low-carbon technologies, regional agricultural optimization, strengthened ecological protection, technology sharing, and innovation in research, these policies can effectively reduce agricultural carbon emissions and facilitate harmonious development between agriculture and the environment. These strategies will contribute to mitigating the environmental pressure of agricultural production and advancing the goals of green and sustainable agriculture nationwide.
Conclusions
This study successfully achieved its goal of assessing the carbon pressure exerted by agricultural development on ecological sustainability in China. Through the introduction of the Agricultural Carbon Pressure Index (ACPI), the research provides a more comprehensive evaluation by integrating agricultural carbon emissions and the ecosystem’s carbon sequestration capacity. The application of the Tapio decoupling model reveals diverse decoupling relationships across regions, with most provinces achieving weak or strong decoupling. Spatial autocorrelation analysis indicates that regional disparities in agricultural carbon pressure have gradually narrowed over time, influenced by technological diffusion and policy measures.
The findings confirm the study’s objectives by offering a thorough understanding of the spatial and temporal characteristics of agricultural carbon pressure. The study highlights the necessity for region-specific low-carbon policies, enhanced technological adoption, and interregional cooperation to achieve sustainable agricultural development. Future research could further explore the socioeconomic and policy factors influencing agricultural carbon emissions and propose more targeted mitigation strategies.
In conclusion, the study contributes valuable insights for policymakers and stakeholders, reinforcing the importance of tailored interventions to balance agricultural productivity and ecological sustainability.

