

Introduction
Land is the space carrier and basic element of human activities. In recent decades, as increasingly intensive land use activities have greatly changed the earth system process and endangered the survival of urban and rural residents and the sustainable development of the social economy [1-3], land use cover change (LUCC) has become an important topic of global change research. As an important approach and perspective of LUCC research, LUTs have attracted increasing attention since the turn of the new millennium [1, 4-9]. LUTs usually refer to changes in regional land use patterns in a certain period, along with socio-economic shifts and innovation drives, including changes in land use quantity, structure, patterns, and other explicit forms and land use quality, property rights, functions, and other invisible aspects [10].
LUT research originated from forest transition research in the late 1980s and early 1990s [11-13]. In 2005, Foley built a five-stage model of LUTs [1]. LUT-related research focuses on land use transition theory and hypotheses [1, 12, 14], spatiotemporal pattern measurements and future scenario simulations [15], socio-economic-ecological impacts [5, 16-18]; driving mechanisms and optimization regulations [19, 20], which are mainly based on spatial analysis, statistics, modeling, and other methods. In recent years, not only one-dimensional LUTs and dominant form changes [4, 19, 21, 22] but also multidimensional LUTs and land use function (recessive form) transitions have attracted increasing attention [23, 24]. In essence, the multidimensional study of LUTs is based on their versatility. Land is generally considered to contain three basic functions: production, life, and ecology. Thus, land can be classified according to the dominant function of regional land use.
Since 1978, the transformation of China’s social and economic development model has accelerated, and ecological and environmental problems such as air pollution, wetland shrinkage, soil erosion, and land degradation have emerged one after another [25]. In this context, China’s “18th National Congress” proposed the national goal of “adjusting the spatial structure, promoting intensive and efficient production space (PS), livable and moderate living space (LS), and beautiful ecological space (ES)”. In May 2019, the “Several Opinions on the Establishment of a Territorial Spatial Planning System and Supervision and Implementation” further noted that by 2035, a territorial spatial pattern of safe, harmonious, competitive, and sustainable development of production-living-ecological space (PLESs) should be basically formed. It can be seen that the development mode of China’s territorial space has changed from the orientation of PS to the coordinated development of PLESs. The scientific and orderly overall layout of different types of land functional space and the formation of production, life, and ecological multifunctional coordination of the territorial space pattern have become the key to optimizing China’s territorial space development and protection mode and an important measure to promote high-quality regional development [26]. Research on land use functions has attracted increasing attention, and the perspective of PLES has become an important entry point for research on LUTs.
It is generally believed that PS mainly provides industrial, agricultural, and cultural products and services for human beings engaged in survival and livelihood activities; LS offers human beings living, consumption, entertainment, medical care, education, and other needs and residential services, carrying and safeguarding human habitat functions. ES mainly provides the ecological products and services required for the formation of ecological systems and ecological processes and maintains the health of the ecological environment [27-29]. Considering the crossover of land use functions, some scholars have also proposed complex spatial models that are parallel to the three types of single spaces, such as ecological-production space and production-ecological space [30].
Relevant studies have analyzed the conceptual framework of optimization of PLESs [29, 31], carried out functional identification and established a classification system [32, 33], and focused on topics such as the trade-off and coordination of PLES functions [27, 34, 35], the human settlement environment [36], conflicts [37], vulnerability [38], and sustainable development evaluation [39] from the perspective of PLESs. In particular, the number of studies on the spatial-temporal characteristics and driving mechanisms of LUTs and relationships between LUTs and the ecological environment from the perspective of PLESs is also increasing [8, 17, 24, 32, 40-44]. Some of these studies not only trace and predict the spatiotemporal pattern and performance of PLES transformation at different scales, considering characteristics, drivers, regional differentiation, and optimal regulation, but also evaluate possible environmental changes and their spatial differentiation caused by LUTs and explore the driving mechanisms behind them [16, 43-51]. Models and methods such as geographic information system (GIS) spatial analysis, dynamic degree, transfer matrix model, the ecosystem services valuation (ESV) evaluation model, the ecological environment response model, the landscape pattern method, spatial econometric regression, the future land use simulation (FLUS) model, the conversion of land use and its effects at small region extent (CLUE-S) model, and the geographic detector model are commonly used. In some studies, the impact of LUTs on the ecological environment is also reflected by single environmental factors such as hydrology [52], biology [3], carbon storage [53], and flood disaster risk [18].
These studies have focused mainly on large mesoscale units, such as administrative units of provinces, cities, and counties [46, 48, 54]; economically developed regions, such as urban clusters and coastal areas [45, 50]; or natural units, such as the Yellow River Basin [16] and the Three Gorges Reservoir area [9], revealing the negative effects of the transformation of PLESs in urban or economic zones on the ecological environment against the background of rapid industrialization and urbanization. LUTs are often regarded as the product of different interactions between humans and the environment in a region [55], emphasizing the drive of the social economy, policy planning, and nature on PLES transformation [8, 41, 46, 56]. However, these analyses are rarely discussed on a small scale. The scale difference of LUT implies that there may be different characteristics of LUT and ecological responses in small-scale regions than in large mesoscale regions. In addition, existing studies have paid little attention to the multifunctionality of rural regional space utilization [32]. In particular, typical studies on the transition law and ecological effects of rural PLES in karst ecological restoration areas in Southwest China are still not sufficient.
Previous studies on the ecological effects of LUTs in karst mountainous areas have been mostly based on approaches such as the dynamics of KRD to explore the impact mechanism of LUTs (such as cultivated land, bare rock land, and forestland) on ecological processes [57-61] or the adoption of comprehensive quantitative assessment methods such as EQI and ecosystem service functions [62, 63]. There are few studies on the ecological effects of LUTs against the background of PLESs that combine the KRD and EQI. The only studies that combine the two have carried out detailed quantitative analyses; they are county-level units [46] and lack analysis of more micro and basic small-scale cases in rural areas. With respect to the driving mechanism of LUTs in KRD mountainous areas, the perspective of social-ecological systems, as an important theoretical perspective, has attracted increasing attention in recent years. Some studies believe that the macro-socio-economic environment, such as the household registration system, household responsibility system, resource allocation, and less developed social economy, as well as rural localities, such as the single traditional agricultural livelihood mode, the pressure of population growth, and poverty, leads to unsustainable land use practices and promotes the formation of KRD [64]. Several studies have highlighted the implementation of restoration plans and population migration that led to increased ecosystem services and reduced degraded land by promoting changes in land use patterns [65, 66]. Some studies point out from the perspective of interaction and evolution between social systems and ecosystems that ecological transformation is the response of land use systems to the joint action of economic and social development and ecosystems [60]. Against the background of ecological fragility and low land carrying capacity, the disturbance of human society promoted the unreasonable LUTs in this special region, which further triggered the land degradation problem and deepened the human-land conflict; the implementation of ecological restoration projects and social and economic development have promoted the coordination between social and ecological systems and LUTs [57, 58, 60, 65, 67, 68].
The social economy, political background, actors, resources, and environment are all important components of the social-ecological system, which together constitute a complex and interactive social-ecological network. In other words, the social-ecological system is a symbiotic system of social, economic, and ecological-multielement interactions and adaptations [69, 70]. Under this theoretical framework, LUTs in karst mountainous areas are generally considered to be shaped by negative socio-ecological feedback induced by the depletion of key resources or positive feedback from social-ecological systems induced by socio-economic factors. These studies pay more attention to the socio-economy, policies and systems, resources, and environment-that drive land use transformation, which are directly reflected in the specific social and biophysical structures in a chosen social-ecological system. This study calls them structural dynamics. Although there are strong structural dynamics, local subjects’ internal perceptions, attitudes, values, and individual initiatives will also shape their land use behavior and affect external structures and rules, which is called nonstructural dynamics in this study. However, as important actors in land use change, local farmers are often regarded as the objects of structural dynamics and the economic subjects who are eager for quick success. The nonstructural dynamics of LUT have not received sufficient attention in current research, which affects the overall understanding and interpretation of rural land use change in karst mountainous areas.
This study attempts to bridge these gaps. The difficulty of this analysis lies in finding the relationships between the regional ecological effects of PLES transformation from different perspectives. In addition, the social-ecological system perspective prioritizes the structural dimension and challenges comprehensive analyses incorporating nonstructural dynamics. More emphasis should be placed on understanding the relationship between social-ecological components such as structural dynamics, nonstructural dynamics, and actors and revealing how their interactions shape LUT through integrated analysis. GIS spatial analysis technology helps reveal the relationships among geospatial data and is an important tool for exploring the relationships between regional land use change and the ecological environment and the correlations among different ecological effects. Unlike large-scale research, which focuses on macro analysis and trend prediction, small-scale research is conducive to penetrating the village interior, touching the local land use change practices, clarifying the interactions between different social and ecological components, and achieving a more refined analysis of the PLES transformation in karst rural areas.
Karst ecosystems cover approximately one-fifth of the Earth’s land [71]. The karst environment is one of the most fragile ecological zones worldwide and is more susceptible to human disturbance [72]. Especially in the karst areas of Southwest China, karst development is extremely strong, the human-land ecosystem is complex, and KRD is widespread, which has a great negative impact on the local social economy and environment [72-74]; thus, these areas are also among the most typical strategic sectors of China’s national ecological and environmental governance, which inevitably leads to complexity and uniqueness in the evolution of PLESs different from that of economically developed regions. In-depth exploration of typical case studies in the karst mountainous areas of southern China will help deepen the understanding of the relationships between these spaces and the environment, which is crucial for scientific planning of the direction of LUTs, optimization of the functional structure of PLESs, and construction of a scientific balance between the protection and development of national space and maintenance of sustainable development of the global karst region. Guizhou Province has the most severe KRD of all the provinces in China. The Huajiang Gorge karst area is one of the province’s main areas of KRD distribution and has been under control for many years. Therefore, this paper chooses Guanling-Zhenfeng Huajiang in Guizhou as a case study to explore the characteristics of PLES transformation and the response of the ecological environment in this area.
Materials and Methods
Overview of the Study Area
The study area is located in southwest Guizhou, south of Guanling County and north of Zhenfeng County, on both sides of the Huajiang Gorge, spanning the Beipanjiang River. With a total area of 51.62 km2 and a total population of 11,200 in 2018, the area has jurisdiction over 6 administrative villages (Fig. 1), namely, Mugong, Bashan, Xiagu, and Wuli (including the two natural villages of Falang and Ganerpan) in Huajiang town in Guanling County, Cha’eryan village, and Yindongwan village in Beipanjiang town in Zhenfeng County.
Carbonate rocks are widely distributed in the study area, and the karst distribution area represents 88.07% of the total area. It is a typical karst gorge landform with an altitude of 500-1200 m, and the vertical differentiation of climate elements is significant. Owing to the development of karst, the river valley is deep, as is the groundwater level. These factors, coupled with the uneven spatial and temporal distributions of rainfall, mean that the land surface experiences severe water shortages and droughts. The gorge topography intensifies the drought effect on the habitat, and the ecological environment is extremely fragile. Traditional food crops such as corn have long been planted in the area. Due to the small amount of arable land and barren soil, almost no basic farmland construction, and extensive agricultural production, the regional social and economic development level is low, and the environmental degradation level is severe.
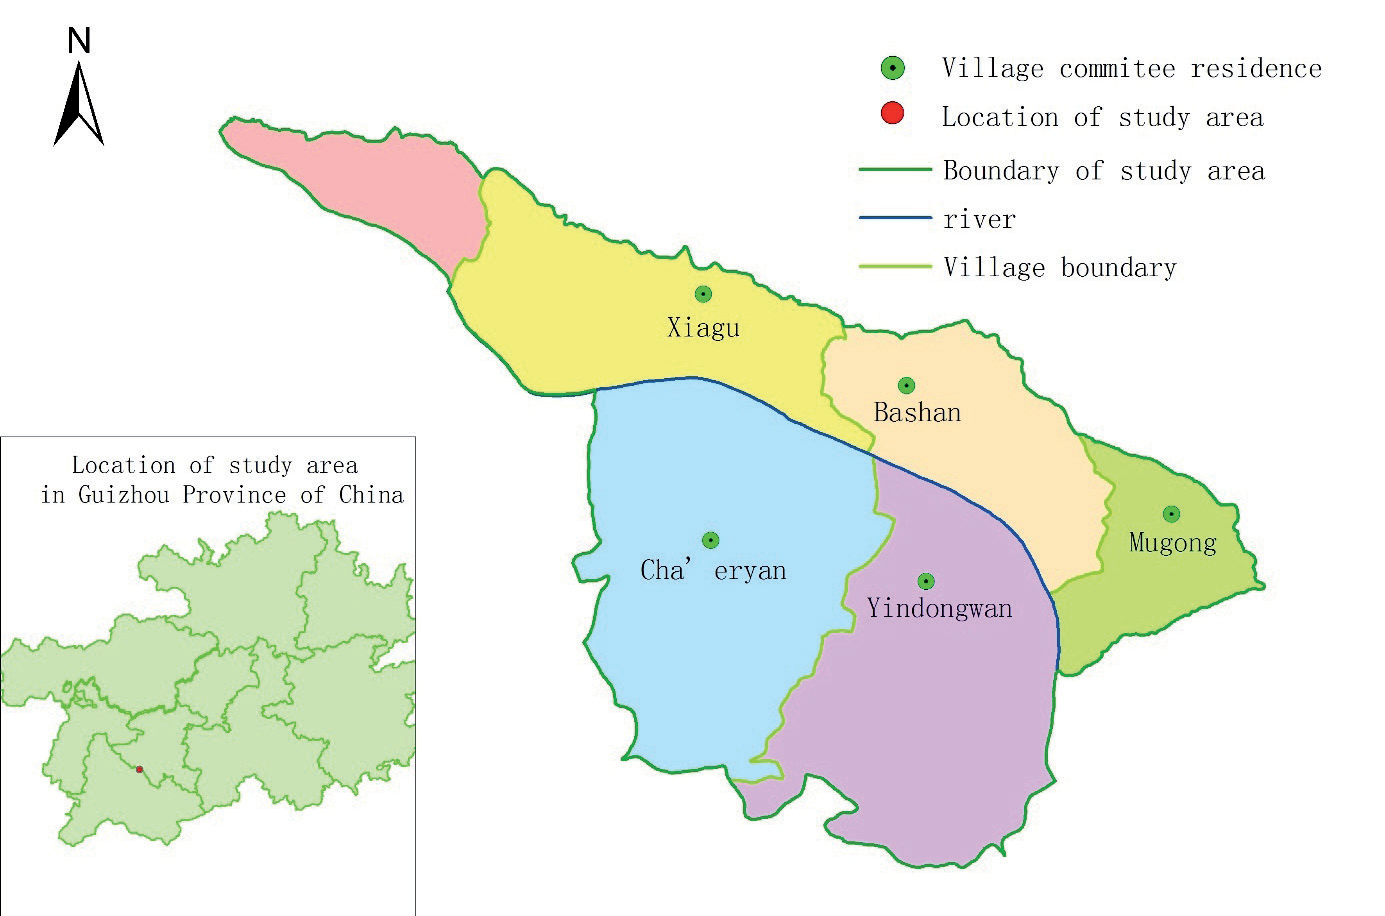
As one of the most serious KRD areas in Guizhou Province, since the 1990s, the study area has made full use of the advantages of local biological and climatic resources, combined mountain protection with characteristic agricultural development, carried out KRD control with special economic forestry as the core, and planted cash crops such as Chinese prickly ash (Zanthoxylum planispinum var. Dintanensis) and kernels on KRD land, which was a typical karst ecological restoration area.
Data Sources and Processing
The main data sources used in this study were SPOT5 images from 2005 and 2010 (at a resolution of 10 m), AlOS-1 images from 2015 (at a resolution of 2.5 m), and ZY-3 images from 2020 (at a resolution of 8 m) remote sensing. After radiometric correction, image fusion enhancement, geometric correction, and other preprocessing steps were performed under the ERDAS platform to control the relative position accuracy of the four phases of images within the error. Then, an interactive human-machine interpretation of the data was carried out. Interpretive maps were generated with the help of the GIS platform. Finally, the sketch was adjusted and corrected in the field to obtain the map and database of land use and KRD. According to the “Classification of Land Use Status (GB/T 21010- 2017)” and the actual situation of the study area, the land use types were divided into 13 categories: dry land, paddy field, garden land, forestland, shrubland, other forestlands, natural meadowland, other meadowlands, industrial and mining land, rural residential land, traffic land, river, and bare land. In accordance with the methods of Xiong et al. [72], the KRD in the study area was divided into 6 grades: no karst rocky desertification (NKRD), potential karst rocky desertification (PKRD), light karst rocky desertification (LKRD), moderate karst rocky desertification (MKRD), severe karst rocky desertification (SKRD), and very severe karst rocky desertification (VSKRD). Among them, the LKRD and above-KRD types are collectively referred to as KRD land. The results of land use and rocky desertification classification in the study area were verified via GPS field sampling and calculated accurately. The accuracy of the remote sensing interpretation data was ≥0.9, which met the requirements of this study.
Construction of the PLES Classification System and Calculation of the Ecological Environment Quality Index
The recognition and classification of regional PLESs constitute the important basis of this research. The basic land use data used in this paper mainly classifies land types according to the characteristics of natural land cover [75], while the concept of PLESs was proposed from the perspective of land use functions. Different land types are divided into production, ecological, and living functions, and a new land use classification system is established to reflect economic production, the ecological environment, and livable life as multiple dimensions pursued by economic and social development in the study area [76]. According to the theory of “element-structure-function” in system theory, land use structure is the basis of land use function realization when land use is taken as a system. Therefore, based on the structure of land use types, a logical connection and classification system between land use types and land use functions can be established to construct a scientific classification and evaluation system for PLESs [77]. Since a land use type may have multiple functions, it isn’t easy to classify land from the perspective of functions. However, based on actors’ subjective land use intentions, a certain type of land always has a dominant function. For example, cultivated land has the production function of producing and supplying food, as well as maintaining certain ecological functions and recreational and other life functions. However, from the perspective of people’s main intention to use cultivated land, the main function of cultivated land lies in food production, that is, the production function. Therefore, cultivated land is classified as APS and belongs to the PS subtype. This paper uses the dominant function of land use to interpret the different types of PLESs. In the context of PLESs, LUTs refer to the transformation between the three leading land use functions.
Based on the perspective of PLESs and the leading land use functions, the dominant land use functions of different status types of land use were identified and classified by referring to the relevant literature on land use functions [75, 78] and regional reality and following the principles of bottom-up and functional classification. Finally, the classification scheme of the leading functions of the three types of land use is formed.
The study used the ecological environment quality index to quantitatively characterize LUT’s ecological and environmental effects in the study. This method is based mainly on different land use types’ specific ecological attributes and background ecological values. On this basis, the quality of the ecological environment of each land use status type can be fuzzily assigned, and the EQIs of different land use status types can be determined. The area weighting method was subsequently used to assign the ecological environment quality of the leading function classification of PLES land use, and the correlation between the PLES land use change and the regional ecological environment quality change was established to analyze the characteristics of the regional ecological environment change [79].
In this study, the EQI of different land use status types in the study area was determined by referring to the ecological environment quality indices of different secondary land types formulated by Li et al. [79] based on the expert scoring method in the study of arid areas in Northwest China and the research of Luo et al. [80] and Han et al. [81], combined with the specific practical situation of regional land use. On this basis, the area weighting method was used to assign values to the ecological environment quality of different types of PLESs in different years in Huajiang Gorge (Table 1). According to the calculation process of the eco-environmental quality indices by Li et al. [79], the same land type should reflect different eco-environmental qualities in different land use structures, and such differences can be ignored in large mesoscale regional studies; however, in small-scale regional studies, if only the mean value is used, then the results may have certain deviations. Therefore, the ecological environment quality indices of different years were calculated dynamically.
Dynamic Degree of Land Use and Karst Rocky Desertification Types
The dynamic degree reflects the change rate of land use and KRD type in the study area over a specific period. The formula is as follows in Equation (1):
where K represents the dynamic degree of a certain land use type or KRD type during the study period (%); Ua and Ub represent the areas of a certain land use or KRD type at the beginning and end of the study period, respectively; and T represents the study period, that is, the number of years.
Land Use and KRD Area Transfer Matrix
Based on the classification and statistics of the land use types and KRD grade types, the area transfer matrix of the land use or KRD types was obtained via superposition analysis in ArcGIS to quantitatively describe the state transitions and spatiotemporal structural changes in the different land use types and KRD types over 15 years. The calculation formula is represented in Equation (2) as follows:
where S represents the area transfer matrix, n is the number of types, and i and j denote the initial and final types, respectively.
Ecological Environment Response Model
Ecological Contribution Rates of Changes in the Eco-Environmental Quality Index during LUTs
(1) Ecological environment quality index
Based on the ecological differences in land use types, the overall ecological environment quality in each region was quantitatively described according to the different ecological quality levels and structural proportions of land use in the region. The specific calculation formula used is as follows:
Table 1.
Land use classification of production-living-ecological space and eco-environmental quality index in Huajiang Gorge.
where EQI is the regional eco-environmental quality index in a certain period, and Ri is the ecological environment quality index of the land use type i. n is the number of land use types in the region; Aki is the area of land use type i in a certain period; and Ak is the total regional area.
(2) Ecological contribution rate of EQI change
The ecological contribution rate of LUTs refers to the change in regional ecological environment quality caused by a certain LUT; its expression is as follows:
where LEI represents the ecological contribution rate of a certain land use function change in a certain period, and LEt+1 and LEt represent the EQI at the end and beginning of a certain type of land use function change, respectively. When the difference between the two is greater than zero, the ecological environment changes forward; when the difference is less than zero, the ecological environment changes in reverse. LA represents the change area of the land use function type, and TA represents the total regional area.
The Occurrence of KRD and the Contribution Value of KRD to Land Use Transformation
(1) Rocky desertiffication comprehensive index
To understand the severity and changes in KRD in the study area and explore the response of KRD to regional land use transformation, we refer to Li et al.’s [82] rocky desertiffication comprehensive index, which is based on the area proportion and grade weight of KRD. The calculation formula is as follows:
In the formula, K represents the regional rocky desertification comprehensive index, Ri is the intensity grading value of KRD type i, and the values from the NKRD to the SKRD are set as 0, 0, 2, 4, 6, and 8. Ai is the area weight of KRD type i, and i is the number of regional KRD types. KRD is the most serious environmental geological problem in karst areas, and the evolution of KRD may lead to the improvement or deterioration of regional ecological environment quality. Therefore, the response of KRD to LUT can be used as an important standard to measure the change in the quality of the ecological environment in karst ecological restoration areas from the perspective of LUT. The larger the K value is, the more severe the degree of KRD is.
(2) KRD contribution value of LUTs
To fully understand ecological restoration and the contribution of land use change to KRD in the study area during the study period, KRD was divided into improved, unchanged, and deteriorating types according to the transformation of KRD types. The comprehensive contribution value and single contribution value of land use change in the KRD-improved area were analyzed.
The mathematical expression for the single contribution value of LUTs to KRD is calculated as follows in Equation (6):
where SCVi signifies the single KRD contribution value of LUC type i, LAi denotes the change area of LUC type i in each KRD change type area, and LA is the total land use change area of the corresponding KRD change type area.
The calculation formula for the comprehensive contribution value of LUTs to KRD is given in Equation (7):
where CCV is the comprehensive contribution value of LUT to KRD, LA represents the total area of land use change in each KRD change type area, and TA denotes the land area of the corresponding KRD change type area.
Results
Spatial-Temporal Pattern of PLES Evolution
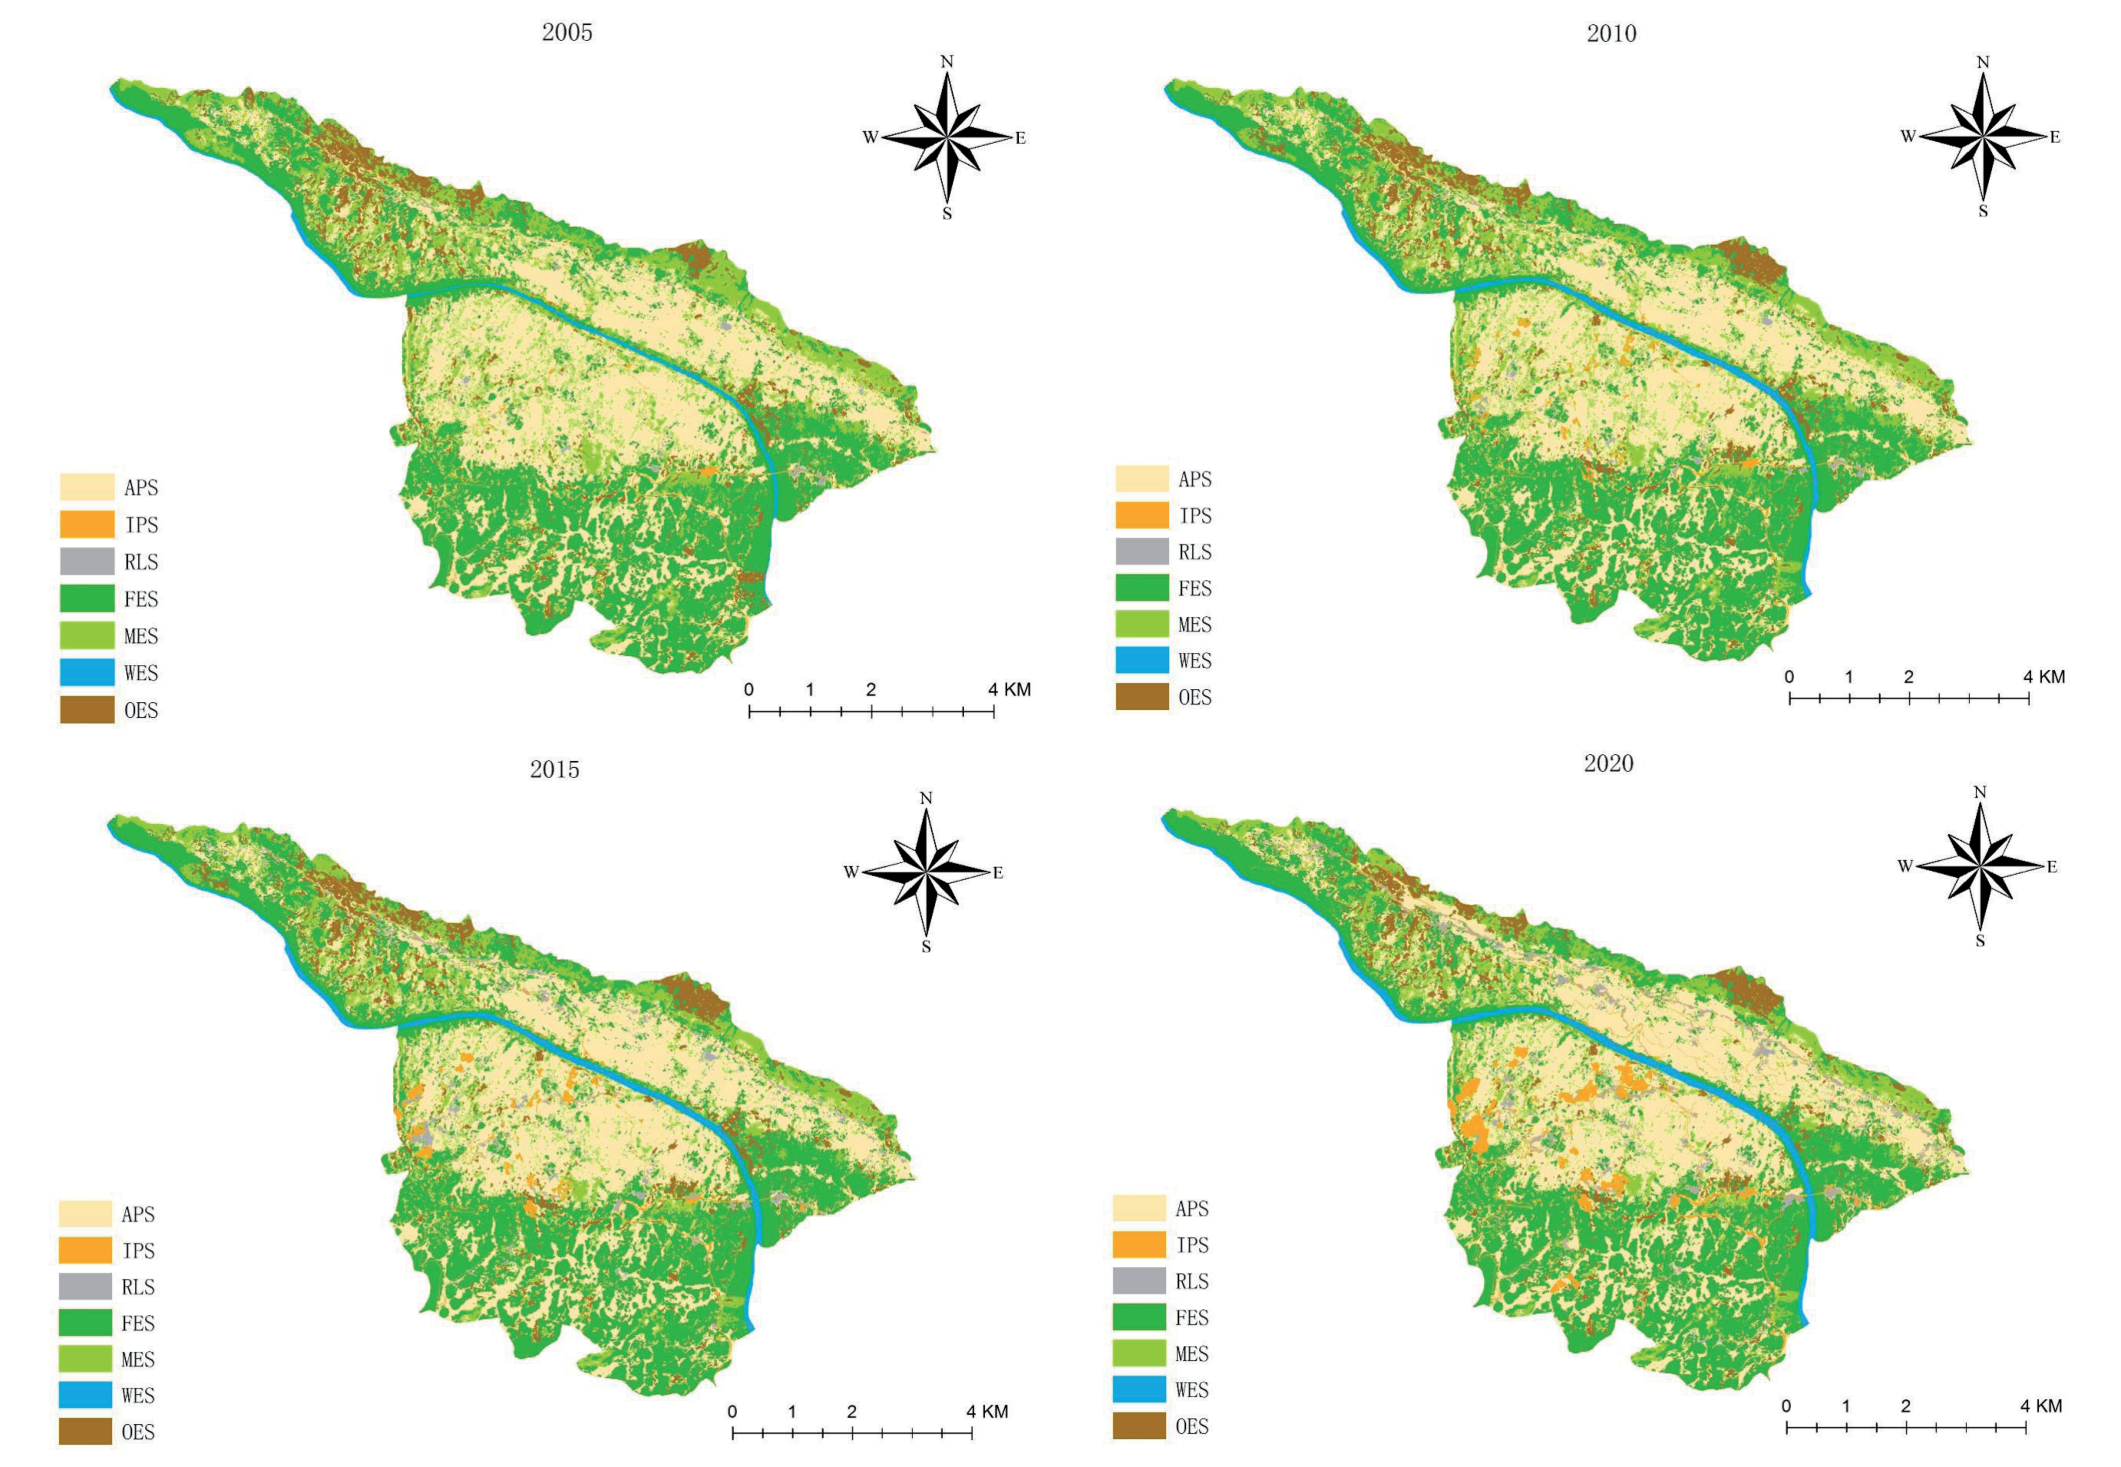
Within 15 years, the PLES areas changed dynamically to different extents (Table 2). Although the proportion of the LS remains small, it continues to expand; this area has increased the most. The dynamic change is the most drastic, with the fastest growth occurring from 2010 to 2015. The ES first increased and then decreased, with an overall decreasing trend; this area change has been the most significant. The PS decreased first and then increased, showing an overall increasing trend; this change has been the slowest. The changes in PS and ES from 2015 to 2020 were relatively drastic. Regarding ES, the FES fluctuated and increased overall; the WES area increased continuously, with the greatest change seen from 2005 to 2010; and MES and OES were the main contributors to the reduction in ES area. In the PS, the APS showed a slow decreasing trend, and the fastest decreasing trend occurred from 2005 to 2010; furthermore, the IPS continued to expand. Among the secondary land types, the change in the RLS was the most drastic, with the fastest growth occurring from 2010 to 2015, followed by IPS and WES, which experienced the fastest growth from 2015 to 2020 and from 2005 to 2010, respectively. The MES experienced the most drastic reduction, with the fastest reduction occurring from 2010 to 2015, followed by the OES, with the fastest reduction occurring from 2015 to 2020.
The spatial differences in PLESs are obvious, yet their distribution has remained stable overall (Fig. 2). The PS has remained concentrated contiguously, i.e., mainly on both sides of the river in the middle of the study area, in southeastern Xiagu village, the middle of Mugong village and Bashan village, the northern and central parts of Cha’eryan village, and the northern part of Yindongwan village. The spatial distribution of IPS has increased significantly, changing from a scattered line and point pattern to a network pattern, and the areas in Bashan village, Mugong village, and Cha’eryan village have expanded rapidly. The LS remains scattered along the traffic route in a spot-like way, and the patches expand continuously at any time, gradually forming a band or block. The ES is distributed mainly at the periphery of the PS and shrinks with the expansion of the PS and LS. The FES is distributed mainly in the areas south of Cha’eryan village and Yindongwan village, south of Mugong village, and the natural villages of Falang and Gan’erpan; it extends to the middle of the research area along the river. The MES is concentrated in Wuli village, west of Xiagu village, the northern edge of Mugong village and Bashan village, and north of Cha’eryan village and Yindongwan village. The OES is distributed mainly in western Xiagu village, southeastern Bashan village, and the middle and southern areas of Cha’eryan and Yindongwan. The river’s water surface has widened, and the continuity of the river reaches has increased.
Analysis of Land Use Transformation
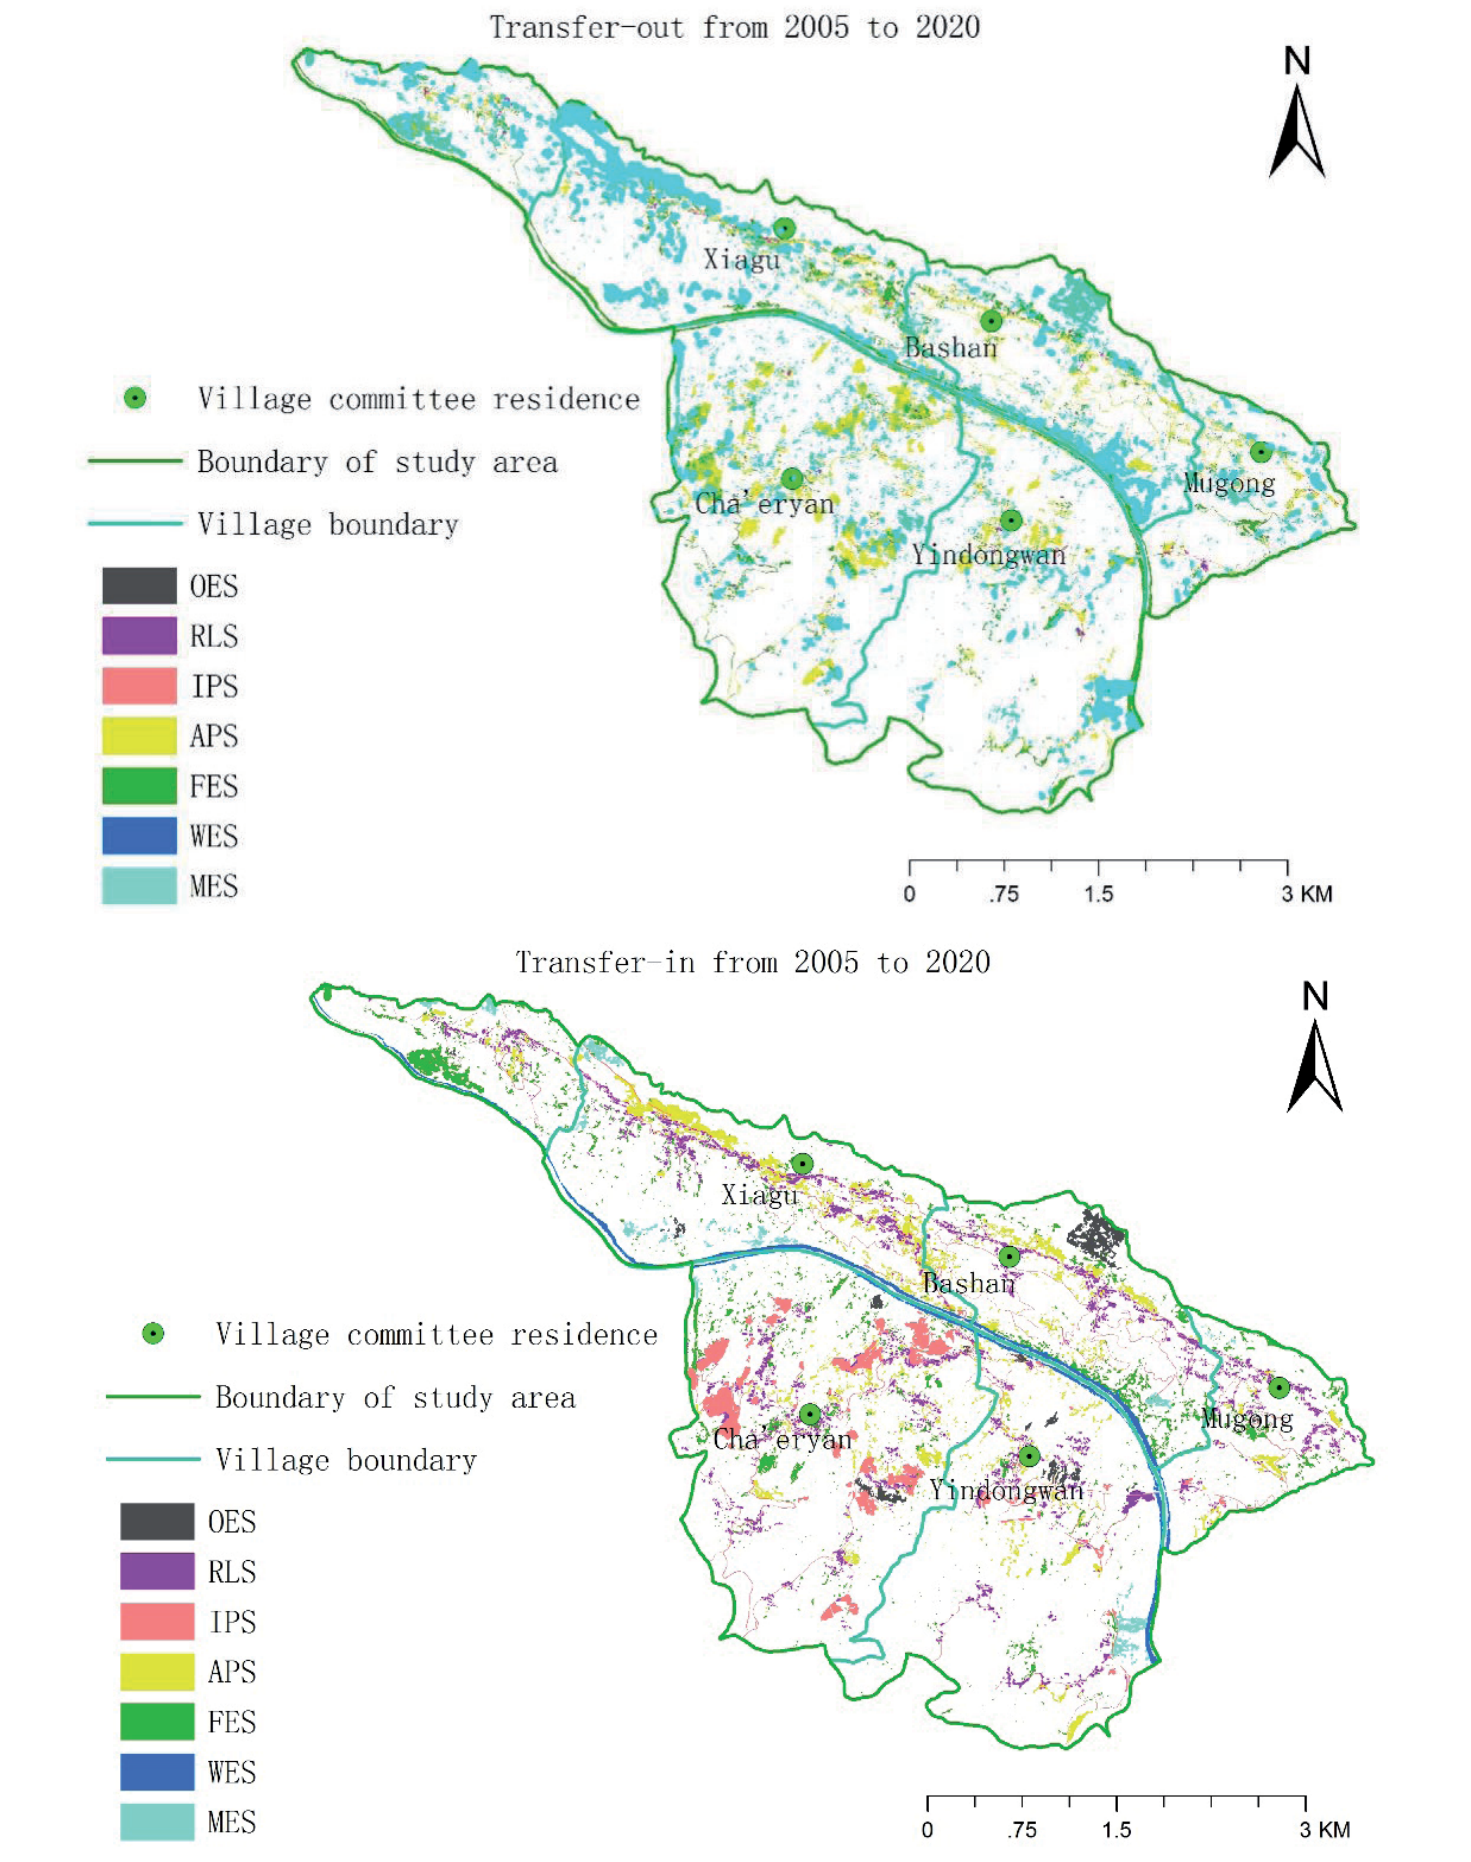
To more intuitively observe the transformation of PLESs in the research area over the 15-years, the land use transfer matrix of PLESs was constructed every five years from 2005 to 2020 (Tables 3, 4, and 5).
During the first stage (2005-2010), the PS area decreased, the LS expanded slightly, and the ES area increased significantly. At this stage, the transformation of PLESs is reflected mainly in the internal conversion within ES, the conversion of PS into ES, and the internal conversion within PS. WES and IPS are the main transfer-in types, and APS to IPS and FES to WES are the most important conversion types. The transfer-in from OES is also greater, mainly from MES and APS. The APS is the most significant transferred-out land type, transferring mainly to IPS, FES, and OES.
During the second stage (2010-2015), the PS increased slightly, the LS expanded significantly, and the area of ES decreased significantly. At this stage, the transformation of PLESs is reflected mainly in the internal conversion of ES, ES into PS, PS into LS, and ES into LS. The transfer-out of MES was the most significant, and the conversion area of MES to FES was the largest, followed by the conversion area of MES to APS. RLS and FES are the main transfer-in types, and APS and FES into RLS and MES into FES are the most important conversion types. The conversion area of MES to RLS is also relatively large.
Table 2.
Land use area and changes in production-living-ecological space in Huajiang Gorge from 2005 to 2020.
During the third stage (2015-2020), the PLES transformation was more drastic than in the previous two stages. In this stage, the PS expanded significantly, the LS expanded less, and the ES shrank more than in the previous stage. The transformation of PLESs is reflected mainly in the conversion of ES into PS, internal conversion within ES, PS into LS, and ES into LS. APS, FES, MES, and OES are the main types transferred out, and IPS is the most important type transferred in, mainly from APS, RLS, FES, and MES, followed by LS, mainly from APS and FES. The WES area also increased, mainly from FES.
In general, although the overall intensity of LUTs is not large, the intensity of LUTs experienced slow growth and then significantly increased. The main type of functional transformation is internal conversion within ES, followed by the mutual conversion of ES and PS, with the transfer-out of ES and the transfer-in of PS serving as the main conversion direction; the third type is mutual conversion within PS, ES, and LS and the transfer-in of LS. From the perspective of secondary land types, during the study period, IPS crowded out much of the APS, MES, and FES areas; APS eroded the MES and OES areas; MES, OES, and APS returned to the FES areas; and FES and MES returned to the WES areas. However, in total, the ES area continues to decrease; although the areas of LS and PS transferred from other land types are not large, the total land area continues to increase.
Ecological and Environmental Response of LUTs
Ecological Contribution Rate of EQI Change
The EQIs of the study area in 2005, 2010, 2015, and 2020 were 0.4823, 0.4804, 0.4789, and 0.5001, respectively. From 2005 to 2010, the EQI decreased by 0.0019; from 2010 to 2015, the EQI continued to decline, but the rate of decrease decreased to 0.0015 compared with that in the previous stage; from 2015 to 2020, the EQI increased by 0.0212 compared with that in the previous stage. This shows that the quality of the ecological environment continues to improve. Among the primary classifications of land use, the EQI of PS is the most responsive to the change of PLES. In terms of the EQI of the areas on the north and south sides of the Huajiang River, the ecological environment quality of the study area in 2005 is high in the south and low in the north.
Table 3.
Land use transfer matrix of production-living-ecological space in Huajiang Gorge from 2005 to 2010 (unit hm2).
Table 4.
Land use transfer matrix of production-living-ecological space in the Huajiang Gorge from 2010 to 2015 (unit hm2).
Table 5.
Land use transfer matrix of production-living-ecological space in Huajiang Gorge from 2015 to 2020 (unit hm2).
To reveal the impact of LUTs on regional ecological environment quality, combined with the transformation analysis of PLESs and Equation (4), the contribution rates of different LUTs to the regional ecological environment were calculated (Table 6).
From 2005 to 2010, the conversion of OES into MES and that of APS into MES were the most important LUT types, leading to ecological improvement; the combined contribution rate of the two was more than 86.38%. The LUTs that led to the deterioration of the ecological environment mainly included the conversion of MES to OES, that of APS to IPS, and that of APS into OES. The conversion of the OES to MES contributed the most. From 2010 to 2015, the LUTs that led to the improvement in regional ecological quality mainly consisted of the conversion of MES to FES, and the conversion of APS to RLS, FES to RLS, and MES to APS resulted in a decline in regional ecological environment quality. From 2015 to 2020, the conversion of OES to FES, that of OES to APS, that of MES to FES, and that of RLS to FES promoted improvements in regional ecological environment quality. The conversion of APS and FES to IPS and that of APS and FES to RLS led to a decline in regional ecological environment quality.
Table 6.
Major land space transition types affecting eco-environmental quality and their contribution rates in Huajiang Gorge from 2005 to 2020.
Since the increase and decrease in the EQI can reflect the improvement and deterioration of the ecological environment, transferring PELSs with a small EQI to spaces with a large EQI can produce positive ecological effects and vice versa. To show the spatial changes in positive and negative ecological effects, the PLES area without transformation from 2005 to 2020 was defined as the ecological conservation area, the transfer area with positive ecological effects is defined as the ecological improvement area, and the transfer area with negative ecological effects was defined as the ecological deterioration area. The ecological conservation area is the largest, followed by the ecological improvement area, accounting for 9.59% of the total area, which is greater than 5.78% of the ecological deterioration area. From the perspective of spatial position (Fig. 3), the ecological deterioration area is concentrated mainly in the middle of the study area, especially north of Cha’eryan village, east of Xiagu village, and north of Ba Shan village.
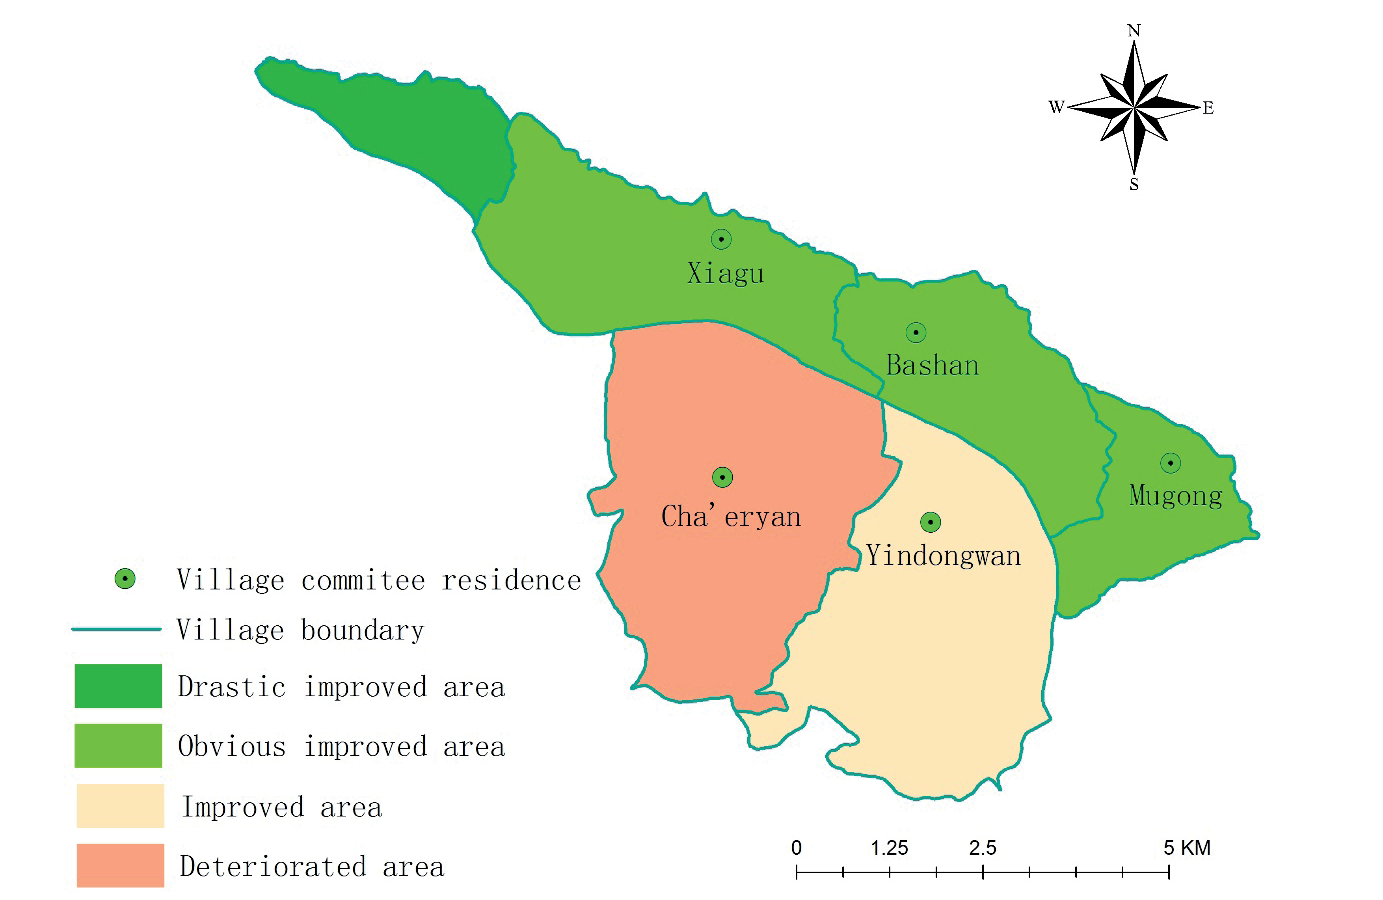
The thematic maps in Fig. 4 and Fig. 5 show spatial change patterns in the PLESs and EQI in the study area from 2005 to 2020. As shown in the figures, in addition to the village of Cha’eryan, the ecological environment quality of the other villages has improved, but the degree of improvement varies. The improvement in the quality of the ecological environment in Wuli village was the most significant, and the transfer-out of MES and OES and the transfer-in of large amounts of FES were the main reasons. In the villages of Xiagu, Bashan, and Mugong, although the transfer-in of the RLS, APS, and OES has brought a negative effect, this effect is offset more by the transfer-out of the MES, the transfer-in of the FES and WES, and the improvement of ecological environment quality is relatively obvious. In Yindongwan village, the transfer-out of MES and APS and the transfer-in of RLS are obvious, which offset the positive effect of transfer-in of FES, and the improvement in environmental quality is not obvious. In general, the transformation within ES is closely related to the restoration of karst ecology.
Fig. 3.
The change in zoning of ecological environment quality in Huajiang Gorge from the EQI perspective from 2005 to 2020.
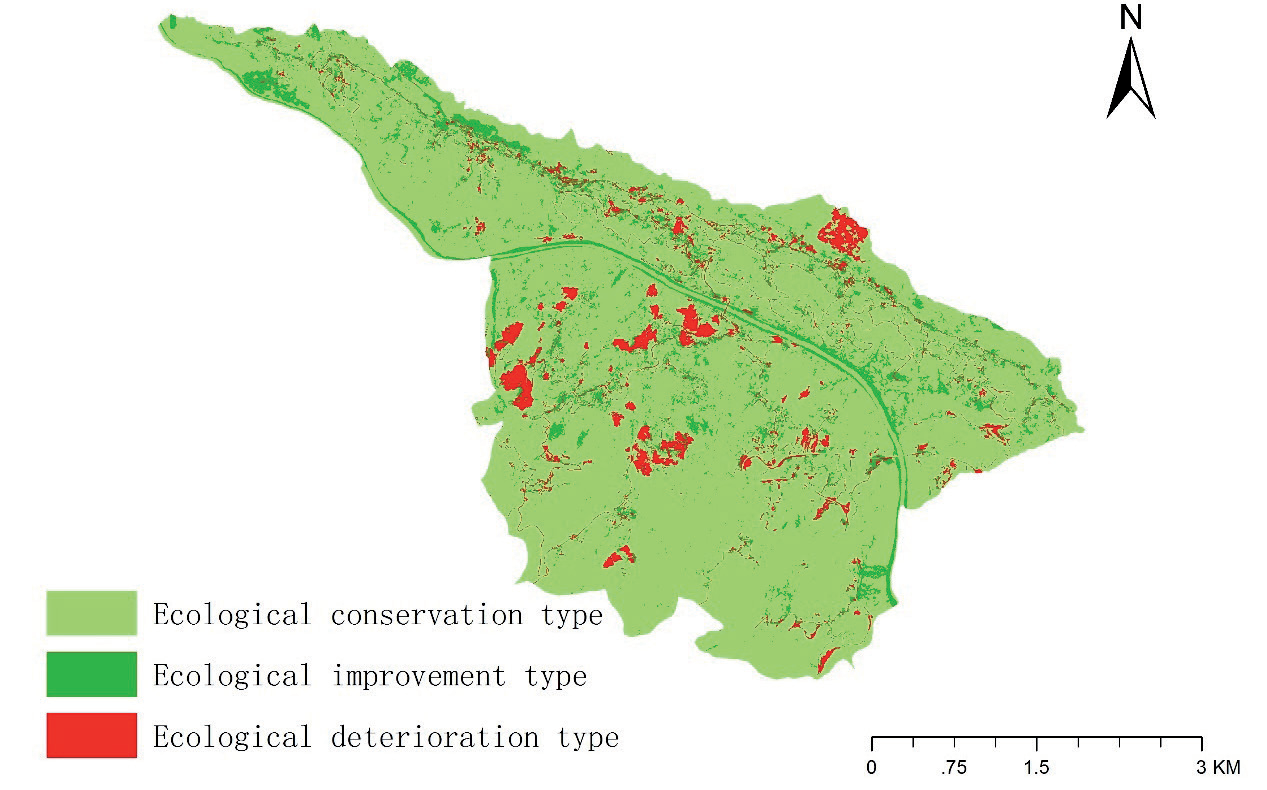
Fig. 4.
Ecological environment quality changes in different administrative villages in Huajiang Gorge from the EQI perspective from 2005 to 2020. (When the EQI change of a village is greater than 0.1, the village is defined as an ecologically dramatically improved area; when the EQI change of a village is between 0.05 and 0.1, the village is defined as an ecologically obviously improved area; when the EQI change of a village is between 0 and 0.05, the village is defined as an ecologically improved area; and when the EQI change of a village is below 0, the village is defined as an ecologically deteriorated area).
Contribution Value of KRD in LUTs
Spatial-Temporal Evolution of KRD
As shown in Table 7, from 2005 to 2020, the KRD area in the study area exhibited a continuous decreasing trend, and the proportion of the KRD area in the regional karst area decreased from 62.22% in 2005 to 59.77% in 2015 and then to 56.32% in 2020. The regional K value also decreased from 1.8556 in 2005 to 1.6507 in 2020, indicating that although the net reduction in KRD was not large, the overall improvement trend accelerated.
From an evolutionary perspective of the KRD grade (Table 8 and 9), the NKRD increased most dramatically in each period and served as the main transfer-in type, mainly from the PKRD and LKRD. The PKRD, LKRD, and SKRD areas continued to decrease, and the PKRD decreased rapidly, second only to the dynamic degree of the NKRD. SKRD changed mainly to MKRD and NKRD, and MKRD changed mainly to LKRD and NKRD. The results revealed that over the 15-year study period, the KRD in the study area continuously decreased, and the ecological environment continuously improved.
Occurrence of KRD in Various Land Use Types
KRD occurrence in different land use types in the study area is shown in Table 10. During the 15-year study period, the distribution area of KRD in PS continued to decrease, with a reduction rate of 7.63%, while the distribution area of KRD in ES first increased but then accelerated to decrease; the overall change was relatively drastic, with a drastic change of 12.45%. From 2015 to 2020, the ES replaced PS as the main contributing factor to the improvement in regional KRD. In general, the KRD in ES is more responsive to the change of PLESs.
Table 7.
Area and proportion of different KRD types in Huajiang Gorge from 2010 to 2020.
Table 8.
Evolution area (EA) and annual change rate (ACR) of the different KRD types from 2005 to 2020.
Table 9.
The area transfer matrix of rocky desertification in Huajiang Gorge from 2005 to 2020 (unit hm2).
| KRD types | NKRD | PKRD | LKRD | MKRD | SKRD |
|---|---|---|---|---|---|
| NKRD | — | 0.67 | 0.55 | 9.85 | 0.00 |
| PKRD | 337.35 | — | 28.58 | 7.34 | 0.37 |
| LKRD | 126.71 | 97.05 | — | 0.35 | 0.68 |
| MKRD | 46.05 | 0.62 | 64.22 | — | 2.1 |
| SKRD | 34.58 | 4.04 | 3.76 | 81.28 | — |
Among the secondary land use types, the improvement in KRD was accompanied by increases in FES, WES, IPS, and RLS and reductions in MES, APS, and OES. KRD was mainly distributed in APS, FES, MES, and OES, which were the main contributors to the regional KRD (Table 10). Over the 15 years, a reduction in KRD areas in these land use types was observed, and the order of contribution rates of these land use types to the improvement in regional KRD was APS (36.87%) > MES (34.39%) > FES (22.33%) > OES (6.44%) (Table 9). Notably, the LKRD in APS, the MKRD in MES, and the SKRD in OES contributed more to the forward evolution of regional KRD. FES, MES, and OES were the land use types with the largest reduction areas in the KRD from 2005 to 2010, 2010 to 2015, and 2015 to 2020, respectively, and were the main contributors to the improvement in the regional KRD during the different periods. From the change in rocky desertification levels, the areas of all the KRD levels in the MES decreased, indicating that the KRD in the MES improved significantly.
KRD Contribution Value of LUTs
To directly reflect the impact of LUTs on KRD from 2005 to 2020 and to fully evaluate the changes in the ecological environment in the study area, according to the evolution direction of the different KRD grades in the KRD area transfer matrix, the evolution types of KRD were then summarized into three types: improved (the grade of KRD decreases), unchanged (the grade of KRD does not change), and aggravated (the grade of KRD increases).
According to the statistics, the area of the KRD-unchanged mode accounts for 93.46% on average in the regional karst area, while the land use change area accounts for only 1.95% on average in this type of area. The area of the KRD-improved mode accounts for an average of 6.09% of the regional karst area, while the land use change area accounts for 53.11% of this type of area. The average proportion of deteriorated rocky desertification in karst areas is 0.67%, the average proportion of land use change in this type of area is 74.36%, and land use change is the most active. Overall, the improvement and deterioration of KRD coexisted in the two stages from 2005 to 2010 and 2010 to 2015, but the improvement area of KRD was far greater than the deterioration area. The spatial distribution of the former was more concentrated and contiguous (Fig. 6). In addition, the data show not only that deteriorated KRD did not occur in the study area from 2015 to 2020 but also that the ecological environment continued to improve. Therefore, we focused on investigating the response of LUTs and KRD in the KRD-improved area (Table 11).
Table 10.
Occurrence of KRD in different production-living-ecological land types in Huajiang Gorge from 2005 to 2020 (unit hm2).
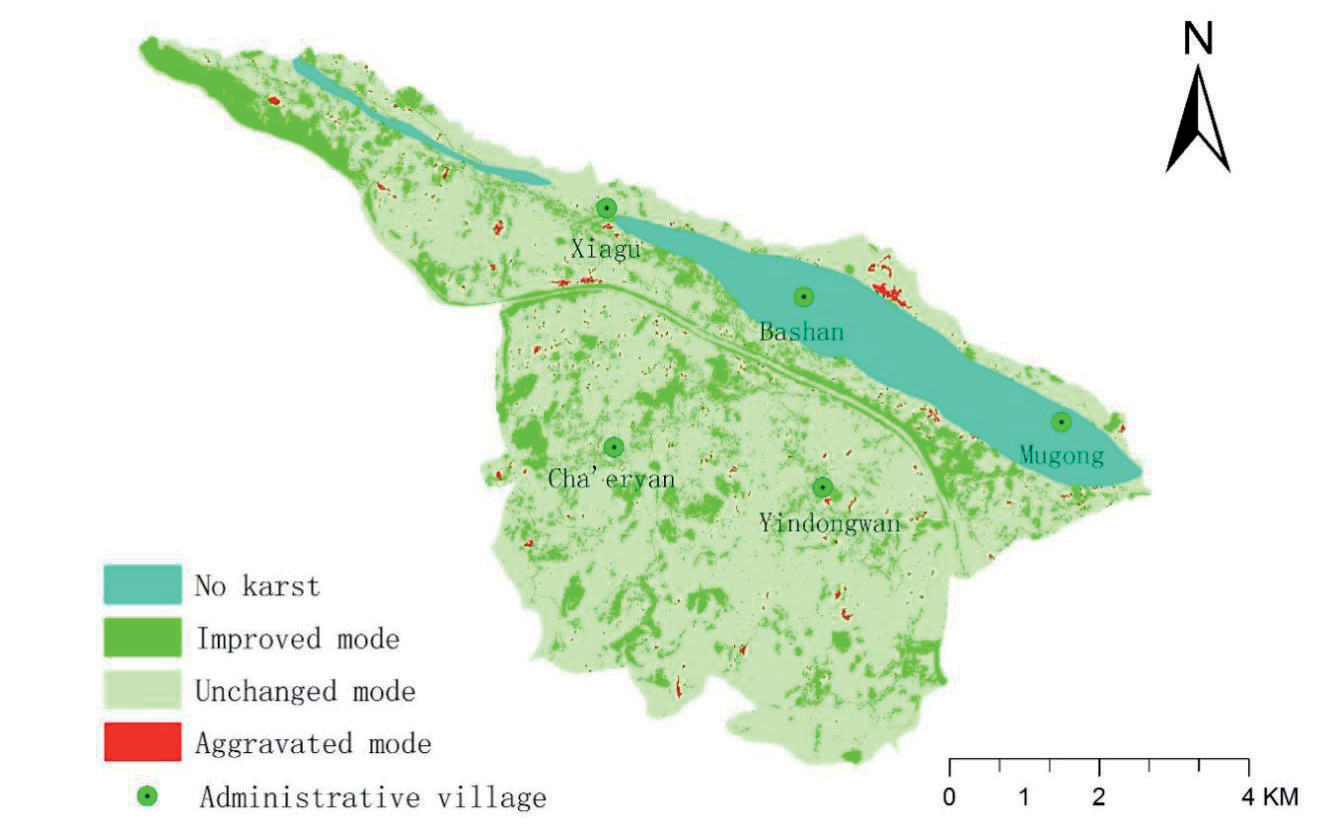
Table 11.
The contribution rate of the main transition of production-living-ecological space to the improvement of KRD in Huajiang Gorge from 2005 to 2020.
As shown in Table 10, the CCV fluctuated with the PLES transformation in different periods, reaching a low value from 2010 to 2015 but still showing an overall increasing trend. Specifically, there are differences in the types of dominant land use changes that play a role in different periods. From 2005 to 2010, the main conversion types in the improvement area were OES to MES, FES to WES, and MES to WES. From 2010 to 2015, the most important transformation types were MES to FES, MES to APS, and APS to RLS. From 2015 to 2020, the conversion of APS to IPS and RLS and MES and OES to FES were the dominant types of LUTs. In general, the internal conversion of ES and PS, that of PS to LS, and that of ES to PS were the more active land use change types of land use change in the KRD-improved area.
Discussion
PLES Transformation and Ecological Environment Response
The study finds that the transformation of the PLESs is closely related to the evolution of the ecological environment and serves as a significant explanatory factor for regional ecological changes [45-50, 75, 78, 83-85]. Previous studies have shown that the karst mountainous areas in southwest China have undergone significant transformation and evolution in recent decades, and LUTs have made significant contributions to the ecological restoration of the area; the relationship between the two is positively coupled, indicating a shift in the relationship between land use and ecosystem [57]. This case verifies this trend. From the 1950s to the 1980s, vegetation rapidly disappeared in the southwestern karst area, leading to severe environmental degradation [60, 61]; since the beginning of this century, with the transformation of land use, the ecological environment quality has gradually improved [46, 59, 60, 65, 67]. The Huajiang Gorge area is a typical example of land use and environmental change in this region. Li et al. [60] clearly indicated that the transformation of KRD is the result of LUTs and the improvement of the human-land relationship in the karst mountainous areas of Southwest China. However, this study found that although the KRD area in the study area continued to shrink with the transformation of the PLESs, the EQI did not change simultaneously but first decreased and then increased, which means that the ecological transformation from the EQI perspective and the KRD transformation were not completely synchronized but rather lagged.
The karst region in southern China is one of the most typical ecologically fragile areas in the world, and its environment is highly sensitive to land use activities. The results indicated that the ES and APS were occupied by IPS and LS, while the PS and LS increased. This finding is consistent with results from other studies conducted in karst areas [83, 86] and resembles findings from various studies in different regions [87]. It is generally believed that crowding and restrictions of ES can result in a decline in the quality of the ecological environment and an increase in ecological vulnerability [46, 49, 86]. Additionally, cultivated land is the key type leading to the evolution of the regional ecological environment [43, 88]. However, the current study has revealed that a reduction in ES does not necessarily mean a weakening of ecological functions and a decline in the quality of the ecological environment. The reasons are closely related to the transfer-in of FES, MES, and WES, particularly the increase in FES and WES resulting from the internal conversion of ES. Previous studies on typical biofragile areas have found that FEL and WEL possess highly significant ecological functions [45, 49], and their increases substantially impact the quality of the ecological environment [89]. These results indicate that optimizing the internal structure of the ES also plays an important role in enhancing the ecological environment.
Although there have been studies on the environmental effects of LUTs in karst mountainous areas, it is difficult for a single characterization method of KRD to cover the diversity and complexity of the ecosystem. The EQI can assess the comprehensive ecological effects of LUTs, but the variable assignment is still subjective. Based on the evolution status of the KRD and EQI, this study explored the ecological effects of small-scale PLES transformation in rural areas in KRD mountainous areas, more accurately described the evolution status of the ecological environment in karst areas, and provided a comprehensive and systematic perspective for systematically understanding and explaining the response of the ecological environment to land use.
Previous studies have shown that areas with low levels of ecological quality are areas with serious KRD, and their LUTs are more active [46]; the current study’s findings partly support this conclusion. This study has revealed that the influence and contribution of LUTs to EQI and KRD changes do not coincide completely and that the range of the KRD improvement area does not completely coincide with the ecological improvement area from the EQI perspective. While part of the land use function transfer causes EQI change, it may not lead to changes in the corresponding regional KRD grade. A decrease in KRD grade (or K value) does not necessarily mean an increase in EQI [46], and some areas with high EQI changes may not have a large variation of K value. The reason may be that the measurement of EQI is based on land ecological differences, whereas the identification of KRD is based on the percentage of bedrock, slope, proportion of vegetation, and soil cover.
Research has shown that PLES transformation has a certain explanatory power for changes in the quality of the ecological environment and is the main driving factor of changes in the quality of the ecological environment. However, due to data acquisition limitations, this study focused on the influence of the explicit transformation of PLESs. It did not consider invisible changes in land use patterns, such as land quality and property rights, which may enhance the explanatory power of the positive ecological effects of LUTs, nor did it analyze the role of external factors, such as climate change, which needs to be further studied in the future [85].
The Driving Mechanism of LUTs
This study has revealed that the IPS, FES, WES, and RLS have all expanded overall, while the MES, APS, and OES have decreased. In essence, as the main users of rural space, villagers‘ space use behavior directly affects changes in rural space land use [32]. Villagers’ land use activities are closely related to changes in the ecological environment, and their behaviors are undoubtedly driven by a series of structural dynamics.
Policies and measures implemented by national and local governments regarding ecological construction and restoration have guided and regulated the transformation of PLESs [8, 41, 45, 84, 91], serving as the direct driving force behind this change [49]. Since the beginning of this century, state and local governments have continued to promote ecological construction and improvement and led the implementation of ecological projects such as returning farmland to forest, closing mountains off to forests, engaging in afforestation, shelterbelt, and soil and water conservation projects, and encouraging the three-year action plan for green Guizhou construction, and issued numerous policies to help guide industrial adjustment and land use. These efforts have facilitated the transformation of meadowlands, farmland, and bare rock landscapes into economic forests and forested landscapes. In conjunction with the implementation of the project to return farmland to forest, local governments have made overall use of funds from various levels and channels, such as agriculture, forestry, animal husbandry, and water resources, to carry out comprehensive improvement in sloping farmland; the development and utilization of karst water resources; and rural energy construction. In particular, positive policy support and guidance have been provided for cultivating characteristic economic forests and fruit trees. The local government actively seeks biological resources suitable for the karst environment of the gorge and provides positive policy support and guidance for the cultivation of the characteristic economic forest fruit industry. These efforts have steered the transformation from traditional grain planting to ecological agriculture, resulting in a land use model that achieves both ecological and economic benefits while promoting the restoration of forest and grass vegetation. Strict control of forest fire prevention has also contributed to the expansion of the FES area.
Changes in the national and local social and economic environments are the key driving forces behind the transformation of PLESs [8, 24, 41, 90]. Implementing the national strategy for urbanization, industrialization, coastal development, and urban-rural integration has resulted in ongoing urban-rural migration [24, 90]. The state encourages the development of new industries and new business forms, such as rural leisure agriculture, rural tourism, and rural e-commerce, in the context of rural revitalization. These initiatives have led to an increasing number of young and middle-aged rural workers transitioning to urban areas and nonagricultural industries while also promoting farmland conversion into meadows and woodlands. A similar process occurred in the study area. Particularly after 2010, ongoing urban and rural migration has alleviated land pressure and contributed to an increase in vegetation. In recent years, the new rural construction implemented by the state over the past ten years, along with the national focus on rural infrastructure during the 13th Five-Year Plan period, has facilitated the ongoing upgrading of infrastructure, such as road traffic and housing; thus, the RLS and IPS areas have continued to expand, leading to encroachment upon some forestland and farmland. Under the guidance of the targeted poverty alleviation strategy, labor exports, the development of ecological industries, large-scale poverty alleviation migration, etc., have further promoted the reduction of village populations and changes in farmers’ livelihood modes, resulting in a decrease in APS. Additionally, regional economic development also drives LUTs. The local government has introduced enterprises to develop the local stone industry since 2005 to promote local economic growth. With industry development, the IPS area’s expansion has continued to accelerate. Some construction has also directly occupied land with low ecological value. Due to the demand for social and economic development in coastal areas, the impoundment of water by the dam at the Dongqing Power Station in the lower reaches of the Beipanjiang River has also significantly increased the water area of the valley section of the Huajiang River.
Natural conditions are the prerequisite and foundation for transforming PLESs [8, 41, 65, 90, 91]. Dry and hot conditions, with steep mountain slopes, barren soil, and short water resources, characterize the study area’s climate. These factors significantly impact the survival and growth of forest vegetation and the effectiveness of vegetation restoration efforts [88]. As the status of vegetation cover changes, the degree of bedrock exposure decreases, climatic conditions improve, and the frequency of natural disasters diminishes. These elements provide conditions for further restoration of the vegetation. The natural ecological environment restricts the selection of restoration species and measures. Choosing vegetation types and restoration measures that match the environment is crucial for the success of PLES transformation [67].
In addition to the abovementioned structural factors, nonstructural factors related to social and cultural factors, such as local subjective initiative, perceptions, attitudes, values, and behaviors, also affect villagers’ land use behavior and the sustainability of the restoration plan.
The ecological restoration model with characteristic economic forests as the core originates from local people’s personal experiences and practices. In the early 1990s, in the face of the harsh environment and food shortage, the local government actively sought a path of governance and made up its mind to change the poor and backward appearance of the area. At this time, a small number of farmers who are good at observing, brave enough to try, and have a strong sense of changing their living state think of change because they are in extreme poverty. After observing the characteristics of pepper’s drought tolerance and good economic benefits, individual farmers took the initiative to communicate with the government cadres in the village, which aroused the interest of the local government in the development of the pepper industry and contributed to the formation of the local government’s governance ideas of “adjusting measures according to the time and place, improving the ecological environment, relying on planting grain to stabilize agriculture, and planting pepper to become rich”.
In the early stage of governance, faced with mobilization and policy support from local governments, many villagers were reluctant to give up food cultivation after assessing the unknown risks they might face in adjusting to land use changes. They tend to use relatively flat and good land to grow food, while some more remote or difficult to cultivate are used to grow peppers or adopt models of interplanting peppers with corn and potatoes. To expand the planting scale, at the beginning of this century, local governments promoted industrial restructuring in conjunction with the national policy of returning farmland to forest and encouraged farmers to plant crops such as zanthoxylum, honeysuckle, and amomum kernels. A small number of local elites have taken the lead in developing the economic forest and fruit industry, formulating village rules and regulations, and participating in the construction and management of mountains and rivers, fields, and forest roads, leading and promoting the adjustment of the land use structure.
After 2005, farmers with large planting scales in the early stage obtained considerable profits. Some villagers’ perceptions of income from eco-agricultural products have changed, and their choice of livelihood strategy has shifted from the traditional planting model to models of ecological agriculture. Owing to their low perceived benefits, amomum, honeysuckle, and other crops were gradually eliminated by farmers, whereas Zanthoxylum eventually managed to survive in the gorge area. More villagers used various policy resources and local resources to spontaneously transform drylands into economic forest fruit, consciously learned the cultivation and management techniques of prickled pepper, and carried out the construction and management of mountains and rivers, fields, and forest roads. Some village cadres and large growers have also studied technology and markets, introduced new pepper varieties for trial planting, and participated in brand building. Attracted by the benefits, some villagers have gone out for work, while others actively seize the employment provided by rural infrastructure projects to obtain income or actively engage in rural tourism, marble mining, and other related livelihoods by relying on village resources. Especially after 2013, fluctuations in Zanthoxum production caused nonagricultural employment to become the livelihood choice of more people. A sense of low value for land made them less dependent on it. With the increase in economic strength, some farmers are taking the initiative to build or renovate houses and improve production and living facilities (such as the selective use of electric and solar energy), expanding settlements and improving the living environment.
The embodiment of local resources and environmental value has changed the concept of the resources and environment of some villagers. The dry and hot climate and bare land, which were previously considered uninhabitable, are gradually regarded as valuable by some people. Some farmers even show interest in the local environmental health value and are becoming more enthusiastic about vegetation restoration activities and ecological agriculture. In the forestland and water resource management process, some village groups have spontaneously implemented the closure of mountains and forest cultivation, strengthened the management of forestland and water resources, participated in community organization and system construction, and strictly prevented deforestation and forest fires. In the economic forest management process, many villagers have spontaneously replanted and replaced them. However, in the promotion of clean energy, such as biogas, solar energy, and energy-saving stoves, villagers have little interest in biogas. In practice, the concepts of self-reliance, hard work, pioneering and innovation, and changing one’s destiny gradually developed and were recognized and promoted by local governments and residents, which in turn influenced people’s awareness and actions.
Some farmers’ hometown complexes have been aroused. The perception of village changes has enhanced some villagers’ confidence in local development, strengthened their sense of identification with their hometown, and fostered hope for the future. Emotional and psychological incentives have enhanced their enthusiasm, initiative, and awareness of innovation and entrepreneurship to protect resources and the environment and maintain their homes. Their attitude toward governance has changed from worry and indifference to support and recognition. Some farmers took the initiative to consider the development plan at the community level and constantly sought the possibility of developing new ecological economic industries that were compatible with the local biophysical environment. They carried out dragon fruit demonstration plantings, introduced trial plantings of new ecological cash crops such as mandarin and loquat, explored market-oriented production, and changed the original resource situation. Some of them were provided with government support after successful trial plantings, which promoted further transformation of the land use mode in the later period. Some farmers use policy resources to start their own businesses and engage in other new forms of rural business.
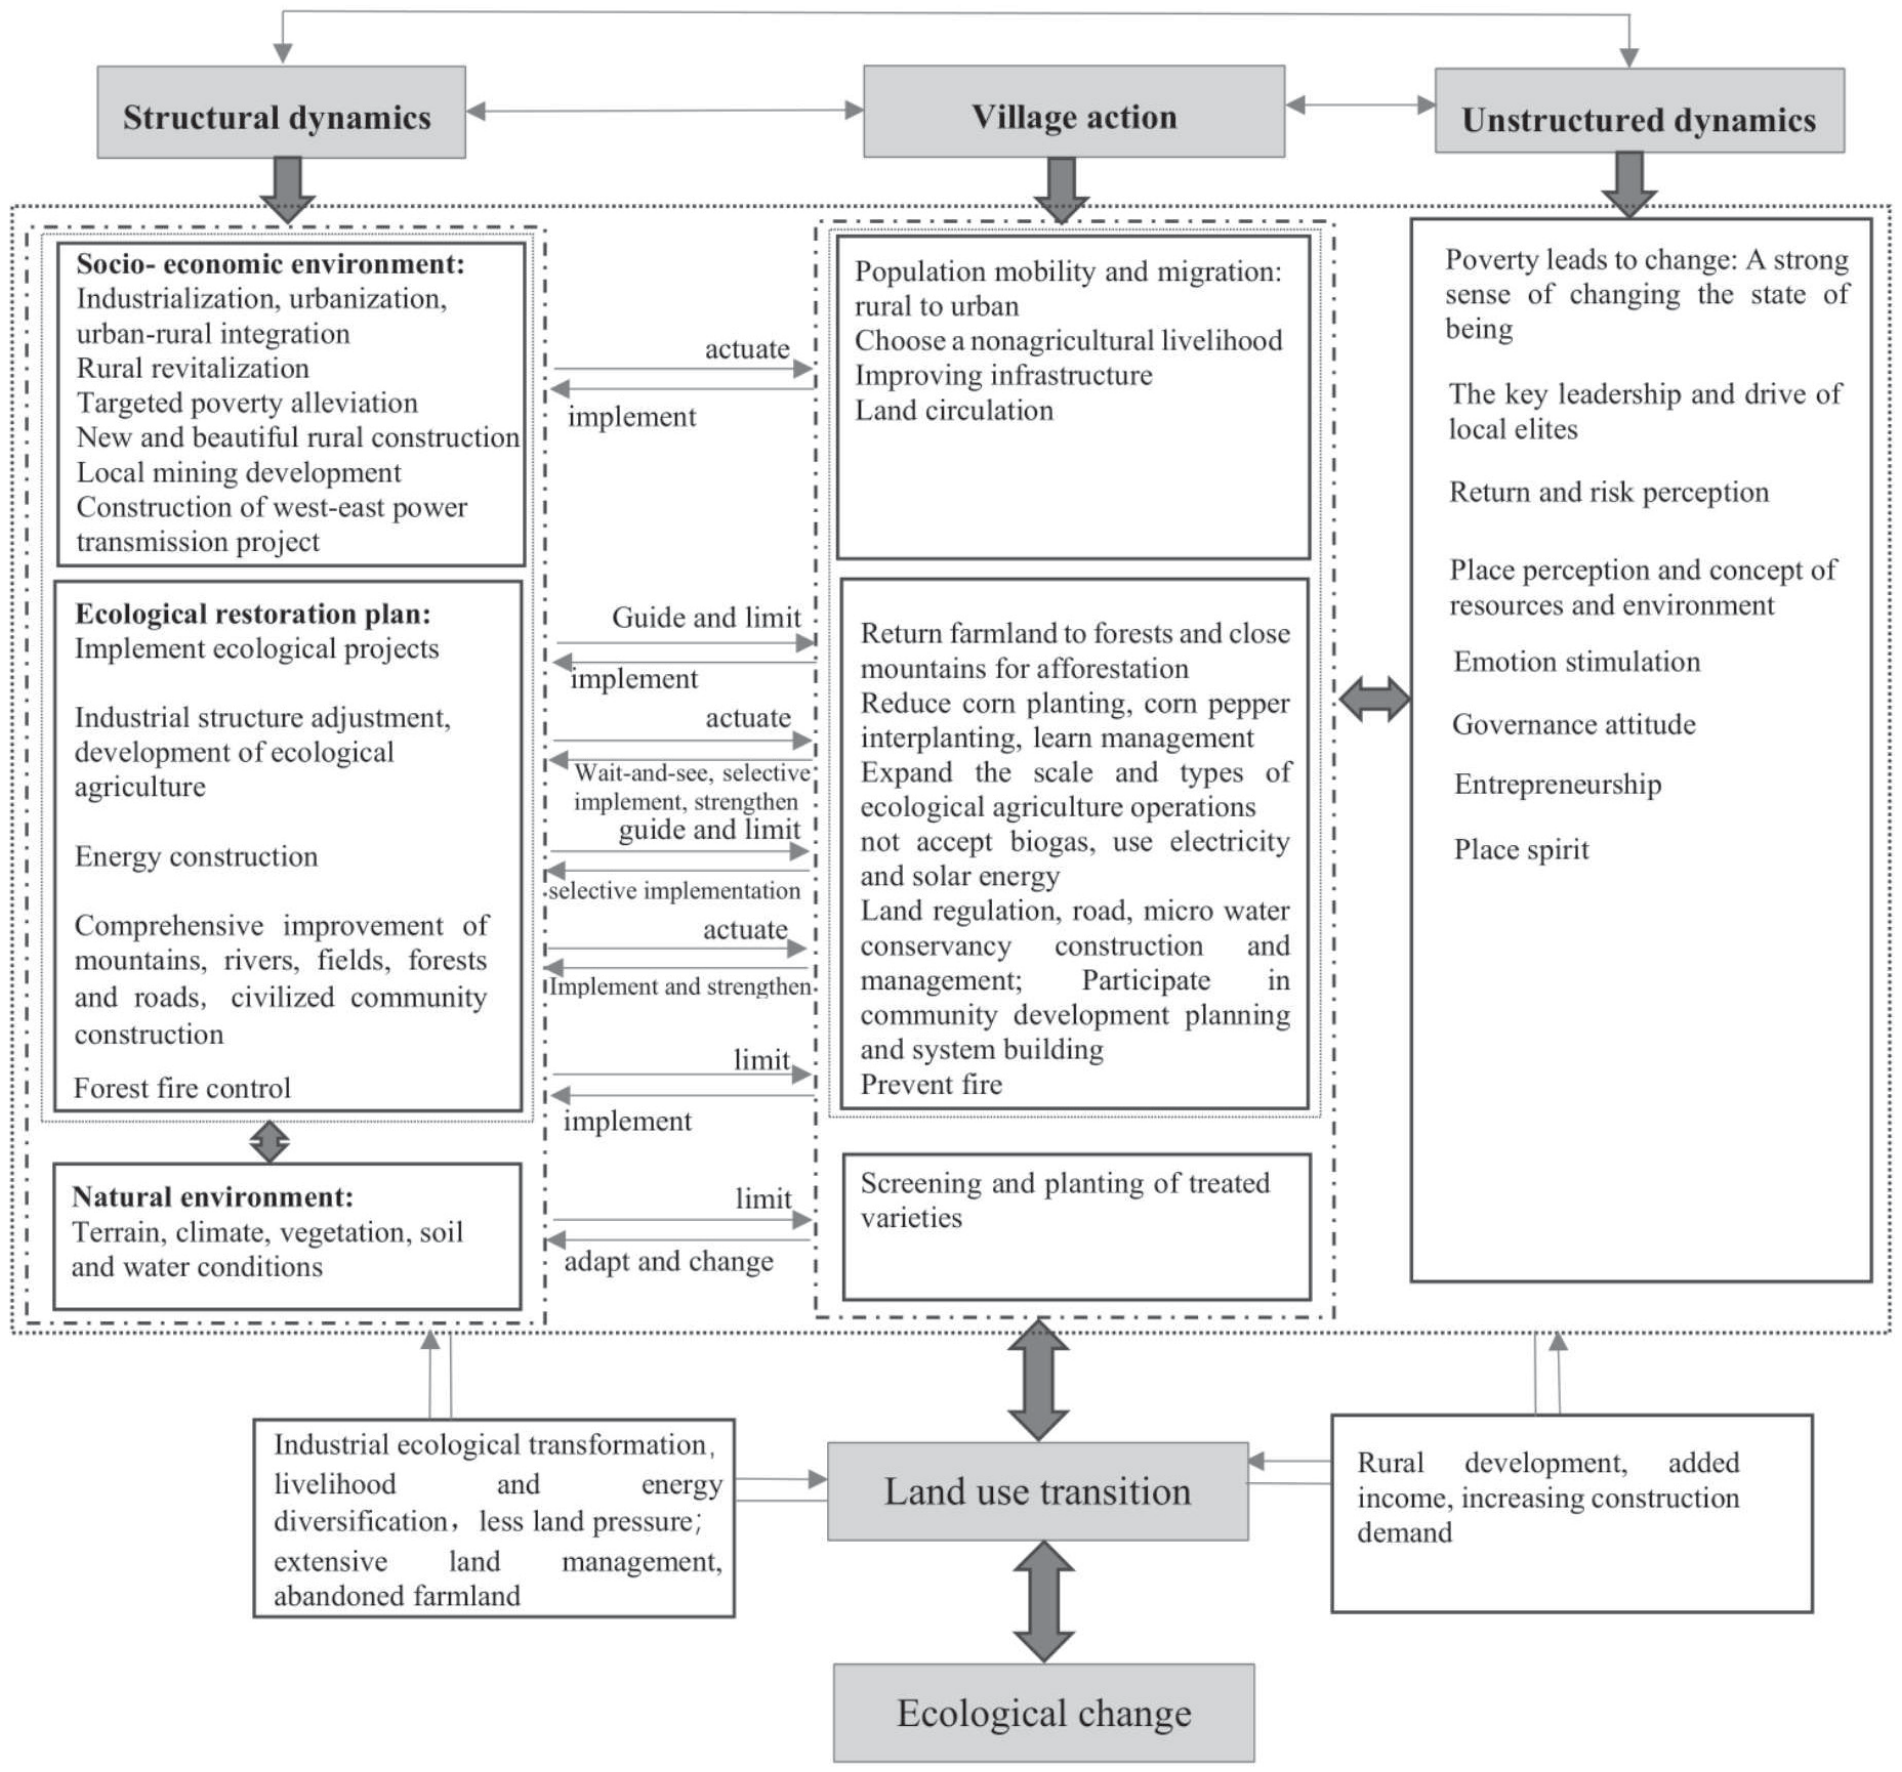
Policy factors, socio-economic factors, and natural factors are indispensable factors that drive PLES transformation. However, the role of nonstructural factors affecting villagers’ behavior cannot be underestimated. Structural factors lead or guide the developmental trend of LUTs to a great extent, but they are essentially rooted in the endogenous change process of the community. Local actors actively use rules and resources such as new ideas, advanced technologies, and development funds provided by structural factors; implement and respond to policies and measures through various practical activities based on the social environment and local space-time environment; and promote the transformation of land use structure. Farmers’ ideas and actions evolve, influencing their decision-making and action logic. Essentially, the PLES transformation is a response to the combined action of structural dynamics, nonstructural dynamics, and villager action (Fig. 7). These elements are not completely separate but interact and stimulate each other. They jointly act on the land use practices of farmers and human-earth relationships, leading to changes in land use mode and function.
Enlightenment of the Transformation of PLESs into the Control of National Space
Although the ecological environment of karst mountainous areas in southwest China has improved significantly, some regions still face contradictions between economic and social development and ecological protection. Our results can help policymakers better understand LUTs and their ecological responses, including the ecological effects and dynamic mechanisms of land use change, when formulating land use policies. Through formulating policies to promote the coordination of production, ecology and life functions, the social and ecological problems caused by unreasonable LUTs can be reduced. In particular, the LUTs in the gorge area effectively promoted ecological restoration and social and economic development. Therefore, it is feasible to promote ecological governance with scientific PLES transformation as the starting point in karst mountainous areas. In the future, the layout of PLESs should be further optimized, especially the internal structure of ES, focusing on protecting and expanding high-quality ES such as forestland, increasing the area of ecological cash crops with high ecological benefits, and promoting the multifunctional use of land. Similar environmental challenges to those in the study area exist in other ecologically fragile areas at home and abroad. Therefore, including ecosystem optimization considerations in national and local land use plans and policies also applies to these areas. Policymakers and environmental managers can start from the driving factors of LUTs, optimize the spatial structure of PLESs by changing the practice of land use change, and explore land use models for the coordinated and sustainable development of social-ecological systems.
Conclusions
Taking the Huajiang Gorge of China as an example, this paper investigates the characteristics of PLES transformation and its eco-environmental response in the karst ecological restoration area and draws the following conclusions:
(1) The transfer-in of PS and LS and the transfer-out of ES constitute the main types of LUTs. The LS expanded significantly, and the dynamic degree strongly changed. ES is widely distributed, and the overall trend is shrinking. The PS first decreased and then accelerated expansion, and the dynamic degree generally remained flat. The conversion types of advantageous land use include internal conversion within ES; the conversion of ES into PS; and the transfer-in of PS and ES into LS. The intensity of LUTs first experienced slow growth but has since significantly increased.
(2) Within the 15-year study period, the ecological environment quality showed an overall improvement trend. The EQI first decreased and then increased, representing an overall increase, and the decrease in the second stage was slower. The KRD continued to improve during the examined period. The area of KRD at all levels decreased, and the area of NKRD continued to increase significantly. The area of improved KRD was much greater than that of deteriorated KRD, and the spatial distribution of low-grade KRD was more concentrated and contiguous. The ecological transformation from the EQI perspective and KRD transformation were not completely synchronized but showed a certain lag.
(3) PLES transformation has significantly impacted the regional ecological environment quality, but the influence and contribution of LUTs to EQI and KRD changes do not coincide completely. The range of the KRD improvement area coincides only partially with the ecological improvement area from the EQI perspective. From the perspective of EQI changes in LUTs, the conversion of OES into MES, that of MES into FES, and that of OES into FES and APS contribute greatly to improving the quality of the ecological environment in different periods. The conversion of MES into OES, APS into IPS, MES, RLS, and FES into RLS are important conversion types that cause the deterioration of regional ecological environment quality. From the perspective of the contribution value of LUTs to KRD, the conversion of OES into MES, that of FES into WES, that of MES into FES and APS, and that of APS into IPS are advantageous conversion types that lead to the improvement in the ecological environment. From the vertical perspective, the main contributors to the improvement in regional KRD are gradual changes from PS to ES. Herein, APS, MES, and FES contributed the most to improving KRD throughout the three stages. In general, herein, the internal conversion within ES and the conversion of ES to PS promoted both the increase in EQI and the improvement in KRD and made the greatest contribution to the improvement of regional ecological environment quality.
(4) PLES transformation is a response to the integrated action of structural and nonstructural dynamics and villager action. The interaction and stimulation of different elements lead to changes in land use practices, modes, and functions in the control area and, thus, the evolution of the ecological environment.

