

Introduction
Global changes can be caused by many factors, among which land use change has gradually become the main determinant [1, 2]. Land use change not only has significant impacts on climate, biodiversity, and hydrology, but also has important implications for urban areas and the daily lives of residents, as well as socio-economic changes [3]. In recent years, the rapid advance of urbanization has led to the evolution of land spatial patterns and the imbalance of economic, social, and ecological environment development. This also exacerbates the seriousness of ecological and environmental problems such as land desertification, soil degradation, and erosion, which have seriously affected the stability of ecosystems. The goal of ecological civilization construction put forward by the 19th National Congress of the Communist Party of China clearly requires intensive and efficient utilization of land space, which means that the development mode of China’s land space has changed from the production space to the coordinated development mode of production-living-ecological space.
Land use change is an important way in which human activities affect ecosystems, directly impacting ecological processes such as the water cycle, biogeochemical cycle, and soil regeneration, resulting in corresponding changes in the structure and service functions of ecosystems, ultimately reflected and characterized by the value of ecosystem services [4]. From a functional perspective, the land is divided into production land, ecological land, and living land, forming an interconnected and unified multi-functional complex [4]. However, the current “Land Use Classification” is divided according to land utilization type, which leads to a serious neglect of the ecological functions of land. Therefore, it is urgent to construct a classification system from the functional perspectives of land and emphasize ecological functions [5, 6]. For these reasons, the concept of production-living-ecological spaces has emerged. It aims to achieve the national land development goals of efficient and intensive production space, livable and moderate living space, and beautiful ecological space. At the current stage, China is in a period of transformation and upgrading, and the conflicts in land use functions and the degradation of ecological functions caused by this transformation are becoming increasingly serious [7]. Based on the concept of sustainable development, the land use pattern will shift from being dominated by production space to a coordinated development of production, living, and ecological spaces [8].
Understanding the impact of land use change on ecosystem services is crucial for the formulation and implementation of land use policies and for the sustainable development of ecosystems [9]. The Millennium Ecosystem Assessment released by the United Nations in 2005 defines ecosystem services as the benefits and well-being that humans directly or indirectly obtain from ecosystems [10], and their formation, supply, and distribution are profoundly influenced by changes in land use/land cover. As the foundation for human survival and development, land plays a significant role in food security, ecological security, and other aspects, creating a wealth of ESVs for humans, including provisioning values (food, raw materials, and water resources), regulating values (environmental purification, gas, climate, and hydrology), supporting values (soil, nutrient cycling, and biodiversity), and cultural values (aesthetic landscapes) [11]. However, inappropriate land use changes can jeopardize the supply and demand balance of regional ecosystem services, leading to ecosystem degradation, biodiversity loss, and deteriorating water quality, further resulting in a significant decline in the value of ecosystem services [12, 13]. Therefore, exploring the relationship between ESVs and land use change is of great significance for maintaining ecosystem security and the sustainable use of land resources.
The relationship between land use and ESV has been studied at different scales, such as national, provincial, municipal, urban agglomeration, and watershed scales. In this process, a variety of ecosystem service analysis models were developed, such as ecological service value (ESV), Environmental Quality Index (EQI), Ecosystem Services, and Tradeoff Integrated Assessment (InVEST), to explore the spatiotemporal dynamic characteristics of ecosystem service value changes in land use change. In addition, domestic and foreign scholars also applied multiple regression analysis, sensitivity analysis, logistic regression models, P-S-R models, etc. to quantitatively study the impact of land use change on the value of ecosystem services [14]. The research on the impact of land use on the ESV mainly falls into two categories: qualitative and quantitative. Qualitative research mainly describes the impact of land use on ESV. For example, Zhang et al. [15] found that the changes in ESVs are mainly caused by changes in land use patterns. Hu et al. [16] found that land use intensity is generally negatively correlated with ecosystem services. While quantitative research mainly focuses on the relationship between land use and ESV. Li and Zhang [17] used granular deduction and spatial autocorrelation analysis to study the spatial correlation between land landscape fragmentation and ESV. Xu et al. [18] constructed an optimized ESV assessment model to analyze the spatial distribution characteristics and change trends of ESV in Gansu Province. In addition, scholars have also used mathematical statistics methods such as multiple regression analysis, sensitivity analysis, and logistic regression models to quantitatively study the impact degrees of land use changes on ESV [19, 20]. Compared with foreign countries, the research on ESV in China started relatively late, while domestic scholars are continually exploring the ESV theory and accounting methods for suitable home regions and accumulating rich research experience.
As the contradiction between population, resources, and environment escalates globally, the impact of land use change on ecosystems is also intensifying. Some scholars have applied the CLUE-S model, CA-Markov model, and FLUS model to study the future changes in land spatial patterns under multi-scenario simulation. In order to find a reasonable distribution model for land space utilization planning and ecological security control. In addition, some scholars have studied the ecological risk of land use change from the perspective of landscape ecology. This study mainly starts with landscape pattern assessment, and the landscape ecological index is applied to reflect the ecological effects of land use and land cover change from the perspective of landscape ecology. The land model based on the landscape view is more suitable for evaluating the ecological risk caused by human activities. However, most of the existing studies focus on the construction and spatial analysis of landscape ecological risk models and lack of research on landscape ecological risk and land use change process and time process, which leads to the decline of credibility and applicability of risk assessment results.
Ecological protection and high-quality development in the Yellow River Basin are related to China’s social development, which has risen to a major national strategy. As one of the most important grain-producing areas and agricultural core production areas in China, the frequent human activities and the rapid expansion of production and living space in the lower Yellow River have resulted in the significant reduction of ecological space and the fierce conflict of land space. A sharp contradiction has occurred between resources, environment, land use, and rapid industrialization and urbanization in this region. Some scholars have studied the spatiotemporal changes in land use and the cross-sensitivity with ecosystem services in the lower Yellow River [21–23], but stopped short of the ESV and its driving factors under land use change from the perspective of production-living-ecological spaces. To bridge this research gap, this study analyzed the temporal and spatial dynamic changes of land in the lower Yellow River based on five phases of land remote sensing data and discussed the changes in ecosystem service value caused by land change and its influencing factors.
The aims of this paper are to: (1) Study the spatial-temporal dynamic variations of production-living-ecological spaces land use in the lower Yellow River; (2) Research the response of ESV to production-living-ecological spaces land use; (3) Apply the geographic detectors to analyze the main influencing factors from both natural and socio-economic aspects; (4) Provide a reliable theoretical basis for promoting ecological protection and high-quality social and economic development in the lower Yellow River.
Experimental
Study Area
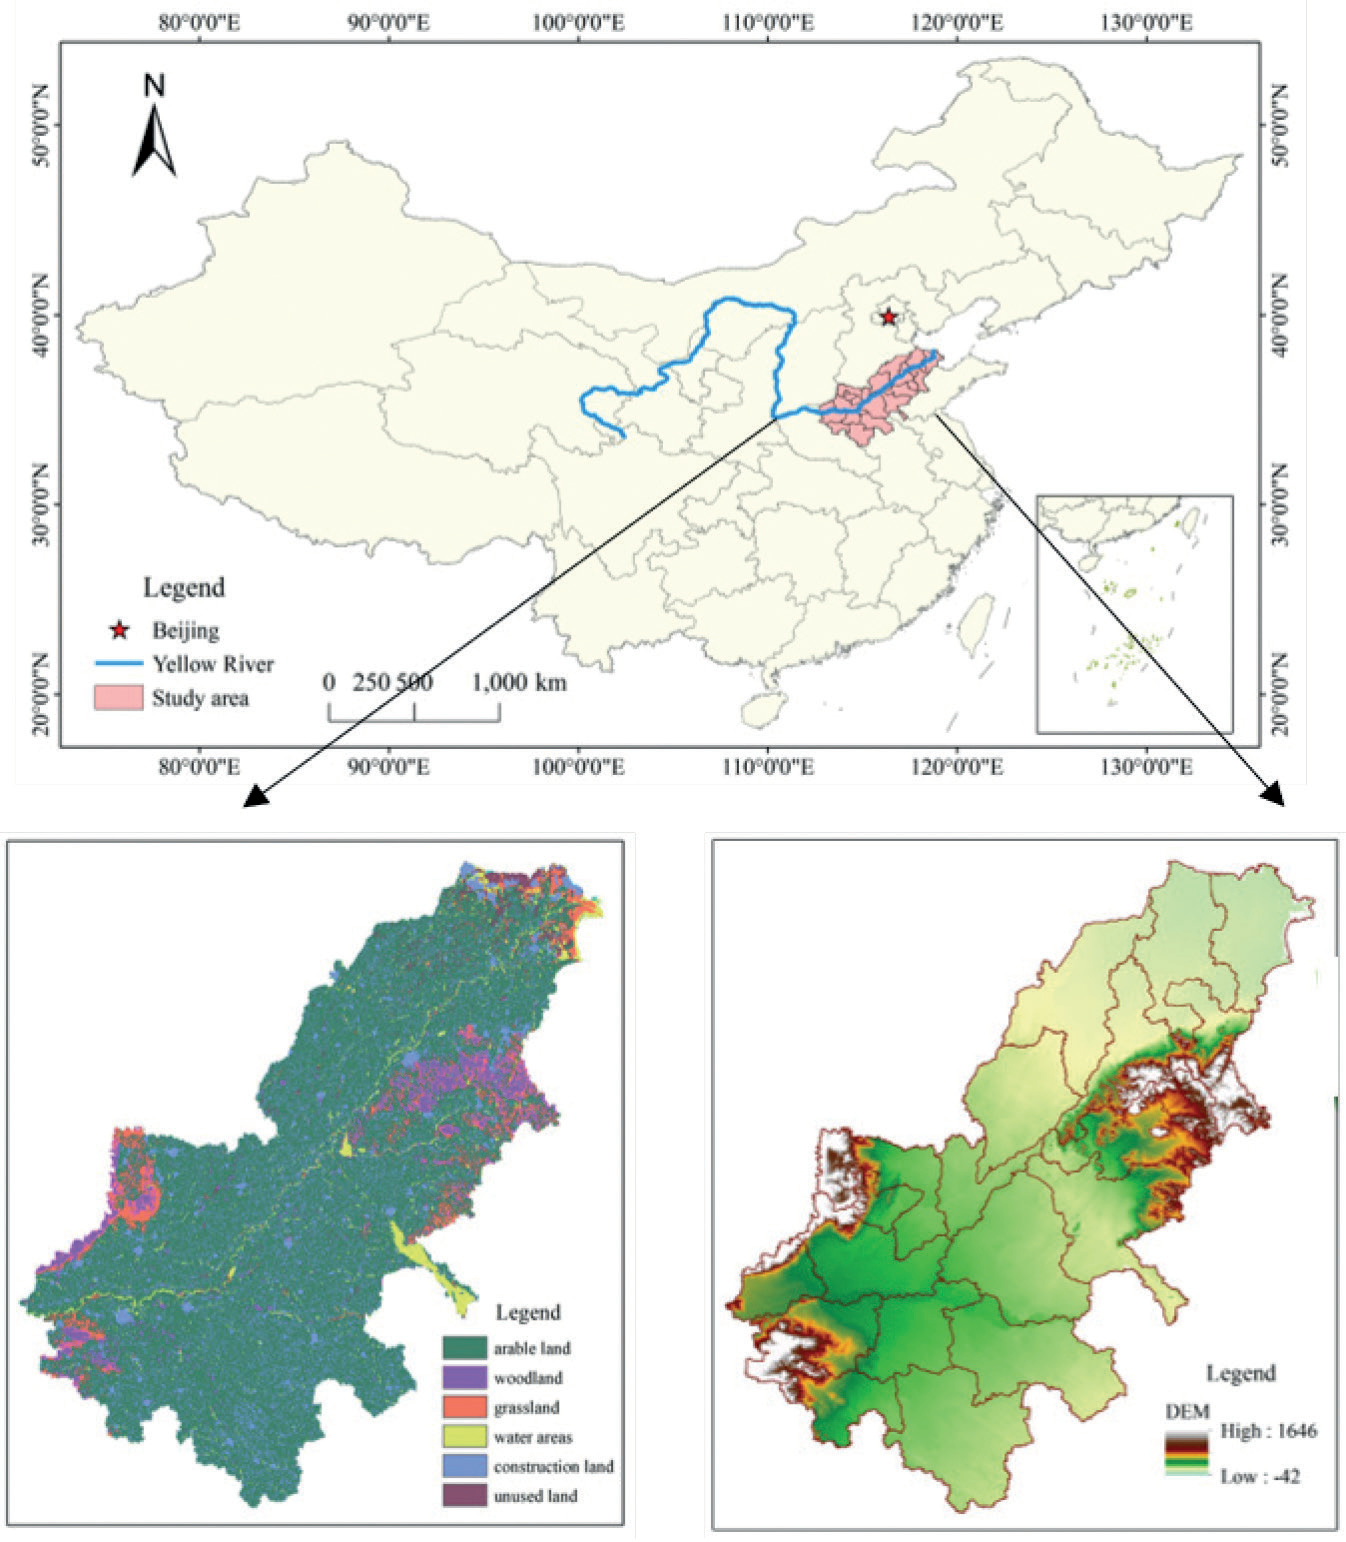
The lower Yellow River refers to the area from Taohuayu in Zhengzhou City, Henan Province, to the river mouth, including 10 cities in Henan Province and 9 cities in Shandong Province. The climate belongs to a warm monsoon climate, with a hot and rainy summer and a cold and dry winter. The basin covers an area of 23,000 km2, accounting for only 3% of the total basin area, with a river length of 785.6 km and a drop of 94 m. The lower reaches of the river traverse the North China Plain, with most of the river sections restricted by embankments. Due to a large amount of sedimentation, the riverbed keeps rising with the passage of years, and the riverbed is 3–5 m higher than the ground, making it a famous “hanging river” in the world. Due to multiple breaches in the lower Yellow River, serious problems such as soil salinization and desertification have occurred, accompanied by ecological environment deterioration such as drought, waterlogging, and poor drainage. Against the background of rapid urbanization and industrialization, frequent land circulation and increased ecological vulnerability in the lower Yellow River have posed a serious threat to regional ecological security. The schematic diagram of the study area is shown in Fig. 1.
Data Sources
This study selected land use data for the years 2000, 2005, 2010, 2015, and 2020, obtained from the Resource and Environment Science and Data Center of the Chinese Academy of Sciences (https://www.resdc. cn/). The land use classification mainly comprises 6 primary categories and 25 secondary categories. Social and economic data from 2000 to 2020, including GDP, population, and the main grain crops in the lower Yellow River, such as planting area, yield per unit area, and purchase prices, were obtained from the “Henan Statistical Yearbook” (https://www.henan.gov.cn/), “Shandong Statistical Yearbook” (http://www.shandong. gov.cn/), and “Compilation of National Agricultural Cost and Benefit Data”(https://www.stats.gov.cn/). Temperature and precipitation data are acquired from the China Meteorological Data Network (https://data. cma.cn/). Slope direction and slope data are extracted from elevation DEM data, sourced from the Geospatial Data Cloud System (https://www.gscloud.cn/).
Study Methodologies
Construction of the Production-Living-Ecological Spaces Classification System
Production-living-ecological spaces refer to production space, living space, and ecological space. Ecological space is the territorial space that provides ecological products and services with ecological protection functions and stable macro-states required for the survival and reproduction of species. Living space is the land-use space for daily living, consumption, leisure, and entertainment. Production space is the specific functional area for human production, transportation, trade, and public services of material products. According to the “LUCC classification system” of the Chinese Academy of Sciences’ land resources classification system, land use types were reclassified into 6 major categories: arable land, woodland, grassland, water area, construction land, and unused land. Based on the dominant function of land use, the 6 land use categories were further classified into 4 major categories: ecological land, ecological production land, production ecological land, and living production land [24, 25]. Ecological land mainly includes water areas and unused land, ecological production land includes woodland and grassland, production ecological land mainly refers to arable land, and living production land mainly refers to construction land.
Land Use Transfer Matrix
The land use transfer matrix is derived from system analysis and is used to quantitatively describe the feedback relationship between system states and state transitions, reflecting the transition process of system states from time T to time T+1 [6]. The land use transfer matrix can not only describe the characteristics of different land use areas over a period but also calculate the transfer areas and directions of various land types in the initial and final periods. Table 1 shows the general form of the land use transfer matrix [14].
Ecosystem Service Valuation Accounting
Geography, ecology, and economics were integrated by Costanza [26, 27] in their study on ecosystems, then proposed principles and methods for assessing the value of ecosystem services and established a comprehensive ecosystem service valuation model [28]. The evaluation of ecosystem service functions is focused on specific spatial and temporal scales, and global-scale assessments are insufficient to meet the needs of national and regional decision-making. Xie Gaodi et al. [29, 30] made corresponding modifications to the value equivalent factors in the original model based on the actual situation of land use in China and developed an ESV equivalent table that is suitable for Chinese national conditions (Table 2). This paper calculates the ecosystem service value of the lower Yellow River with reference to the above calculation methods. The grain output data of each year were obtained by consulting the China Statistical Yearbook, Shandong Statistical Yearbook, Henan Statistical Yearbook, and other relevant reference, and the grain output was calculated according to 1/7 of the market economic value of the average grain output per unit area. The final grain yield of the lower Yellow River from 1990 to 2020 is 4863.76 kg/hm2. Taking the average price of wheat, corn, and rice in 2020 as the actual price of grain, the average price of grain is 2.44 CNY/kg. The economic value of a single equivalent factor is 1634.47 CNY/hm2, calculated by formula (1); the ecosystem service value coefficient of the lower Yellow River was calculated according to formula (2); and then its ecosystem service value was calculated according to formula (3).
Table 1.
General form of land use transfer matrix.
| T1-T2 | A1 | A2 | ... | An |
|---|---|---|---|---|
| A1 | P11 | P12 | ... | P1n |
| A2 | P21 | P22 | ... | P2n |
| ... | ... | ... | ... | ... |
| An | Pn1 | Pn2 | ... | Pnn |
[i] Note: T1 and T2 represent the initial and final periods, respectively; Pij represents the area or proportion of the conversion from the ith land use type to the jth land use type within the period, and Pnn represents the area or proportion of the nth land use type that remains unchanged within the period; An represents the area of the nth land use type.
Table 2.
The value equivalent table of unit area ESV in China’s terrestrial ecosystem.
The main calculation formulas are as follows:
Where Ea is the economic value of A single equivalent factor in the study area (CNY /hm2), A is the local average grain price, and Q and Q0 are the grain output per unit area in the study area and nationwide (kg/hm2), respectively. VCi is the ecosystem service value per unit area of the i national space (CNY/hm2). ECif is the f ecosystem service value of the i national space, Ai is the area of the i national space (hm2), and ESV is the ecosystem service value of the study area (100 million CNY).
Table 3.
Land use transfer matrix of the lower Yellow River from 2000 to 2020 (×104 hm2).
Geographic Detector
The geographic detector can be used to analyze the spatial differentiation features and explore the interaction between factors, which is convenient to operate and less affected by the sample size. Geographic detectors mainly include risk, factor, ecology, and interaction types, in which factor geographic detectors can reveal the explanation of independent variables to dependent variables. The calculation formula of this method is as follows:
q represents the index of influencing factors of land use change; n represents the number of global samples; Nh represents the number of secondary region samples; h stands for factor stratification; δ2 represents the total variance for the entire region; δ2 represents the second-order regional discrete variance. The value range of q is [0,1], and the greater the value of q, the greater the influence on land use change.
Results and Discussion
Temporal and Spatial Changes of Production-Living-Ecological Spaces
Temporal Changes in Land
The land use transfer matrix can effectively quantify the mutual conversion of various land use types, which helps to demonstrate the quantity structure characteristics and conversion direction of land use in a certain period [31]. As shown in Table 3, the mutual conversion frequency of various land use types in the lower Yellow River is relatively high from 2000 to 2020. Grassland is mostly converted to arable land, with a conversion area of 26.44×10⁴ hm2; arable land is mostly converted to construction land, with a conversion area of 153.96×10⁴ hm2; the conversion areas of other types of land are relatively small.
Based on the classification system of production-living-ecological spaces and the land use transfer matrix model, the change trends in 2000, 2005, 2010, 2015, and 2020 were calculated (Table 4). It indicates production ecological land decreased by 46.28×10⁴ hm2, with a change rate of -4.30%; the ecological production land decreased by 31.55×10⁴ hm2, with a change rate of -22.84%; the living production land increased by 70.02×10⁴ hm2, with a change rate of 32.57%; the ecological land increased by 7.81×10⁴ hm2, with a change rate of 11.48%.
The reasons for these changes are as follows: In recent years, with the rapid development of the Chinese economy and the acceleration of urbanization, the number of cities and population scale in China has rapidly increased, leading to the expansion of urban land area and the occupation of some arable land, forest land, and grassland, resulting in decreases in production ecological land and ecological production land and an increase in living production land. The increase in ecological land is related to many laws and regulations issued by the Shandong governments to protect wetlands, which has led to the lake areas, wetlands, and coastal areas increasing in some regions.
Spatial Changes in Land
The land types in the lower Yellow River were divided into cultivated land, forest land, grassland, water area, construction land, and unused land, and the spatial transfer changes of land types in different time periods were analyzed. As can be seen from Fig. 2, from 2000 to 2010, the area of cultivated land converted into construction land was the largest, about 1774 km2. In addition, woodland, water, and unused land are also partially transferred to construction land. It shows that the expansion of urbanization and the government’s insufficient attention to cultivated land has led to the expansion of construction land area and encroachment on other land types. From 2010 to 2020, the area of cultivated land transferred to construction land was 18521 km2, accounting for 17.4% of the total cultivated land, indicating the further rapid expansion and widespread distribution of urbanization. At the same time, the state has implemented the policy of protecting and replenishment of cultivated land, and about 13,868 km2 of construction land has been transformed into cultivated land, indicating that under the guidance of the national macro-control policy, China’s cultivated land area must be kept above the red line of 120 million hectares in order to ensure China’s food security. The area of cultivated land and construction land converted into water is 2387 km2 and 1353 km2, respectively, and it is mainly distributed in the coastal area. From the perspective of the whole period, the area of various types of land transferred to construction land in the lower reaches of the Yellow River from 2000 to 2020 is the largest, 21,539 km2, among which the area of cultivated land transferred to construction land is 197,00 km2. Secondly, under the implementation of the cultivated land protection policy, the area transferred to cultivated land increased by 20,279 km2, and the area transferred to cultivated land of woodland, grassland, water area, construction land, and unused land accounted for 7.73%, 12.85%, 8.80%, 65.75%, and 4.88% and was evenly distributed in space. The water area mainly from the transfer of cultivated land increased by 48,92 km2 and was distributed in the coastal areas and near the tributaries of the Yellow River.
Table 4.
Changes of production-living-ecological spaces in the lower Yellow River.
From the perspective of the change process, the land use type changes in the lower Yellow River are complex. Land use was relatively stable from 2000 to 2010, with about 97% of the land area remaining unchanged. The changed land is mainly the new construction land, which is derived from the urbanization expansion. At the same time, relying on marine resources, many ports and salt farms were built. From 2010 to 2020, land use has changed dramatically, accounting for more than 34% of the total area. The newly added arable land is mostly distributed along the Yellow River and estuary, while the newly added construction land is mainly distributed around cities and towns, and the newly added water area is concentrated in coastal areas.
From the perspective of production-living-ecological spaces, the area of production ecological land is the largest, followed by ecological production land, and the area of living production land is the smallest. The lower Yellow River is located in the middle and eastern part of the North China Plain, with fertile soil and mainly dryland agriculture, so the production of ecological land accounts for the largest proportion. Ecological production land is mainly distributed in the Taihang Mountains in the northwest of Henan Province and the mountainous and hilly areas in the northeast of Shandong Province. Ecological land is mainly distributed in lakes, wetlands, and coastal areas in Shandong Province. Living production land is scattered, mainly distributed in economically developed urban areas, and radiates outward from these areas. Overall, the land use structure in the lower Yellow River is production ecological land > living production land > ecological production land > ecological land.
The Response of ESV in the Lower Yellow River
Temporal Changes in ESV
Through the calculation of ESV in the lower Yellow River, it was found that the overall trend of ESV in this region showed a fluctuating upward trend from 2000 to 2020. Since living production land mainly consists of construction areas, it is difficult to establish a unified evaluation standard due to the impacts of socio-economic factors and institutional policies. Therefore, the ESV of living production land is not evaluated in this study. The focus of this paper is on analyzing the trends in ESVs of productive ecological land, ecological production land, and ecological land. As shown in Table 5, from 2000 to 2020, the ESV in the lower Yellow River increased by CNY 4.67 billion with a change rate of 2.15%. The service value of productive ecological land decreased by CNY 6.024 billion with a change rate of -4.33%; the ESV of ecological production land decreased by CNY 7.81 billion with a change rate of -18.26%; and the ESV of ecological land increased by CNY 18.51 billion with a change rate of 51.87%. The increase in ESV of ecological land was mainly contributed by the expansion of the water area.
Fig. 2.
Land use spatial changes of the lower Yellow River (a) 2000–2010, (b) 2010–2020, (c) 2000–2020. In the legend, 1, 2, 3, 4, 5, and 6 respectively represent the six land types of cultivated land: forest land, grassland, water area, construction land, and unused land; 12 represents the land area that was converted from cultivated land to forest land, and others are similar.
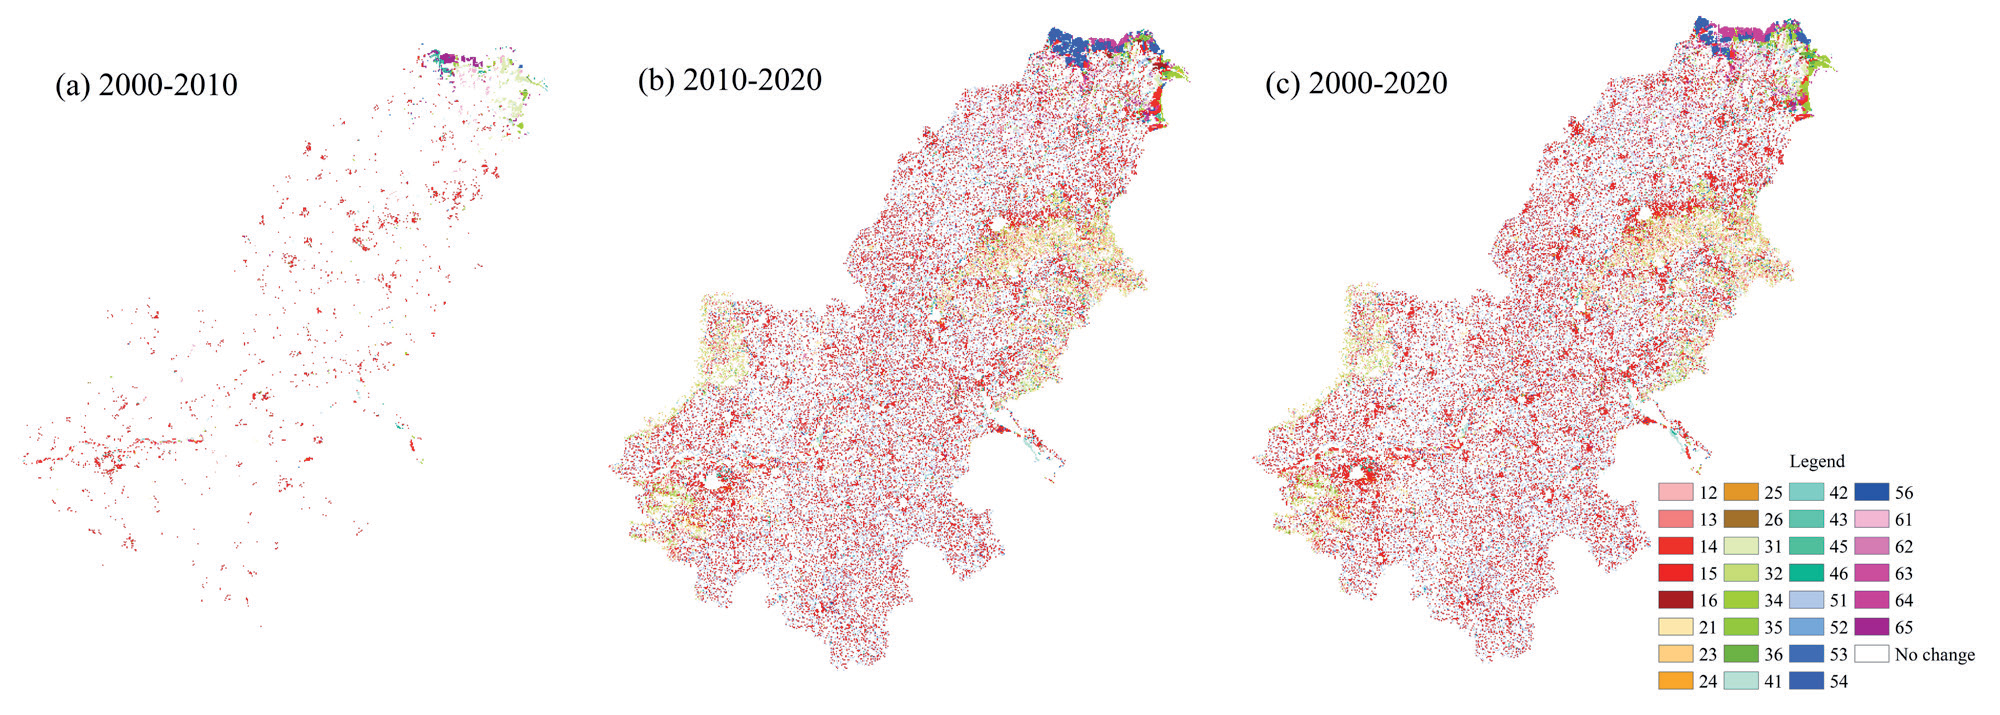
Table 5.
ESV Changes of production-living-ecological spaces in the lower Yellow River from 2000 to 2020.
Looking at the changes in the value of individual ecosystem service functions (Table 6), soil conservation in the lower Yellow River has the highest value, reaching CNY 43.84 billion in 2020. The ecosystem service function with the lowest value is raw material production, which was only CNY 9.95 billion in 2020. The increasing ecosystem service functions in the lower Yellow River include water conservation, aesthetic landscape, and soil conservation. Among them, water conservation has the largest change, with a value change of CNY 6.15 billion and a change rate of 17.99%; followed by aesthetic landscape, with a value change of 1.07 CNY billion and a change rate of 11.07%; and then waste disposal, with a value change of CNY 4.34 billion and a change rate of 10.97%. The decreasing ecosystem service functions include gas regulation, soil conservation, raw material production, climate regulation, food production, and biodiversity, which decreased by CNY 1.44, 2.34, 0.64, 1.00, 0.76, and 0.71 billion, respectively. Overall, the total ESV in the lower Yellow River shows a fluctuating upward trend from 2000 to 2020.
Spatial Changes in ESV
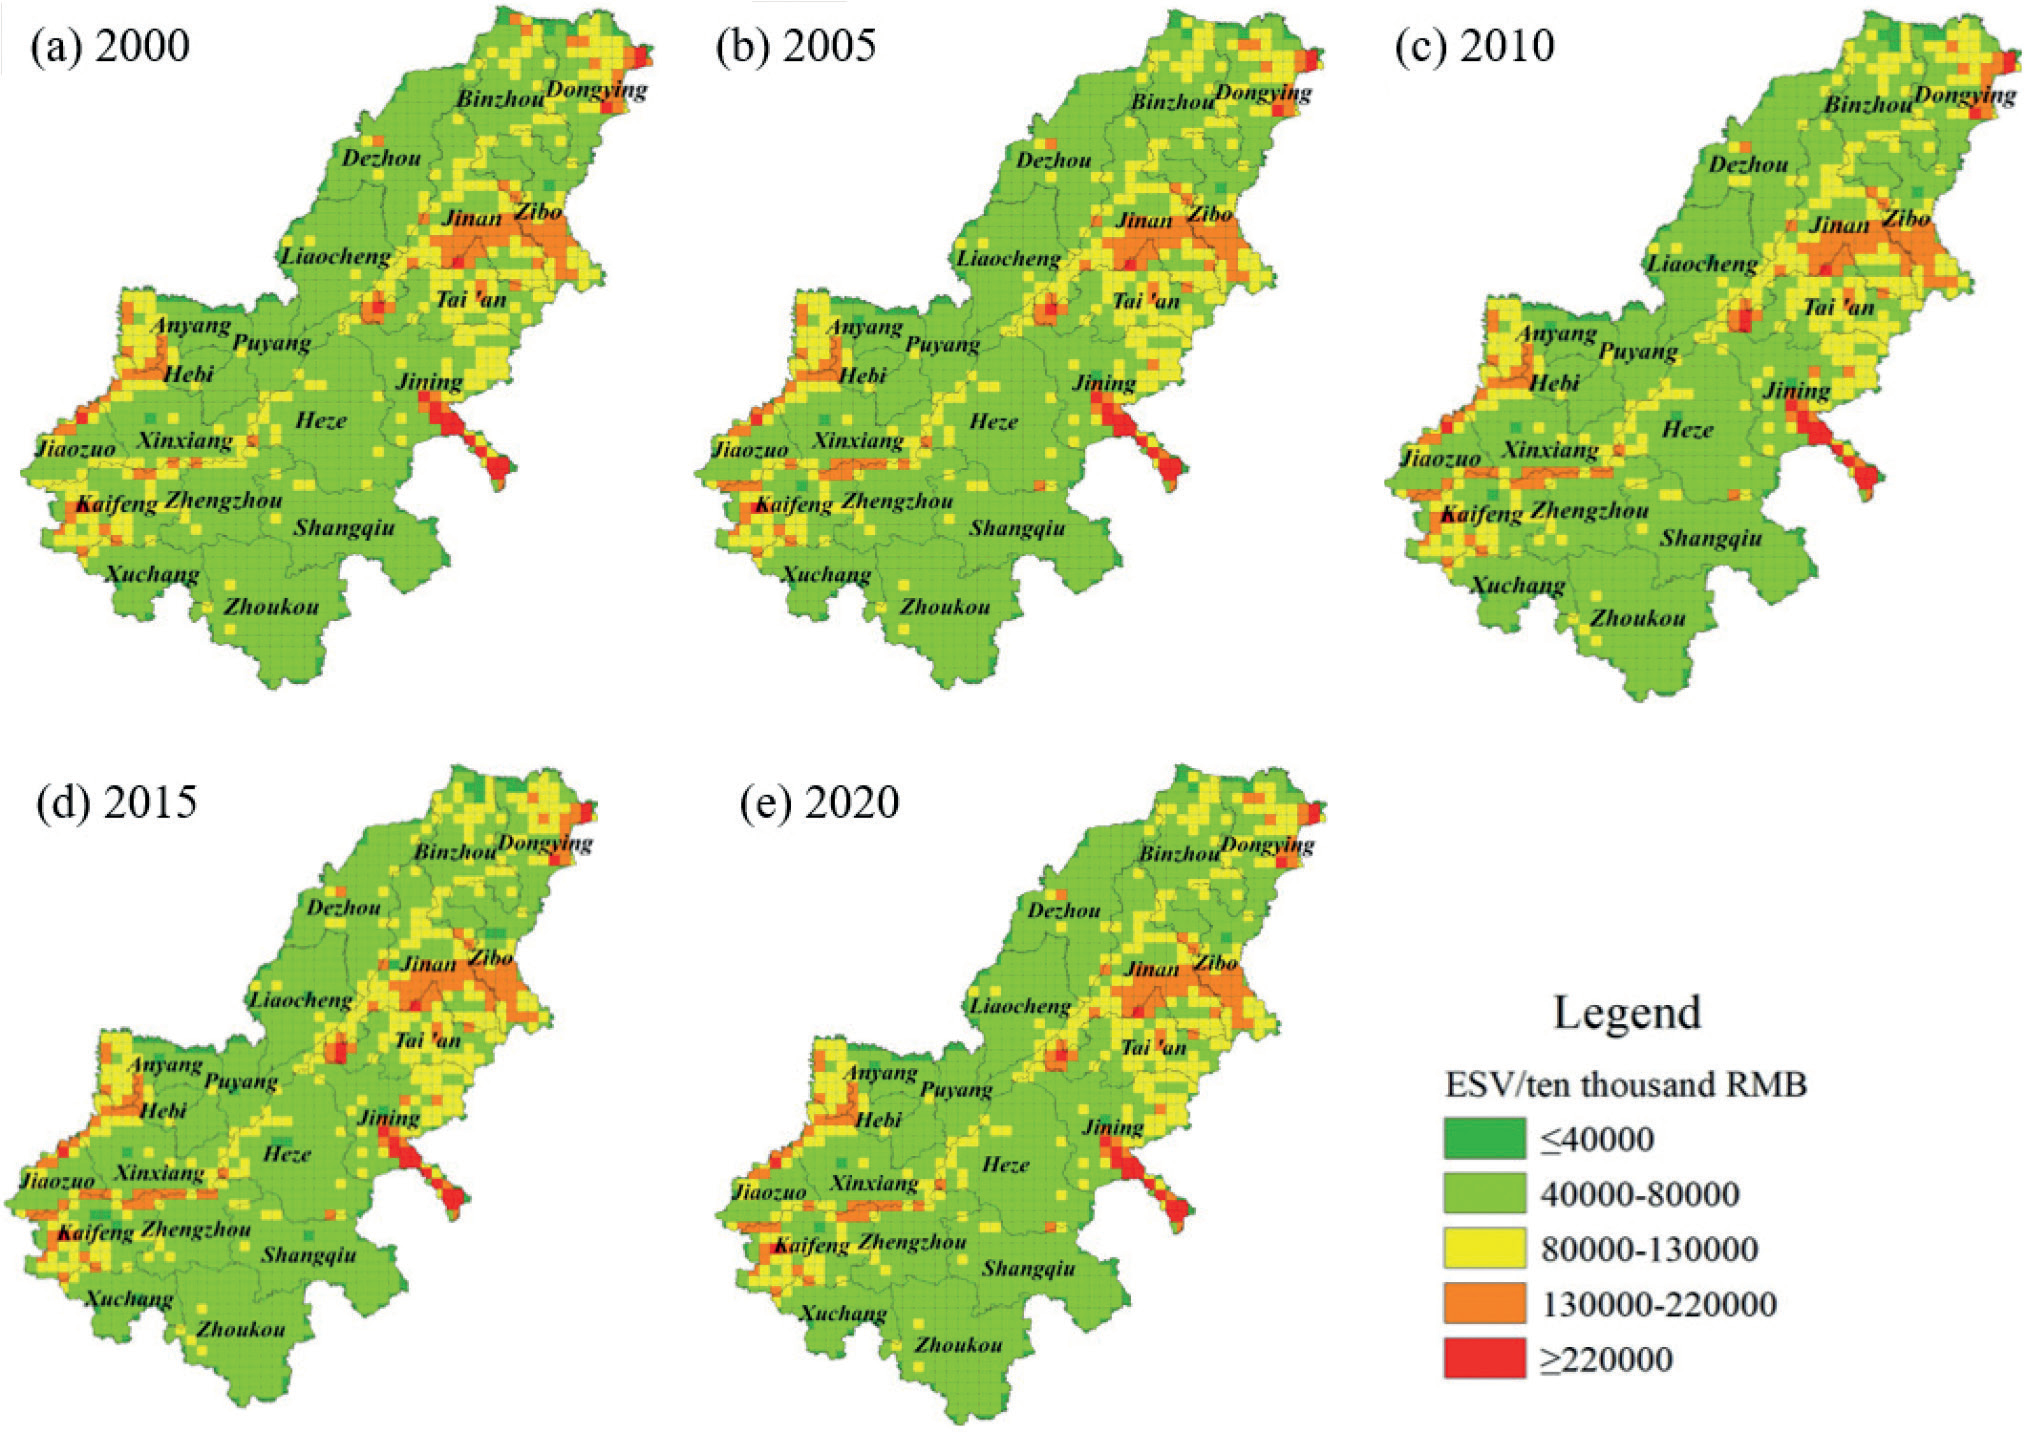
The spatial distribution of ESVs in the lower Yellow River is visualized in Fig. 3. Due to the highest ESVs provided by rivers, wetlands, and forests, the areas with the highest ESVs are mainly located in the northeast of Shandong Province, including Binzhou, Dongying, and Jining, where there are large water and wetland areas [32]. These areas have abundant water resources and then have the highest ecological quality. In total, the ESVs in this region decreased first and then increased during 2000–2020. The areas with the higher ESVs are mainly distributed in the mountainous and hilly areas in the central part of Shandong Province and the northwest of Henan Province. The northwest of Henan Province is dominated by Taihang Mountain, with large amounts of forests and grasslands, resulting in higher ESVs. The central and eastern parts of Shandong Province have hills and mountains, as well as good wetlands such as Weishan Lake, with abundant forest and water resources, resulting in higher ESVs. From 2000 to 2020, the ESVs in the central and eastern parts of Shandong Province showed an increasing trend, while the ESVs in the northwest of Henan Province showed a decreasing trend. The remaining areas are flat, mainly consisting of farmland, with low forest coverage and limited water areas, resulting in low ecological advantages and low ESVs. Overall, the spatial distribution of ESVs in the lower Yellow River shows a “higher in the northeast and lower in the southwest” pattern.
Table 6.
Values of individual ecosystem services in the Lower Yellow River from 2000 to 2020.
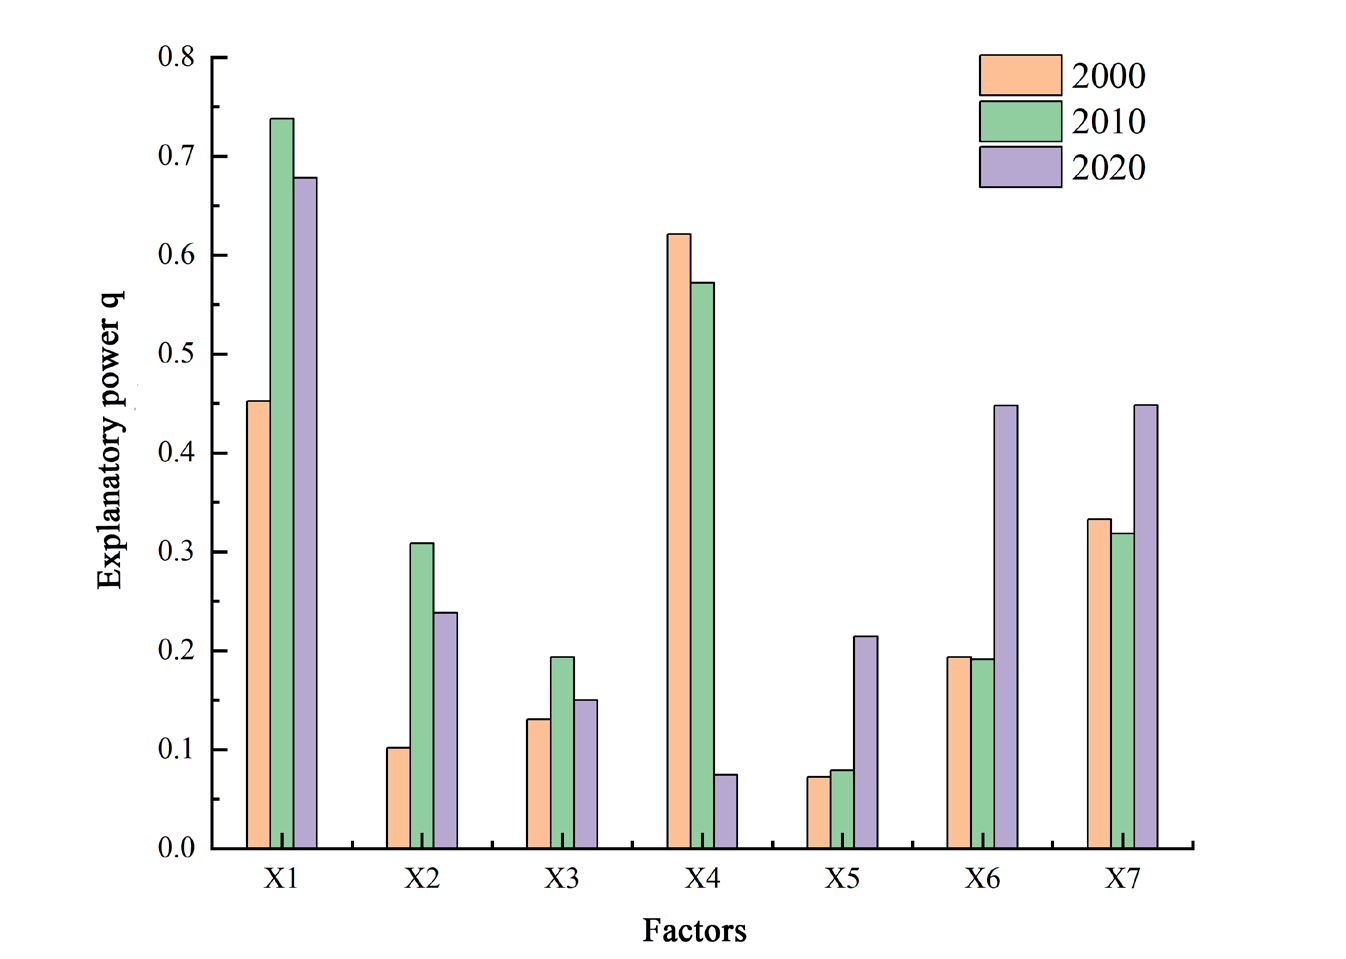
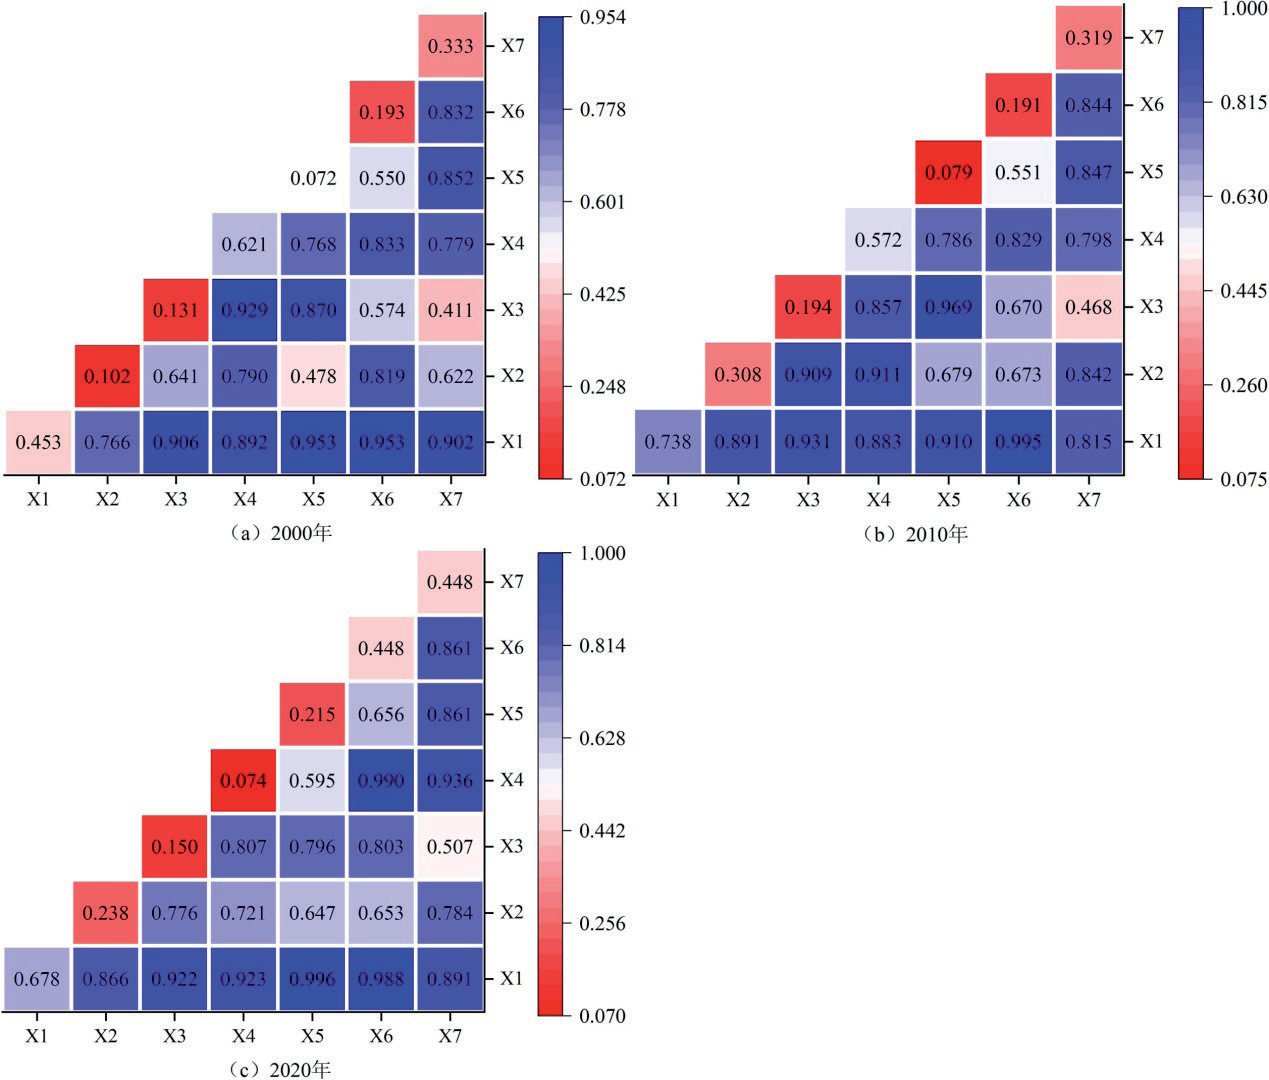
The ESV change of land use is a dynamic development process, and its driving factors include natural factors and social factors [33]. Seven driving factors were selected in this paper, including total population (X1), precipitation (X2), temperature (X3), GDP (X4), elevation (X5), slope grade (X6), and slope direction (X7). Firstly, the driving factors are analyzed by grid visualization, and the factors are reclassified by the natural breaks method. Secondly, a fishing net with a size of 1 km×1 km was created, and the center of each grid was sampled. Finally, the raster data of 7 driving factors are extracted according to the sampling points, and the results are imported into the geographic detector model for calculation.
Factor Detection Analysis
Factor detection mainly reflects the individual impact of each factor on the ESVs [34, 35]. The results of factor detection for the lower Yellow River in 2000, 2010, and 2020 are shown in Fig. 4. It shows that the q-value of total population is the highest, with values of 0.45, 0.74, and 0.68 in 2000, 2010, and 2020, respectively. The q-value of elevation is the lowest, with values of 0.07, 0.08, and 0.21 in 2000, 2010, and 2020, respectively. In general, the influence degree of each factor on ESV from 2000 to 2020 is as follows: total population > GDP > slope direction > slope grade > precipitation amount > temperature > elevation. It displays that total population and GDP reflecting the socioeconomic development conditions have a greater impact on the ESV, while slope grade, slope direction, precipitation, temperature, and elevation reflecting natural conditions have a smaller impact on the ESV. This indicates that the rapid development of urbanization and industrialization, population growth, and changes in spatial patterns have a certain impact on land use types in the lower Yellow River and then affect the ESVs of the whole region.
Interaction Detection Analysis
Interaction detection mainly reflects the combined effects of different factors on the ESV changes. The results of interaction detection for the lower Yellow River in 2000, 2010, and 2020 are shown in Fig. 5. It presents the interaction detection results of factors in each year, all of which show double factor enhancement or nonlinear enhancement, indicating that the interaction between factors will enhance the impact degree of ESV changes, and it also indicates that the ESV changes are a complex process of multi-factor interaction. In 2000, the interaction between total population and elevation, total population and slope grade, was strong, with explanation powers of 0.953 for both. In 2010, the interaction between total population and slope grade, temperature, and elevation was strong, with explanation powers of 0.995 and 0.969, respectively. In 2020, the interaction between total population and elevation, GDP, and slope grade was strong, with explanation powers of 0.996 and 0.990, respectively. The interaction detection results for each year indicate that the combination of natural and social factors deepens the impact on land use changes, thereby causing changes in ESV in the lower Yellow River.
Fig. 3.
Spatial distribution of ESV in the lower Yellow River. Driving factors analysis of ESV changes.
Discussion
Land is the carrier of major social and economic activities and an important part of global environmental change and sustainable development research. Driven by economic and social change and innovation, regional land use types have also evolved. Land resources are the cornerstone of the survival and development of human society. In recent years, with the acceleration of urbanization, the loss and fragmentation of cultivated land have become more critical [36, 37]. Land is the macroscopic representation of the surface landscape, and frequent human activities and high-intensity development and construction make the landscape fragmented and complicated, threatening the harmony of the human-land relationship [38]. At the same time, land use change leads to the change of ecosystem structure and function, affects the balance of the ecosystem, and leads to the increase of ecological risk. With the transformation of the concept of national spatial development from single function dominance to symbiotic and coordinated production, life, and ecological functions, related research is gradually focusing on the production-living-ecological space. Ecosystem services closely integrate ecosystems with human development, serve as a research carrier for resource allocation and interest coordination [39], and play an important role in achieving national spatial optimization and promoting planning in line with the concept of ecological civilization.
The difference in ecological status and agricultural development in the lower Yellow River makes the distribution of regional population, economy, and “Production-Life-Ecology Space” show obvious spatial imbalance [40]. During 2000–2010, the pattern of land use change was mainly caused by the expansion of construction land under the influence of large-scale land development and high-intensity land use. On the one hand, the complex topography and abundant rainfall provide a good natural basis for the changes of various land types in the lower Yellow River region. On the other hand, economic development and the large-scale construction of transportation infrastructure such as railways and roads provide conditions for the mutual circulation of production factors. During this period, continued industrialization, urbanization, and population expansion facilitated the formation of more urban industrial, mining, and residential land. In addition, China has introduced a comprehensive variety of policies to return farmland to forest and grassland and other ecosystem benefits, promoting the expansion of forest land and wetlands. From 2010 to 2020, the state began to pay attention to the importance of ecological protection in the Yellow River region and successively established the Yellow River Delta Efficient Ecological Economic Zone and the Yellow River Delta Agricultural High-Tech Industry Demonstration Zone.
The development of an efficient ecological economy has promoted the corresponding change in land use, which is reflected in the following aspects: (1) Through the implementation of the policy of cultivated land protection and balance of occupation and compensation, the urbanization development encroaches on the cultivated land in the suburbs, and at the same time, the abandoned construction land is transformed into cultivated land in the sparsely populated towns and villages. (2) With the continuous development of soil improvement technology, a large number of tidal flats have been developed and utilized, and the scale of new wetlands and construction land is large. At the same time, large areas of saline-alkali land have been treated, and the cultivated area has been greatly increased by improving the soil and encouraging the cultivation and popularization of salt-tolerant crops.
(3) The original overdeveloped construction land, industrial and mining land, and heavily polluted chemical enterprises are gradually withdrawn, and the construction land is transformed into a water area, which increases the ecological land area and improves the ecological environment. (4) With the establishment of an efficient ecological economic zone in the Yellow River Delta, the demand for ecotourism has increased, and the water area has been further expanded. At present, regional advantages are prominent, the type of regional land use is constantly adjusted according to the location, the industrial structure is more reasonable, and urbanization has shifted from incremental expansion to inventory revitalization [41]. At the same time, the investment of a large number of special funds and technological progress has provided economic support for land use change, promoted the development of modern and efficient agriculture and the substitution of new growth forces, and significantly improved the level of land intensive use in the lower Yellow River region.
The mutual transformation of land use leads to the increase (or decrease) of ESV, and the change of territorial spatial pattern is the key factor in affecting the regional ecological environment [42]. Improper land use makes it easy to break the ecosystem balance. Due to the existence of Weishan Lake, the largest freshwater lake in north China, and several provincial wetlands in Jining City, as well as Dawen River and Dongping Lake, the largest tributaries of the Yellow River in Tai’an City, ecological land is mainly distributed in Shandong Province. With the implementation of intensive land use and ecological protection policies [43], the ecological environment degradation gradually flattens and the ecological land area increases, which promotes the overall ESV increase in the lower Yellow River [44]. At the same time, the active implementation of the policy of returning farmland to forest and grassland in the lower Yellow River also promoted the increase of regional ESV. The lower Yellow River has a flat terrain, close spatial and economic connections between cities, and a high spatial correlation between social and economic conditions [45]. Therefore, it is necessary to comprehensively consider the impact of natural and socialeconomic factors on regional ecological security and prevent the further deterioration of the ecological environment caused by the joint action of multiple factors.
Conclusions
Under the context of the national strategy of ecological protection and high-quality development in the Yellow River, studying the evolution of territorial spatial patterns and their ecological effects becomes more important. How to improve the positive effect of territorial space utilization is a difficult and important point. Therefore, this paper takes “production-living-ecological spaces” as the entry point to study the quantitative and spatial impacts of land use types on ESV in the lower Yellow River from 2000 to 2020 and then discusses the driving factors affecting ESV changes. This study is helpful for governments at all levels to coordinate economic development and ecological environmental protection and provides a reference for decision-making of territorial spatial planning in the lower Yellow River. The results are as follows:
(1) The land use structure in the lower Yellow River shows a pattern of production ecological land>living production land>ecological production land>ecological land. The production of ecological land and ecological production land have shown decreasing trends, mainly due to the conversion of cultivated land to construction land. The living production land and ecological land have shown increasing trends, reflecting the government’s emphasis on improving the ecological environment while pursuing urbanization development.
(2) The ESV in the lower Yellow River has increased by CNY 4.67 billion, mainly contributed by the significant increase in ecological land service value. The spatial pattern of ESV shows a “higher in the northeast, lower in the southwest” pattern. The cities of Binzhou and Dongying in Shandong Province have much higher ESVs than other areas, mainly because of their large coastal areas, lakes, and wetlands, which have high water conservation values. The overall contribution rate of ESV in the Shandong area is higher than that in the Henan area.
(3) Changes in total population and GDP in the lower Yellow River have a significant impact on the ESV, while natural factors have lower explanatory power. This indicates that the frequent land use changes driven by socioeconomic development have a significant impact on the stability of the regional ecosystem. In addition, the interactions between total population and slope grade, total population, and elevation are strong, and the superimposed effect of natural and social factors leads to greater changes in ESV. It suggests that the ESV change is a complicated and changeable process influenced by multiple factors.
Some policy recommendations are as follows: 1) Following the principle of ecological priority and green development, accelerate the construction of a high-quality national spatial development and protection pattern for coordinated production-living-ecological space, and form a complementary national spatial system with advantages.
2) Explore the establishment of an ecological compensation mechanism for land use in the lower Yellow River. For areas with high ESV, we need to focus on protection as the main area of ecological compensation; for areas with low ESV, necessary ecological protection and restoration measures should be taken to enhance the ecological value within the region. 3) Ecosystem services should be incorporated and reflected in national spatial planning. Land use solely for the purpose of economic growth is unsustainable. Therefore, it is suggested that ESV should be used as a quantitative index to measure the ecological effects of land use policies, which is of great significance to promote land use decision-making, urban management, and ecological protection.
Although this research provides a new idea for the study of land ecosystem services, the method still has some limitations due to the accuracy of the data and the complexity of the ecosystem. In the future, the ecological risk and mechanism of land use change should be further discussed to promote the coordinated development of regional ecological protection and social economy.

