

Introduction
Ecosystem services (ES) mean tangible products and intangible services that humans obtain from ecosystems, which are designed to meet human survival, health, and well-being needs [1-3]. These services can be further divided into four types as per functions: cultural services (CS), supporting services (SS), regulating services (RS), and provisioning services (PS), each of which meets human living needs in different ways [4]. However, over the past few decades, human activities have significantly altered ecosystems, leading to nearly two-thirds of global natural resources being at risk of depletion [5-7]. LULC variations, as a result of the interaction between the natural environment and the temporal and spatial variations of human activities, play a crucial role in ES [8, 9]. As global urbanization accelerates and human activity frequency increases, LULC variations have become more pronounced, capable of significantly impacting the structure and function of ecosystems at the same time, thereby affecting ES provision [10]. The UAMLYR is not only a dense area of important ecological barriers in China but also a composite region of major mineral and grain production areas. Additionally, this region is a typical area where economic and social development and ecological environmental protection issues stand out prominently. Due to the lack of effective water conservancy control facilities, the region has insufficient water resource regulation capabilities, leading to a series of significant pressures, including imbalance in water-sediment relationships, sediment accumulation downstream, severe soil erosion, shortage of water and soil resources, and degradation of ecosystems. These directly affect LULC and constrain the development of ecosystem services. Therefore, strengthening studies about ESV in UAMLYR is a necessary requirement for propelling ecological protection and a high-quality development strategy in the Yellow River Basin, and a practical need to address prominent ecological issues and improve people’s living environments.
ESV is gradually becoming a key indicator for evaluating the effectiveness of ecological restoration and sustainable management. Globally, the interdisciplinary integration of ecology, environmental science, and economics has sparked widespread interest in research on ESV [11, 12]. In 1997, Costanza et al. [13] developed a global ESV equivalent factor table, laying a solid foundation for ESV assessment. Founded upon Costanza’s research, Xie et al. [14] structured a unit area ESV equivalent factor table for China’s terrestrial ecosystems, which has been widely applied in domestic studies due to its low data requirements, ease of operation, easy comparability of results, and comprehensive evaluation. Research on ESV focuses on theoretical foundations [5], driving forces [15- 17], spatiotemporal variations [18], and influencing factors [19]; the research scale covers multiple levels including national, regional, provincial, municipal, and county [20-24]; the research scope mainly concentrates on areas with high ESV including lakes [25], forests [26], wetlands [27], and watersheds [28]; whereas the research methods primarily include statistical analysis [29] and spatial analysis [30]. As research deepens, scholars are no longer satisfied with merely assessing the spatiotemporal evolution of ESV but place greater emphasis on using advanced models like Geographically Weighted Regression and Geographical Detectors to probe into factors influencing ESV spatial differentiation [31, 32], and to investigate how natural conditions [33], climate change [34], and human activities [35] jointly impact ESV evolution. When analyzing driving factors, although many studies have adopted different methods and drawn different conclusions at various spatiotemporal scales, the majority of views agree that comprehensive influences of natural and anthropogenic factors and their interactions significantly affect ESV spatiotemporal distribution [36-38].
Variations in LULC are both causes and consequences of environmental change, a process that is complex and multifaceted, spanning multiple dimensions of space and time, and influenced by numerous natural and social factors [39, 40]. To simulate LULC variations, it is necessary not only to deeply explore and refine the complex patterns of evolution but also to analyze the interactions of these multiple driving factors across spatial and temporal dimensions. Given its complexity, constructing an efficient and reasonable scenario simulation model has become a critical approach to studying LULC variations. Currently, widely used models include the CLUE-S model, suitable for medium and small scales [41], the CA-Markov model, which improves spatial simulation accuracy through neighborhood analysis [42], and the FLUS model that enhances simulation precision using neural network algorithms [40]. Compared with the aforementioned models, the PLUS model achieves high-precision and high-efficiency simulations of the evolution of various LULC types under large-scale and multiple scenarios by integrating types of random patch seed generation mechanisms and LULC expansion analysis strategies. This model has been successfully applied in LULC simulation studies under various spatial and temporal contexts. At present, existing multiple-scenario ESV simulation measurements are primarily based on current development trends, analyzing different scenarios by setting different emphases. However, there is still insufficient attention to the spatial differences in regional ESV caused by drastic variations in LULC types driven by national strategies.
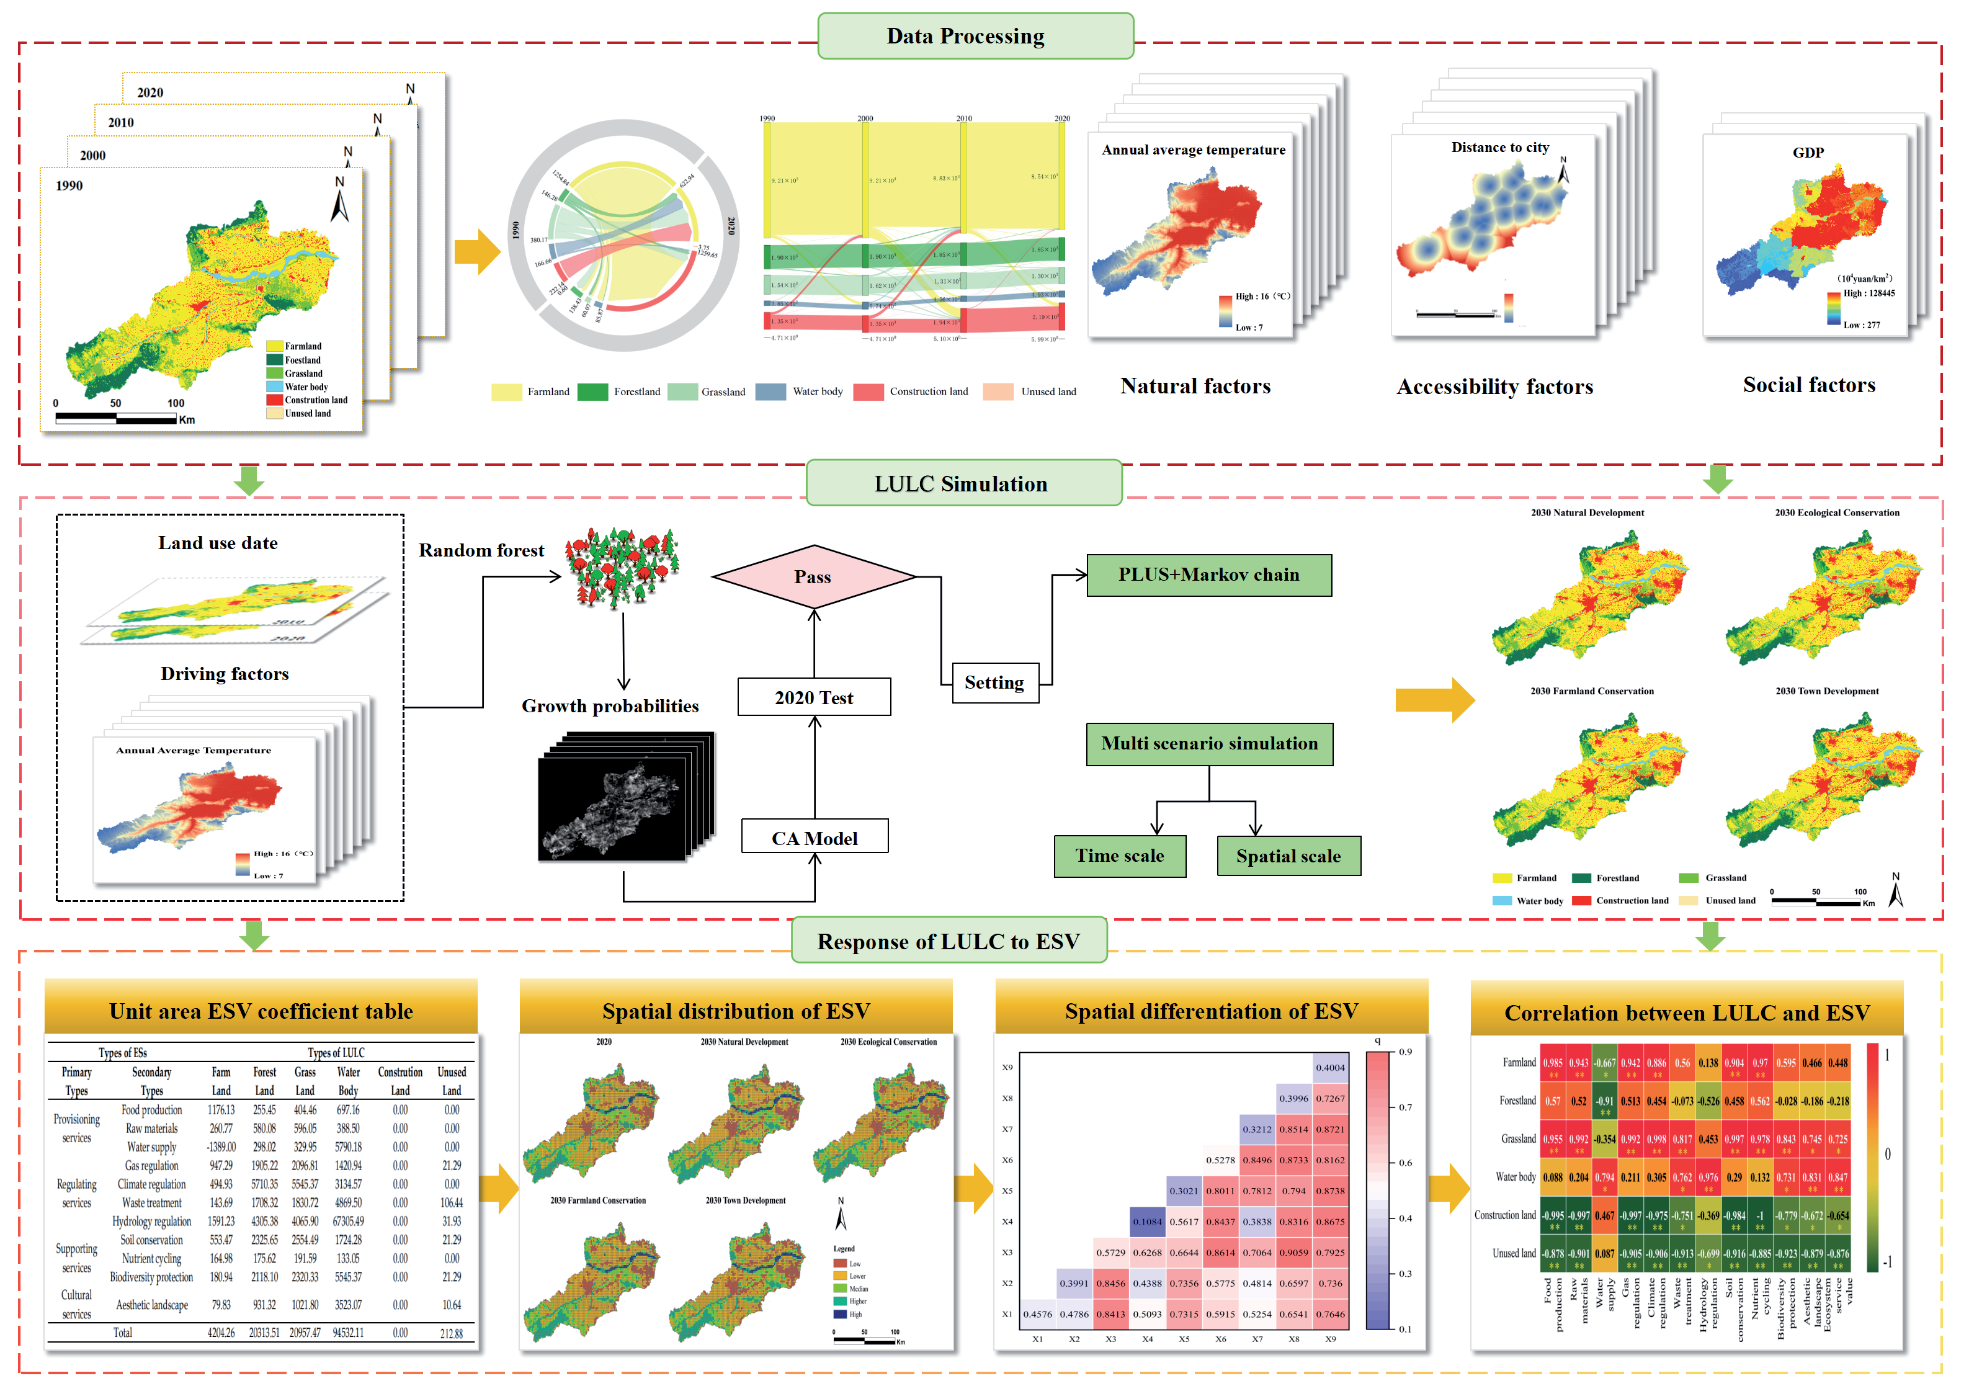
The innovation of this study is to select the UAMLYR, a special area with a fragile ecosystem and frequent human activities, which effectively fills the gap of existing research in this specific area. Through multiple scenarios simulation, the impact of LULC change on ESV is systematically analyzed, which surpasses the limitations of traditional single scenario analysis. In addition, according to the regional characteristics, the key influencing factor of soil erosion was included in the ESV assessment system. Due to the special geomorphic characteristics and social conditions of the UAMLYR, the problem of soil erosion is particularly prominent, and this factor is often ignored in the previous research on the Yellow River Basin. The innovation of this study is helpful to more accurately evaluate the changes of ESV in the region, and provide a scientific basis for regional ecosystem management. The flowchart of this research is shown in Fig. 1. Based on four periods of LULC classification data from 1990, 2000, 2010, and 2020 in the UAMLYR, this study uses a LULC transition matrix to investigate transitions among different LULC types. The PLUS model is employed to emulate LULC patterns under disparate scenarios. The equivalent factor method, geographical detector, and Pearson correlation analysis are utilized to explore the spatiotemporal evolution, spatial differentiation, and correlation with LULC of the ESV in the UAMLYR.
The objectives of this study are: (1) to evaluate dynamic variations in LULC and ESV in UAMLYR from 1990 to 2020; (2) to simulate the impacts of LULC on ESV under different scenarios; (3) to survey driving factors influencing ESV.
Materials and Methods
Study Area and Data Sources
Study Area
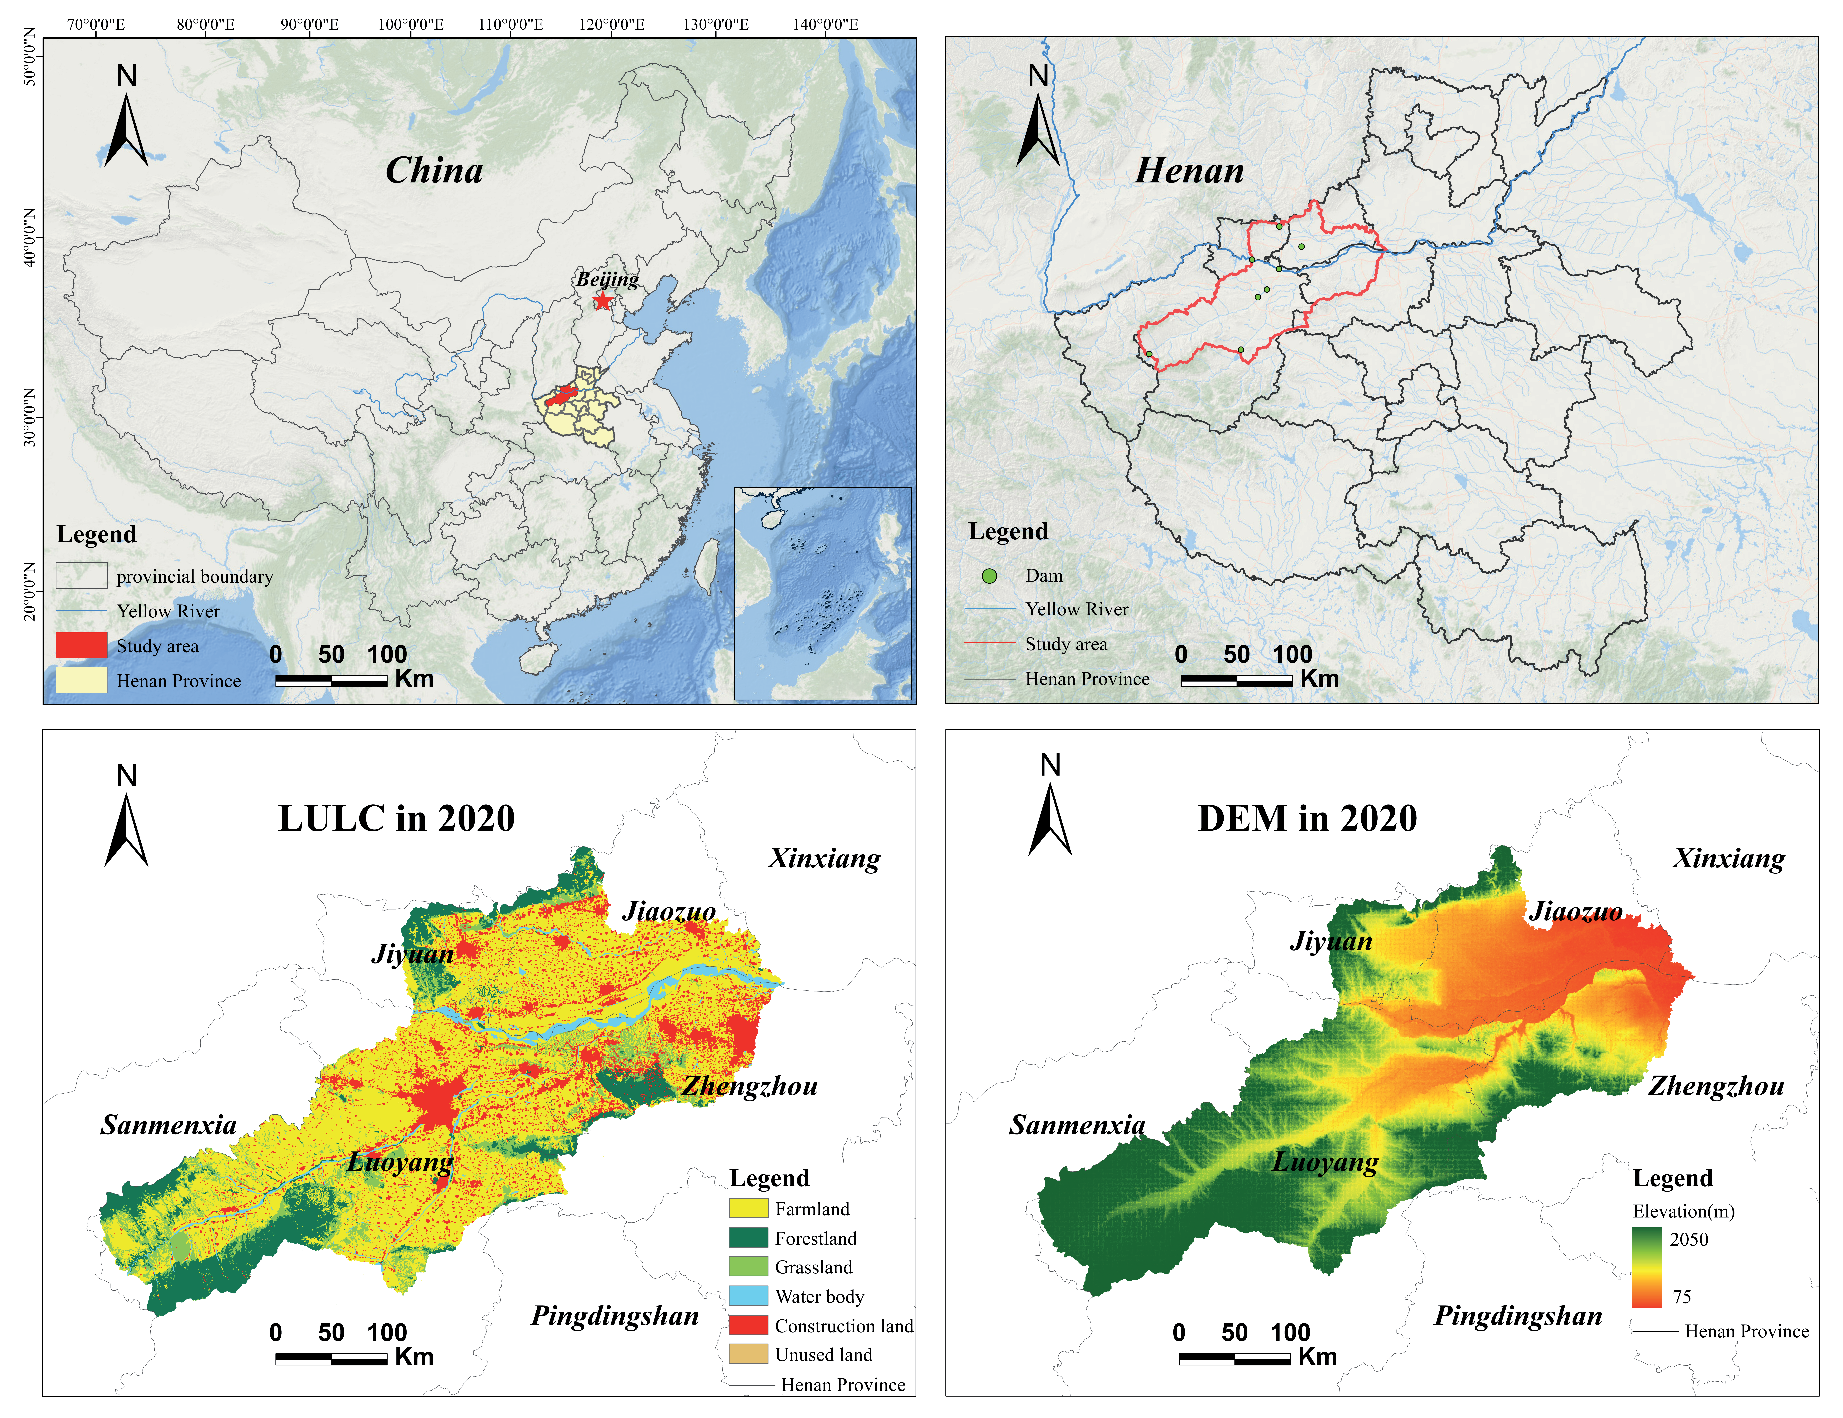
UAMLYR (34°05′~35°21′N, 111°10′~113°43′E) is defined as an area without reservoir projects to intercept floods in terms of flood control. Specifically, it covers the region downstream of the Xiaolangdi Dam, below the Guxian Reservoir Dam on the Luo River, below the Luhun Reservoir Dam on the Yi River, plus the confluence zones of the Qin River and Sishui River, totaling 1.8×10⁴ km2. After the operation of the Heikoucun Reservoir at the estuary of the Qin River, the total area has reached 1.44×10⁴ km2 (Fig. 2). This region constitutes a complete natural geographic unit that includes mountains, hills, and plains, with distinctive regional characteristics. It is also a crucial core area for grain production and an important energy and chemical industry base in the Yellow River Basin, featuring comparatively advanced industrial and agricultural sectors and a dense population.
Data Source and Processing
LULC data for 1990, 2000, 2010, and 2020 adopted herein were acquired from the Resource and Environmental Science Data Center of the Chinese Academy of Sciences, with a spatial resolution of 30 m. Following their LULC classification standards, LULC types for each year were classified into six major classes: farmland, forest land, grassland, water body, construction land, and unused land. Sown areas, yields, and selling prices of major food crops were sourced from the Henan Statistical Yearbook, the Henan Provincial Bureau of Statistics, and the National Agricultural Products Production Materials Compilation Data. Other specific data sources refer to Table 1.
Research Methods
LULC Transition Matrix
LULC transition matrix can calculate the quantity and direction of transitions between LULC types, and can describe the direction and extent of variations in various land types over a period of time [43]. The expression is:
where S represents LULC area; i and j denote LULC types at initial and final periods of the research, respectively; n denotes the number of LULC types.
Assessment of ESV
In this study, the value of 1/7 of grain yield per unit area is defined as the unit value of agricultural ecosystem services based on the improved equivalent factor method proposed by Xie et al. [44]. Grain yield per unit area in UAMLYR from 1990 to 2020 was calculated to be 5646.12 kg/hm² as per the Henan Statistical Yearbook, the Henan Provincial Bureau of Statistics, and historical statistical data from various cities and counties. The grain price was calculated to be 1.51 yuan/kg based on the average prices of rice, corn, and wheat from 1990 to 2020 as the actual grain prices. Assuming the value coefficient of construction land is 0 [45], the unit area ESV coefficients for the research field were established (Table 2). The calculation formula is:
where Ea stands for economic value of ES per unit area (yuan/hm2); i represents grain crop type; mi denotes average price of the i-th grain crop (yuan/kg); pi means the yield per unit area of the i-th grain crop (kg/hm2); qi represents planting area of the i-th grain crop (hm2); M is total planting area of grain crops (hm2).
Table 1.
Land expansion and ESV spatial differentiation driving factors.
Table 2.
ESV coefficients per unit area for the UAMLYR /(yuan/hm2).
PLUS Model
PLUS model is a novel LULC simulation model founded upon raster grids that generates patches [46]. Compared to other LULC simulation models, the Cellular Automata model can perform high-precision simulations of patch evolution for various LULC types under complex scenarios [40-43]. We proposed a method combining the Cellular Automata model with a patch generation simulation strategy. It simulates future LULC conditions based on parameters such as development probability and neighborhood effects [46]. The calculation formula is:
where r denotes a random variable between 0 and 1; µk stands for the threshold for generating new patches of the k-th LULC type expected by the user in the model.
The transition matrix is used to define whether conversions between LULC types are possible and to effectively constrain unreasonable conversions between LULC types. At the same time, a patch generation threshold decay coefficient is set to constrain the spontaneous growth process of LULC types and to determine the final LULC pattern [46]. The formula is as follows:
Where n denotes total number of LULC types; Step stands for step size required to adjust PLUS model to fit LULC demand; l represents the number of threshold decay steps; τ means LULC growth threshold; Tc,k denotes transition matrix, defining whether LULC type c can be converted to type k, with a value of 1 indicating allowed conversion and 0 indicating restricted conversion.
Geo-Detector Model
The Geo-Detector model refers to a statistical method used to analyze spatial phenomena and their driving factors [47]. Factor detector and interaction detector herein were utilized to evaluate the influence of natural and socioeconomic factors on ESV in the research field. The calculation formula is:
Where q denotes the detection power of the influencing factors on ESV spatial heterogeneity, ranging from 0 to 1. A larger q value implies a stronger explanatory power of the factor on ESV spatial heterogeneity, while a smaller q value indicates weaker explanatory power; L stands for stratification of variable Y or factor X; N and σ2 denote total number of samples and overall variance in research field, respectively; Nh and σh2 represent the number of samples and the variance in stratum h, respectively.
Pearson Correlation Analysis
Pearson correlation analysis refers to a statistical method adopted to accurately measure the degree of relationship between two variables [48]. The magnitude of the coefficient value reflects the strength of the linear correlation between the two variables. As to variables X = [x1, x2, …, xn]T and Y = [y1, y2, …, yn]T, the calculation formula is:
Where x̅ and y̅ denote the means of the n data points; the range of the correlation coefficient r is (-1, 1). The closer the absolute value of r is to 1, the stronger the correlation between x and y; r = -1 or 1 implies perfect negative or positive linear correlation, respectively, and r = 0 implies no linear correlation; |r|≥0.8 implies a strong correlation, 0.5≤|r|<0.8 implies a moderate correlation, 0.3≤|r|<0.5 implies a weak correlation, and |r|<0.3 implies a very weak correlation, which may be nonlinear.
Results
Characteristics of LULC and ESV Variations from 1990 to 2020
Characteristics of LULC Variations
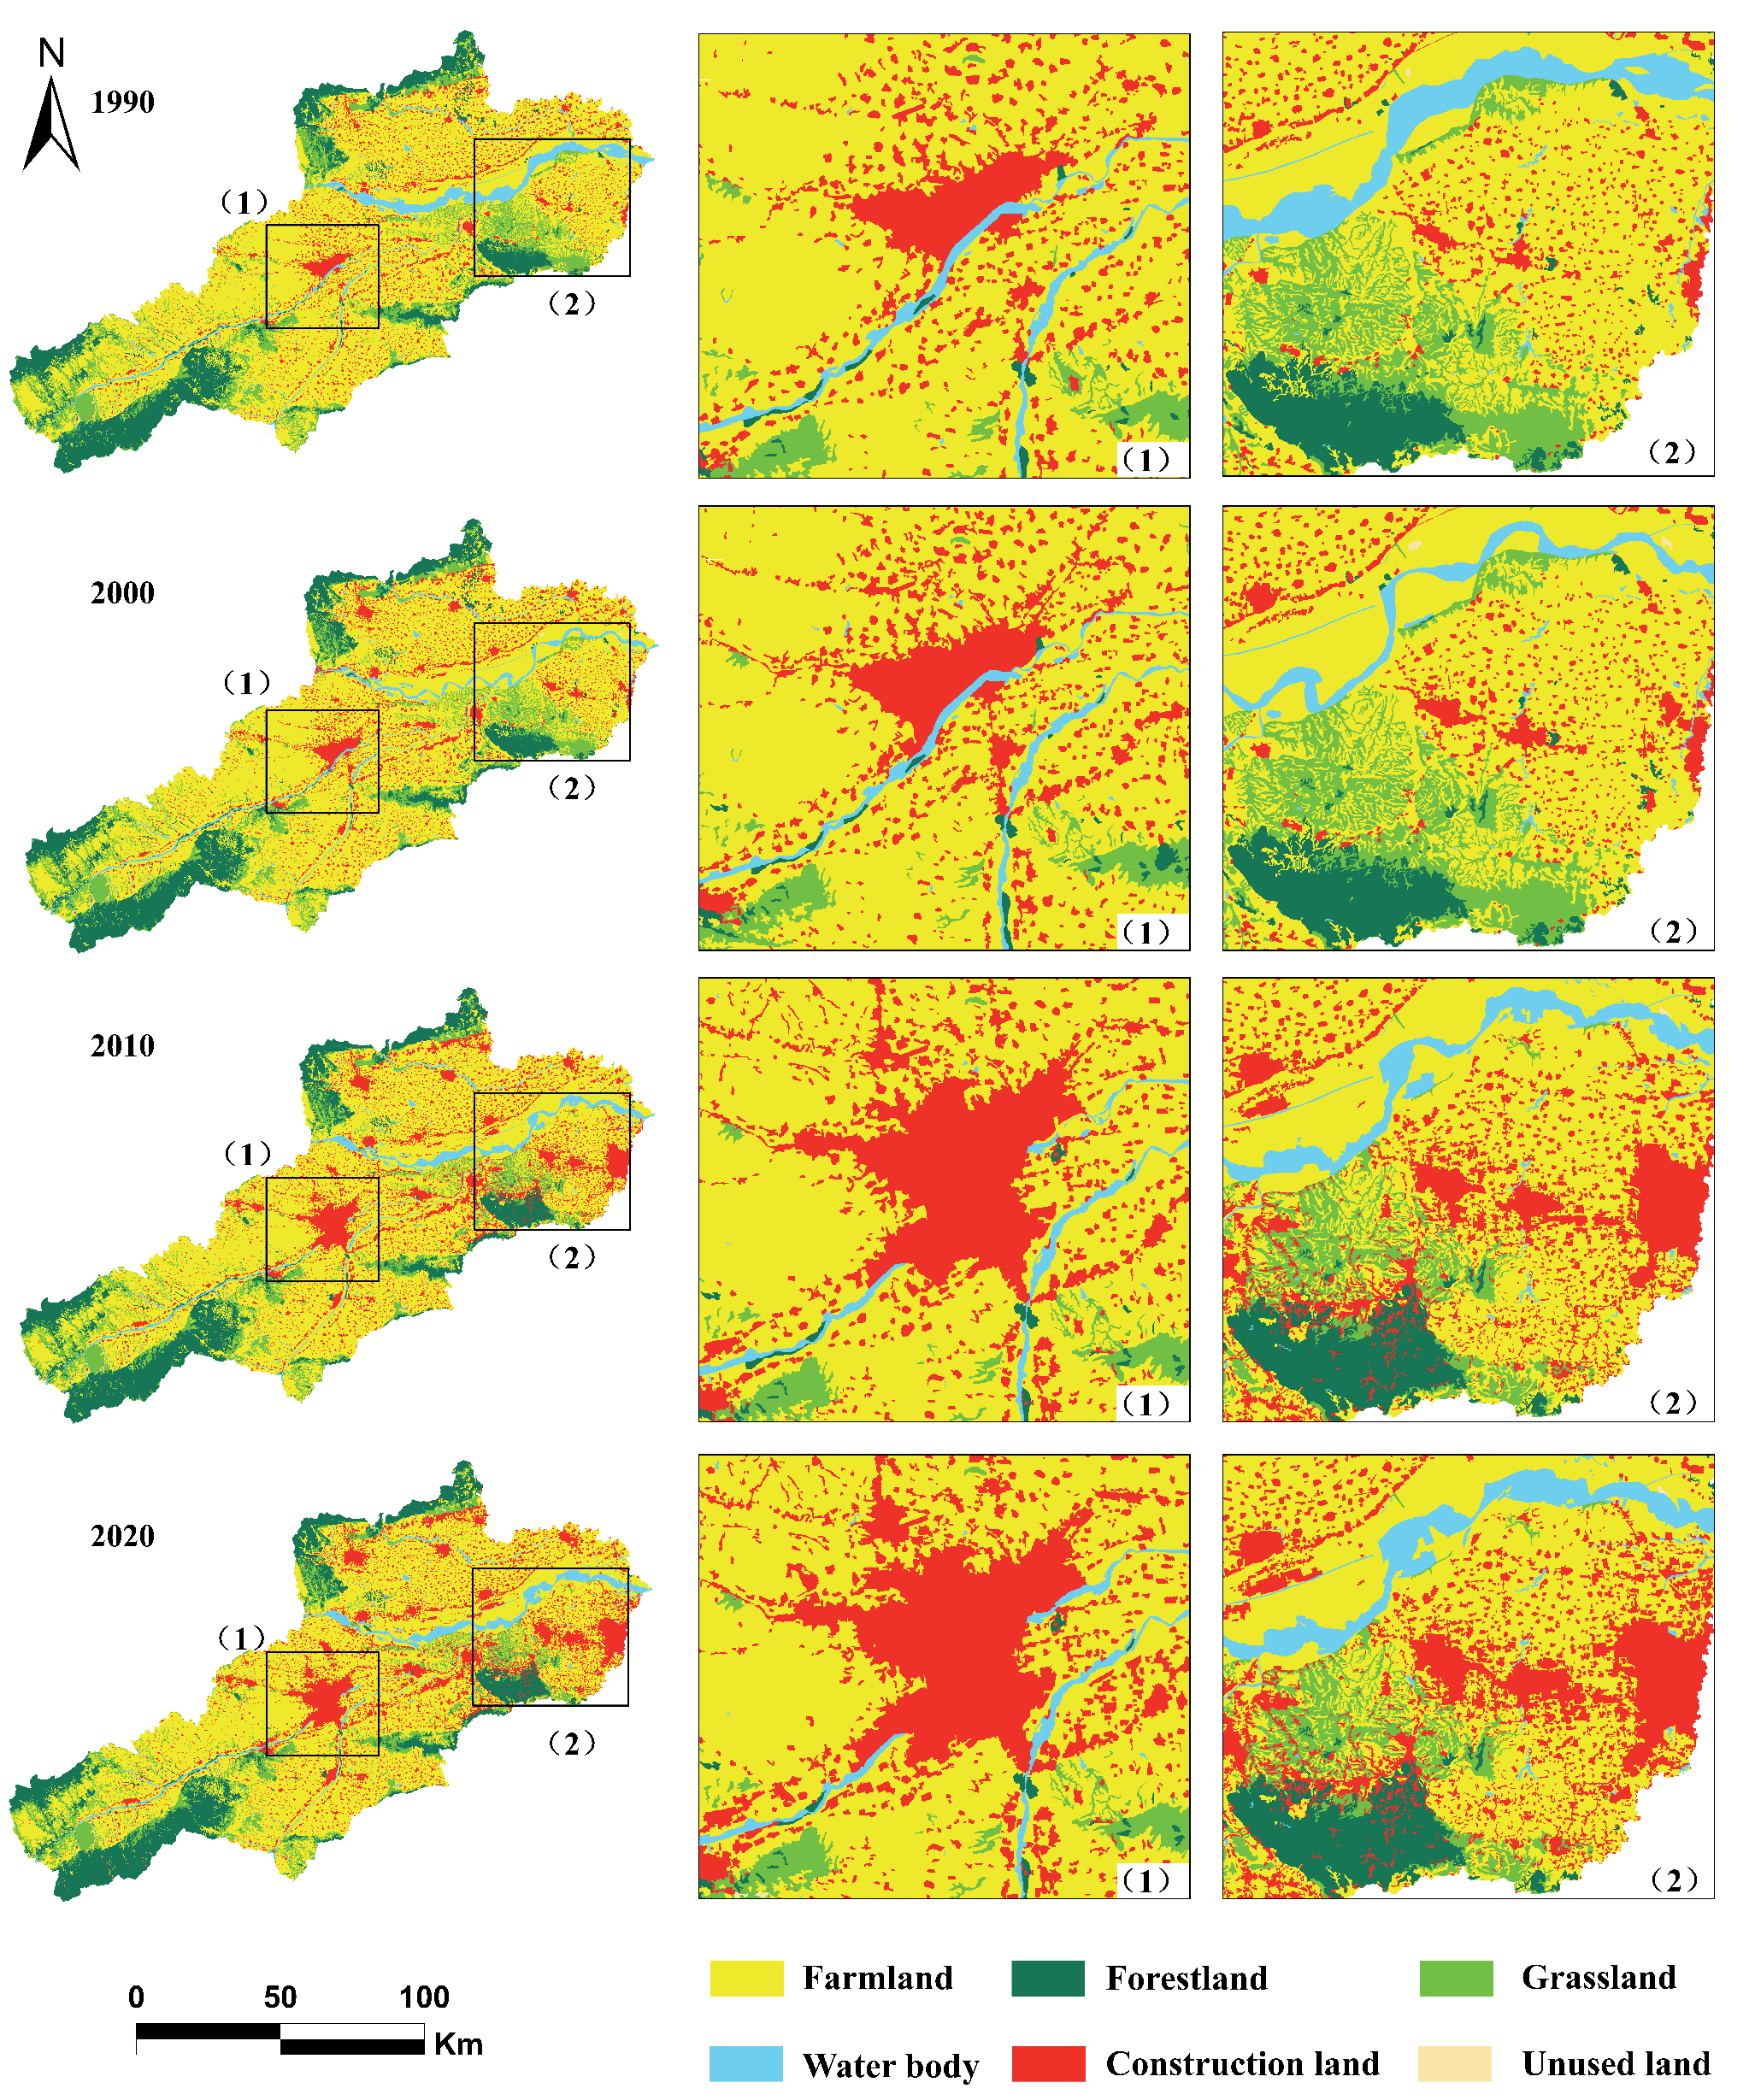
The land use types in UAMLYR were reclassified via remote sensing data, with the area of each LULC type in the region (Table 3) and its spatial distribution structure obtained (Fig. 3).
From 1990 to 2020, farmland has been the major LULC type in the research field, covering more than 60% of the total area. Specifically, the central and eastern regions are mainly composed of farmland and construction land, the western region is predominantly composed of grassland and forest land, water body is distributed rather sparsely, and unused land is primarily concentrated in the northwest. During the research period, the areas of farmland and grassland decreased gradually, the areas of construction land and water body increased gradually, and the increase in construction land was relatively significant, whereas the areas of forest land and unused land remained largely unchanged.
Table 3.
Area and proportion of various LULC types from 1990 to 2020.
The LULC transition from 1990 to 2020 is shown in Fig. 4. The total area of land conversion between different types of land in this area reached 2170.71 km², accounting for 1.09% of the total area of the research field. Among all LULC types, the conversion rate of farmland is the highest, reaching 57.81%, making it the primary source for the conversion into other LULC types. Construction land shows a significant expansion trend, with a transfer-in area as high as 1259.65 km², 88.25% of which comes from farm land. Forest land, grassland, and water bodies are mainly converted to farmland and construction land, accounting for 74.88%, 74.87%, and 95.27% of their related total conversion areas, respectively. In contrast, the transfer rate of unused land to other LULC types was relatively small, only 0.6 km².
Evaluation of ESV
From 1990 to 2020, the ESV in the UAMLYR were 1646.06×107 yuan, 1459.45×107 yuan, 1451.98×107 yuan, and 1474.52×107 yuan, respectively, demonstrating a trend of decreasing followed by increasing (Table 4). From 1990 to 2000, the ESV decreased by 186.6×10⁷ yuan, mainly due to the reduction in ESV from water bodies. During the period from 2000 to 2010, with the acceleration of urbanization, population aggregation in town areas of the middle and lower reaches of the Yellow River led to construction land encroaching on large amounts of forest land and grassland, causing their ESV to decline rapidly. The steady recovery of ESV from 2010 to 2020 indicates that the ecological governance work, which was carried out under the policy of ecological conservation and high-quality development in the Yellow River Basin, has made extraordinary achievements, leading to a significant expansion of water body areas and an improvement in the overall level of ESV. Among the primary categories of ES, the value of PS and RS increased, whereas the value of SS and CS slightly decreased. Among the secondary categories of ES, the value of water supply (WS), waste treatment (WT), hydrology regulation (HR), biodiversity protection (BP), and aesthetic landscape (AL) all demonstrated an increasing trend, whereas the value of the remaining ES decreased.
LULC and ESV Correlation Analysis
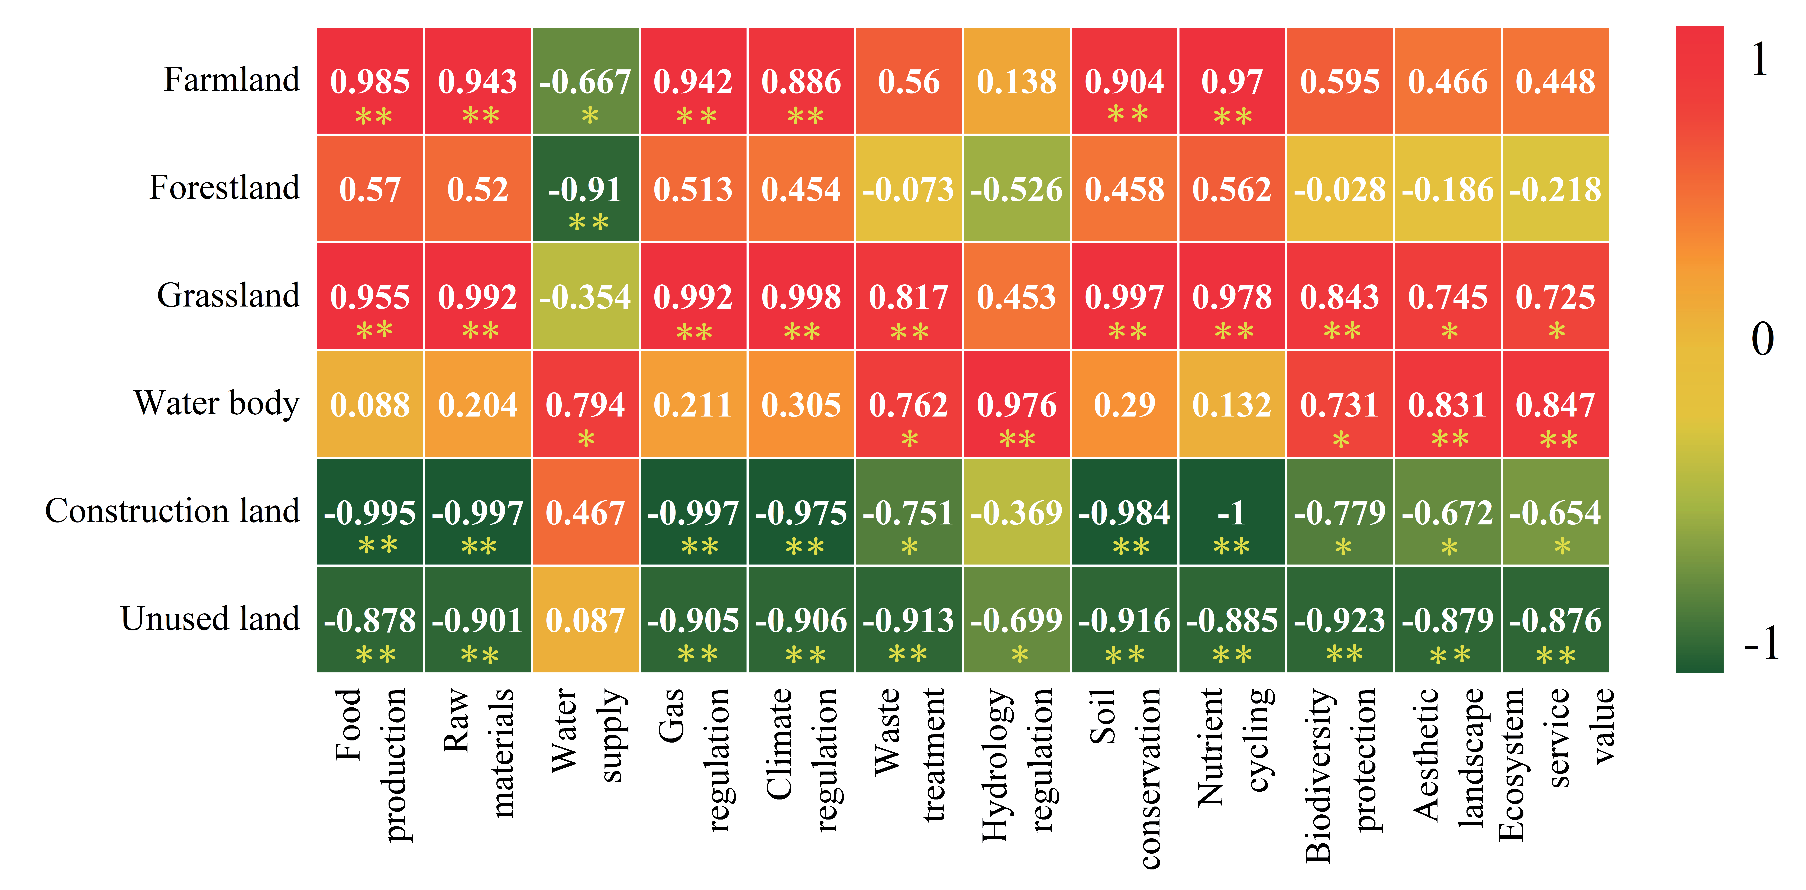
Pearson correlation analysis was employed to reveal intrinsic relationships between various types of ES and variations in disparate LULC types from 1990 to 2020 (Fig. 5).
The overall ESV is positively correlated with variations in water body, grassland, and farmland, with correlation coefficients of 0.847, 0.725, and 0.448, respectively; it is negatively correlated with variations in unused land, construction land, and forest land, with correlation coefficients of -0.876, -0.654, and -0.218, respectively. Trends in the correlation between WT, HR, BP, and AL and variations in LULC are similar to those of the overall ESV. Food production (FP) is significantly positively correlated with variations in farm land (R = 0.985, p<0.1), and significantly negatively correlated with variations in construction land and unused land (p<0.05), with correlation coefficients of -0.995 and -0.878, respectively. Moreover, variations in the correlation between raw materials (RM) and different land types are similar to those of FP. Variations in grassland, construction land, and unused land have no significant impact on WS (p>0.05). Forest land shows a reverse trend compared to the overall ESV and services such as gas regulation (GR), climate regulation (CR), soil conservation (SC), and nutrient cycling (NC), while variations in water body show no significant correlation, and other land types show extremely significant correlations (p<0.05).
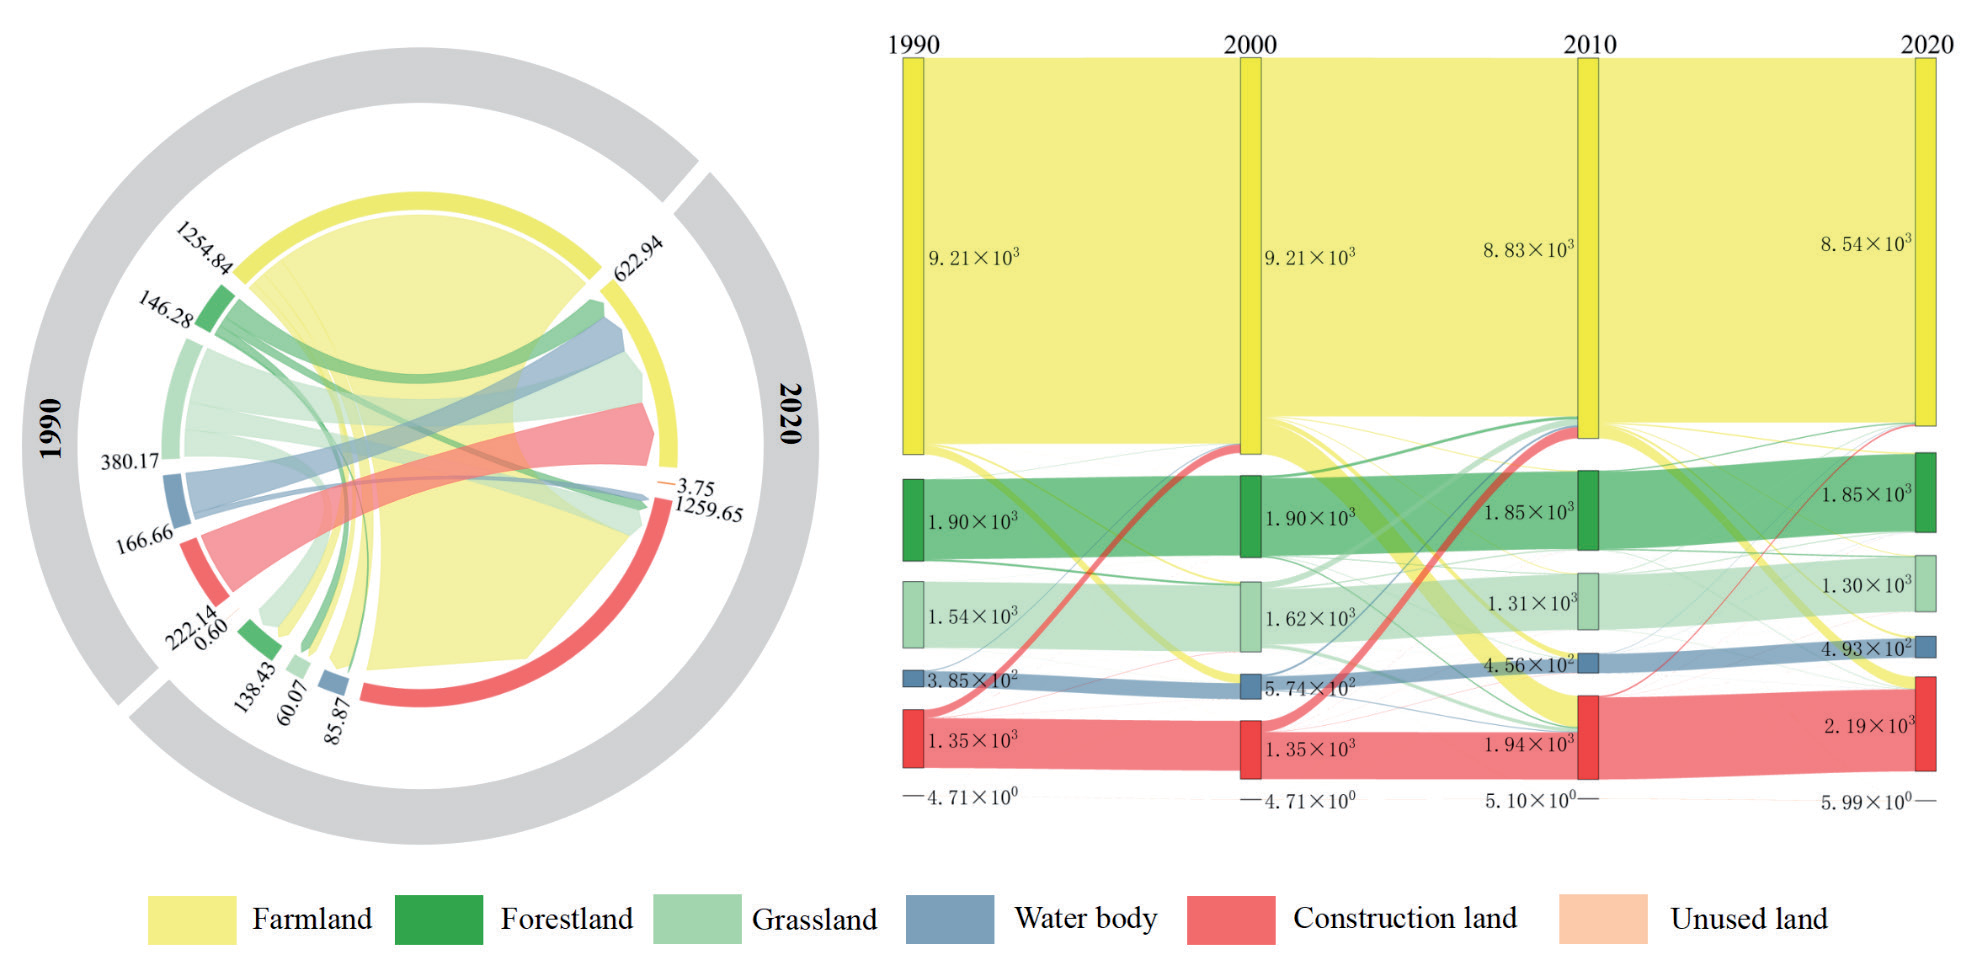
Table 4.
ESV of various types from 1990 to 2020.
Characteristics of LULC and ESV Variations Under Multiple Scenarios
LULC Variations Under Multiple Scenarios Simulations
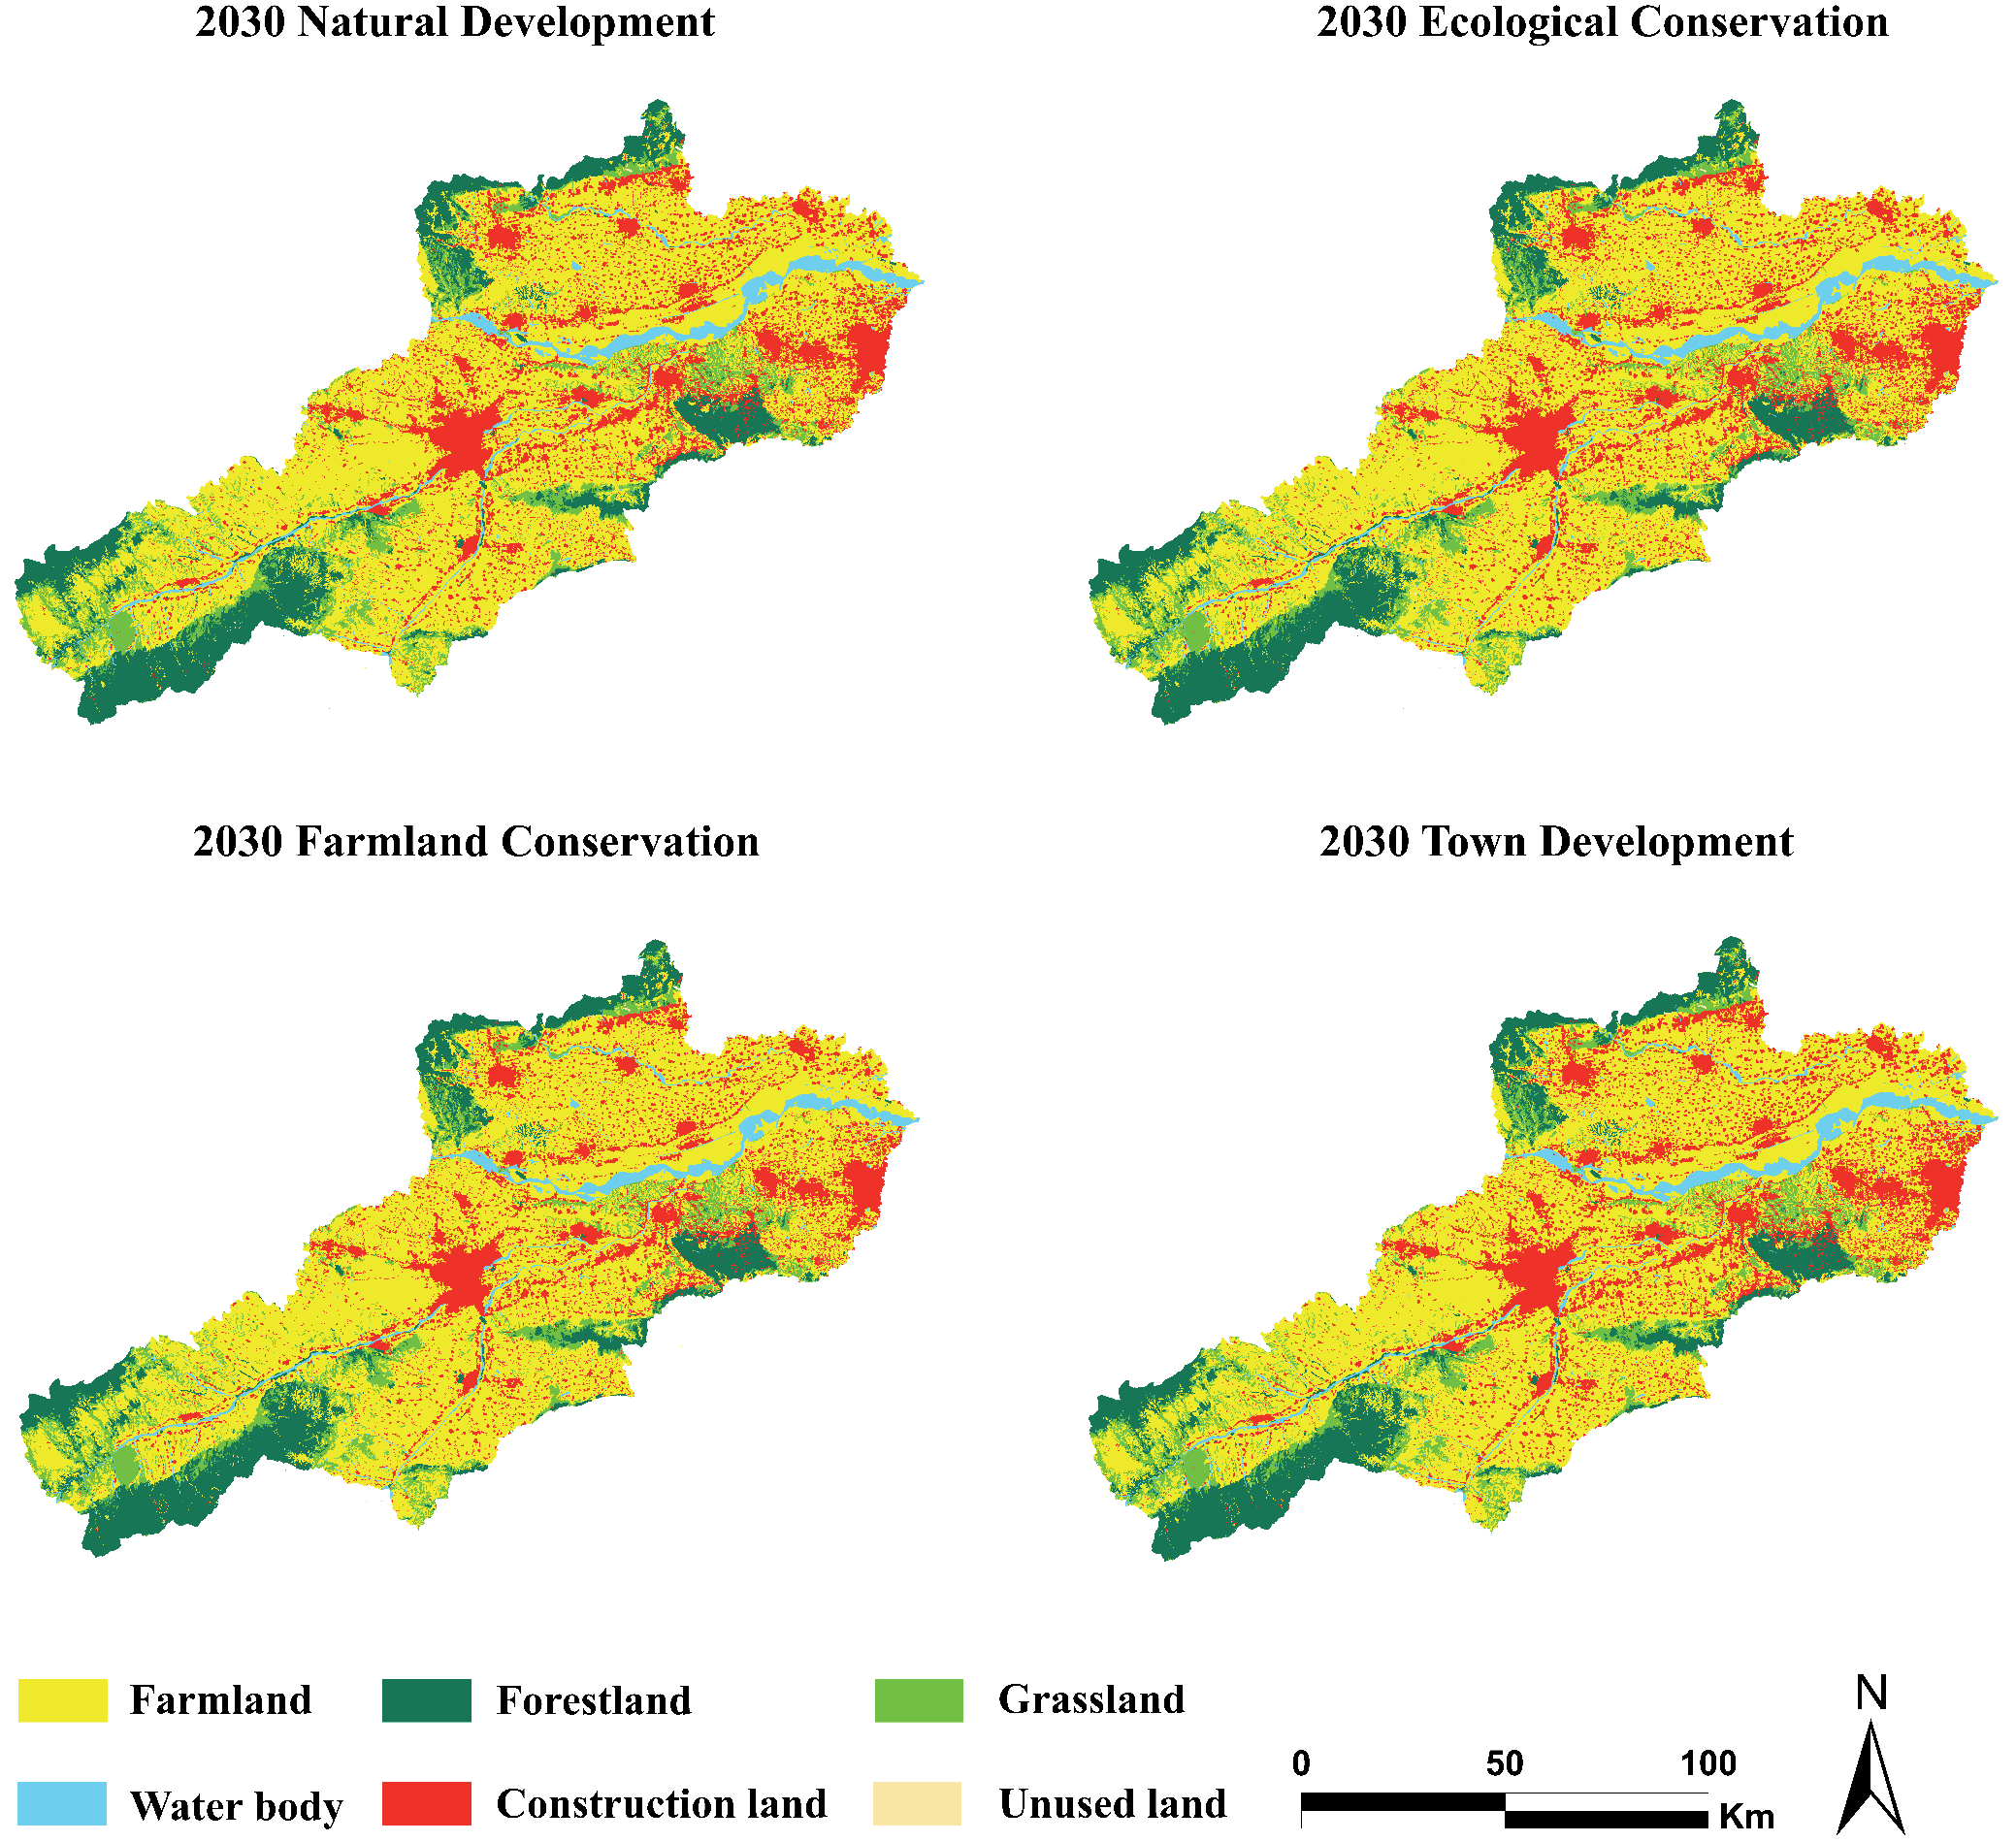
To test the applicability of the model, the LULC data of the UAMLYR in 2010 were used, combined with the LULC expansion probability from 2000 to 2010, and the LULC situation in 2020 was simulated by the PLUS model, and compared and verified with the actual data, the Kappa coefficient was 0.939, the overall accuracy 96.4%, indicating that the model had high accuracy and the results were reliable, which confirmed that the PLUS model was suitable for regional LULC. Based on LULC data of the UAMLYR for 2010 and 2020, LULC simulations were conducted for four different scenarios in 2030: natural development scenarios (NDs), ecological conservation scenarios (ECs), farmland conservation scenarios (FCs), and town development scenarios (TDs) (Fig. 6).
Compared to 2020, under an ND, the area of farmland decreased by 265.63 km², while the area of construction land expanded by 237.71 km², with little change in forest land, grassland, and unused land areas. Under the ECs, the areas of forest land and grassland steadily increase, whereas they decrease under other scenarios, with variations ranging from 0.49 to 1.7 km² and 0.53 to 8.92 km², respectively. Despite this, the construction land area still increased by 230.04 km², indicating that ECs policies failed to effectively control town expansion. Under the FCs, the farm land area significantly increased, with an increase ranging from 279.66 to 410.77 km². The areas of water body and construction land remained relatively stable compared to 2020 but decreased compared to other scenarios, with reductions ranging from 32.92 to 34.02 km² and 238.53 to 382.75 km², respectively. In these scenarios, variations in forest land and grassland areas were consistent with those under the NDs; under the TDs, construction land area significantly increased by 374.26 km², whereas the farm land area decreased by 396.74 km², becoming the primary source for expansion of construction land (Table 5).
ESV Calculation under Multiple Scenarios Simulations
The ESV of the UAMLYR in 2030 under four scenarios – NDs, ECs, FCs, and TDs are 1495.24×107 yuan, 1496.75×107 yuan, 1475.18×107 yuan, and 1488.06×107 yuan, respectively (Table 6). Under the NDs, the ESV in 2030 increased by 20.72×10⁷ yuan compared to that in 2020. The implementation of farm land protection policies resulted in a decrease in the ESV of farm land by 11.17×10⁷ yuan, with slight reductions also observed in the ESV of forest land and grassland. However, ecological conservation and restoration measures resulted in an increase of 33.14×10⁷ yuan in the ESV of water bodies. Under the ECs, the increase in the ESV of water bodies was 33.48×10⁷ yuan, contributing to an overall increase in ESV of 22.23×10⁷ yuan. Under the FCs, the change in ESV compared to that in 2020 was minimal. A decrease of 31.82×10⁷ yuan in the ESV of water bodies was the main reason for the lower ESV. Under the TDs, the ESV decreased by 7.18×10⁷ yuan compared to the NDs, primarily due to the expansion of construction land leading to reductions in the ESV of farmland, forest land, and grassland, especially with a reduction of 5.51×10⁷ yuan in the ESV of farmland.
Under the four scenarios for 2030, the values of PS, RS, and CS all increased, while in terms of SS, the ESV increased only under the ECs (Table 7). In the NDs, ECs, and TDs for 2030, the values of FP, RM, GR, CR, SC, and NC services all show a declining trend, while the values of other types of ESV show an upward trend. Among these, the decrease in FP is the largest, ranging from 2.8×10⁷ to 4.47×10⁷ yuan, while the value of HR increases the fastest, ranging from 16.35×10⁷ to 19.62×10⁷ yuan. Under the four scenarios, the variations in various ecological service functions under the FCs are not significant compared to the baseline levels of 2020. Under the FCs, the values of WS, CR, WT, SC, and BP show a downward trend, with the largest decrease in CR, at 0.22×10⁷ yuan. The values of other types of ESV show an upward trend, with the largest increase in the value of HR, at 0.92×10⁷ yuan.
Table 5.
LULC area and change rate under different scenarios in 2020 and 2030.
Table 6.
Variations in ESV of various LULC under multiple scenarios (×107 yuan).
Table 7.
Individual ESV items from 2020 to 2030.
Characteristics of ESV Spatial Pattern Variations
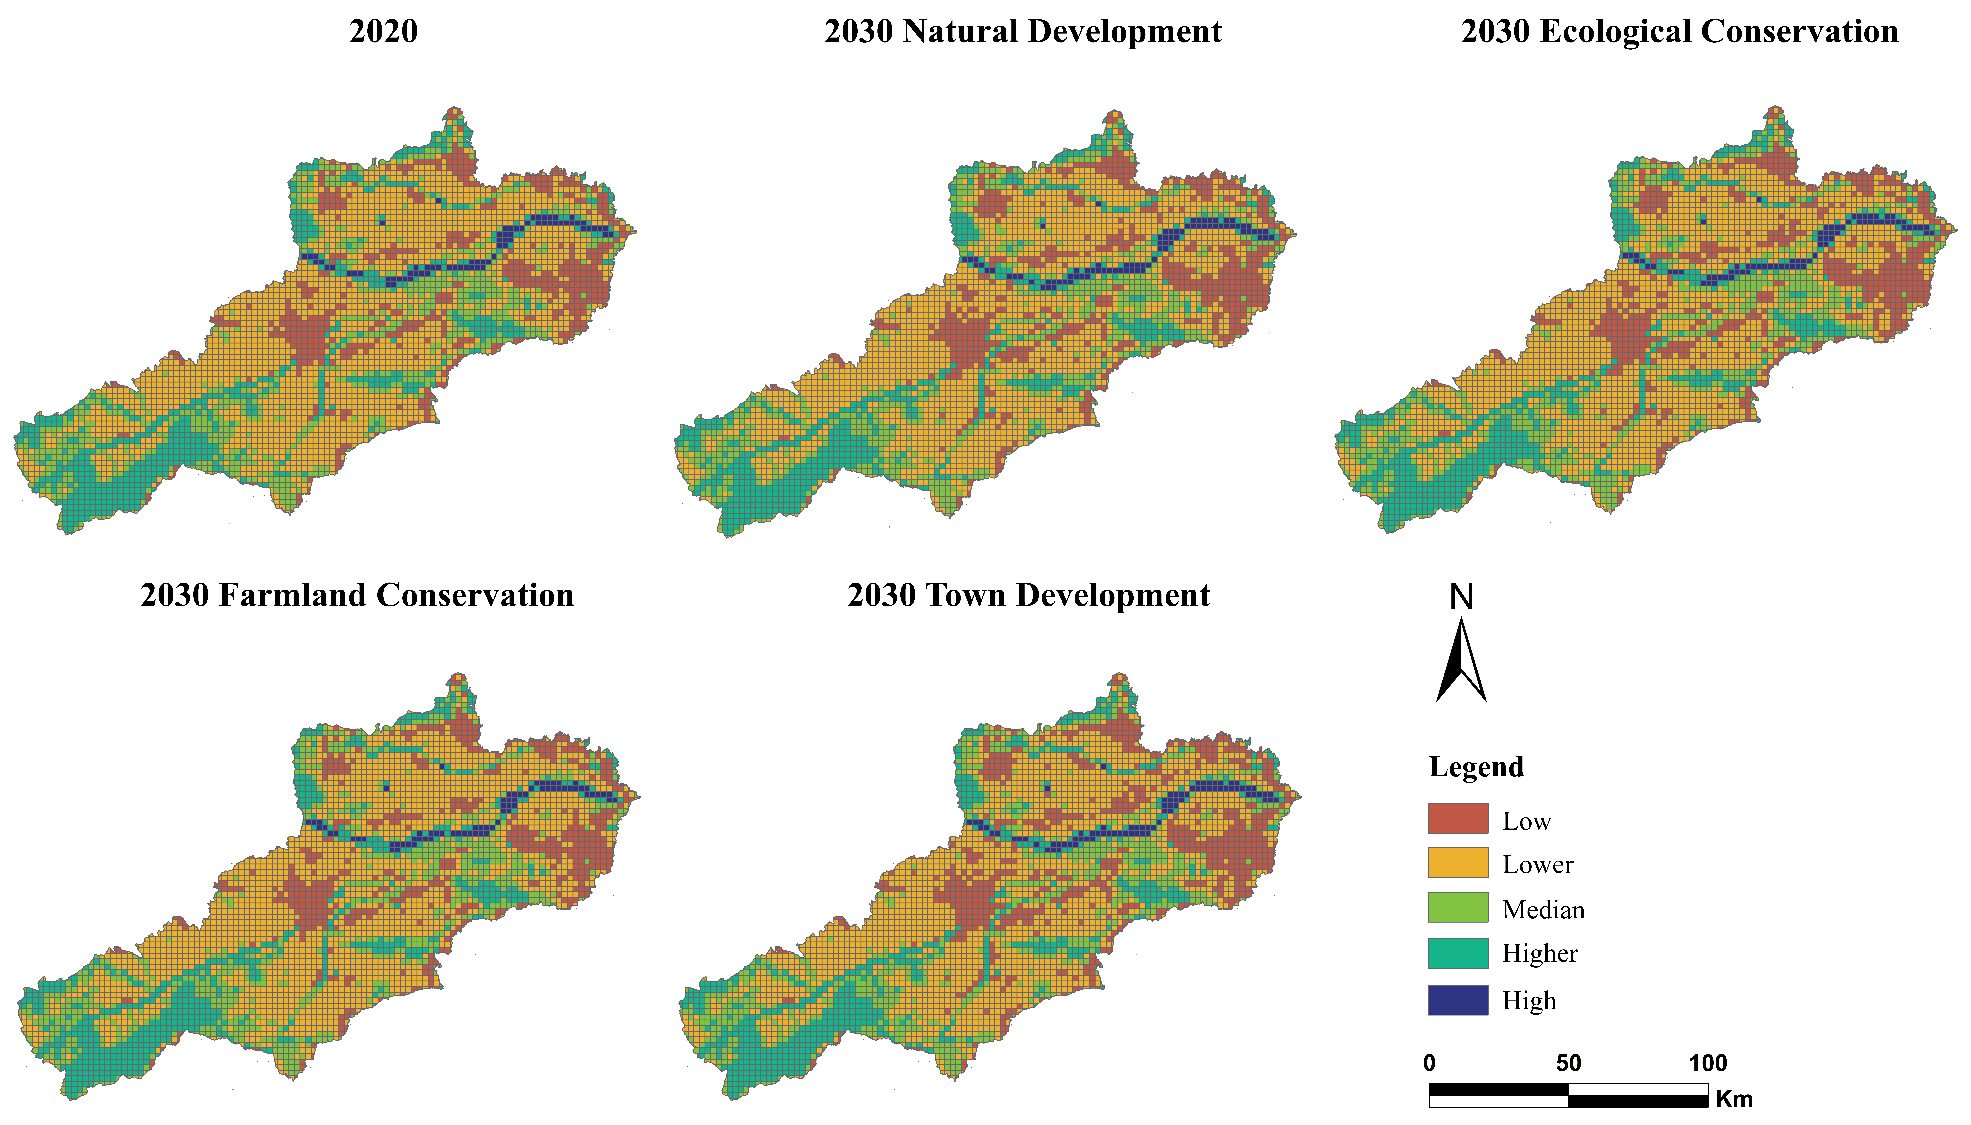
Fig. 7 shows that the distribution of ESV in the UAMLYR is closely related to LULC, exhibiting a pattern of low in the middle and high in the east and west.
Distribution patterns of ESV under the four scenarios are similar to those in 2020, but there has been a reduction in medium and higher value areas, while high-value areas have significantly increased. High-value areas are mainly situated in the Yellow River Basin, higher-value areas are found downstream of the Luo River, and medium-value areas are widely distributed in forest land and grassland regions. Low-value and lower-value areas are mostly found in the central plains and town areas. Under the NDs, the high-value areas in the lower reaches of the Yellow River expand outward, and the low-value areas in the middle increase. Under the ECs, the low-value areas in the northeastern part decrease, whereas the high-value and higher-value areas increase. Some medium-value areas in the lower reaches of the Yellow River have turned into higher-value areas, and some lower-value areas in the southwest have become medium-value areas. Under the FCs, the low-value areas have significantly increased. Under the TDs, the high-value areas have slightly decreased, while the low-value areas have significantly increased.
Analysis of Driving Forces behind ESV Spatial Differentiation
Factor Detection Results
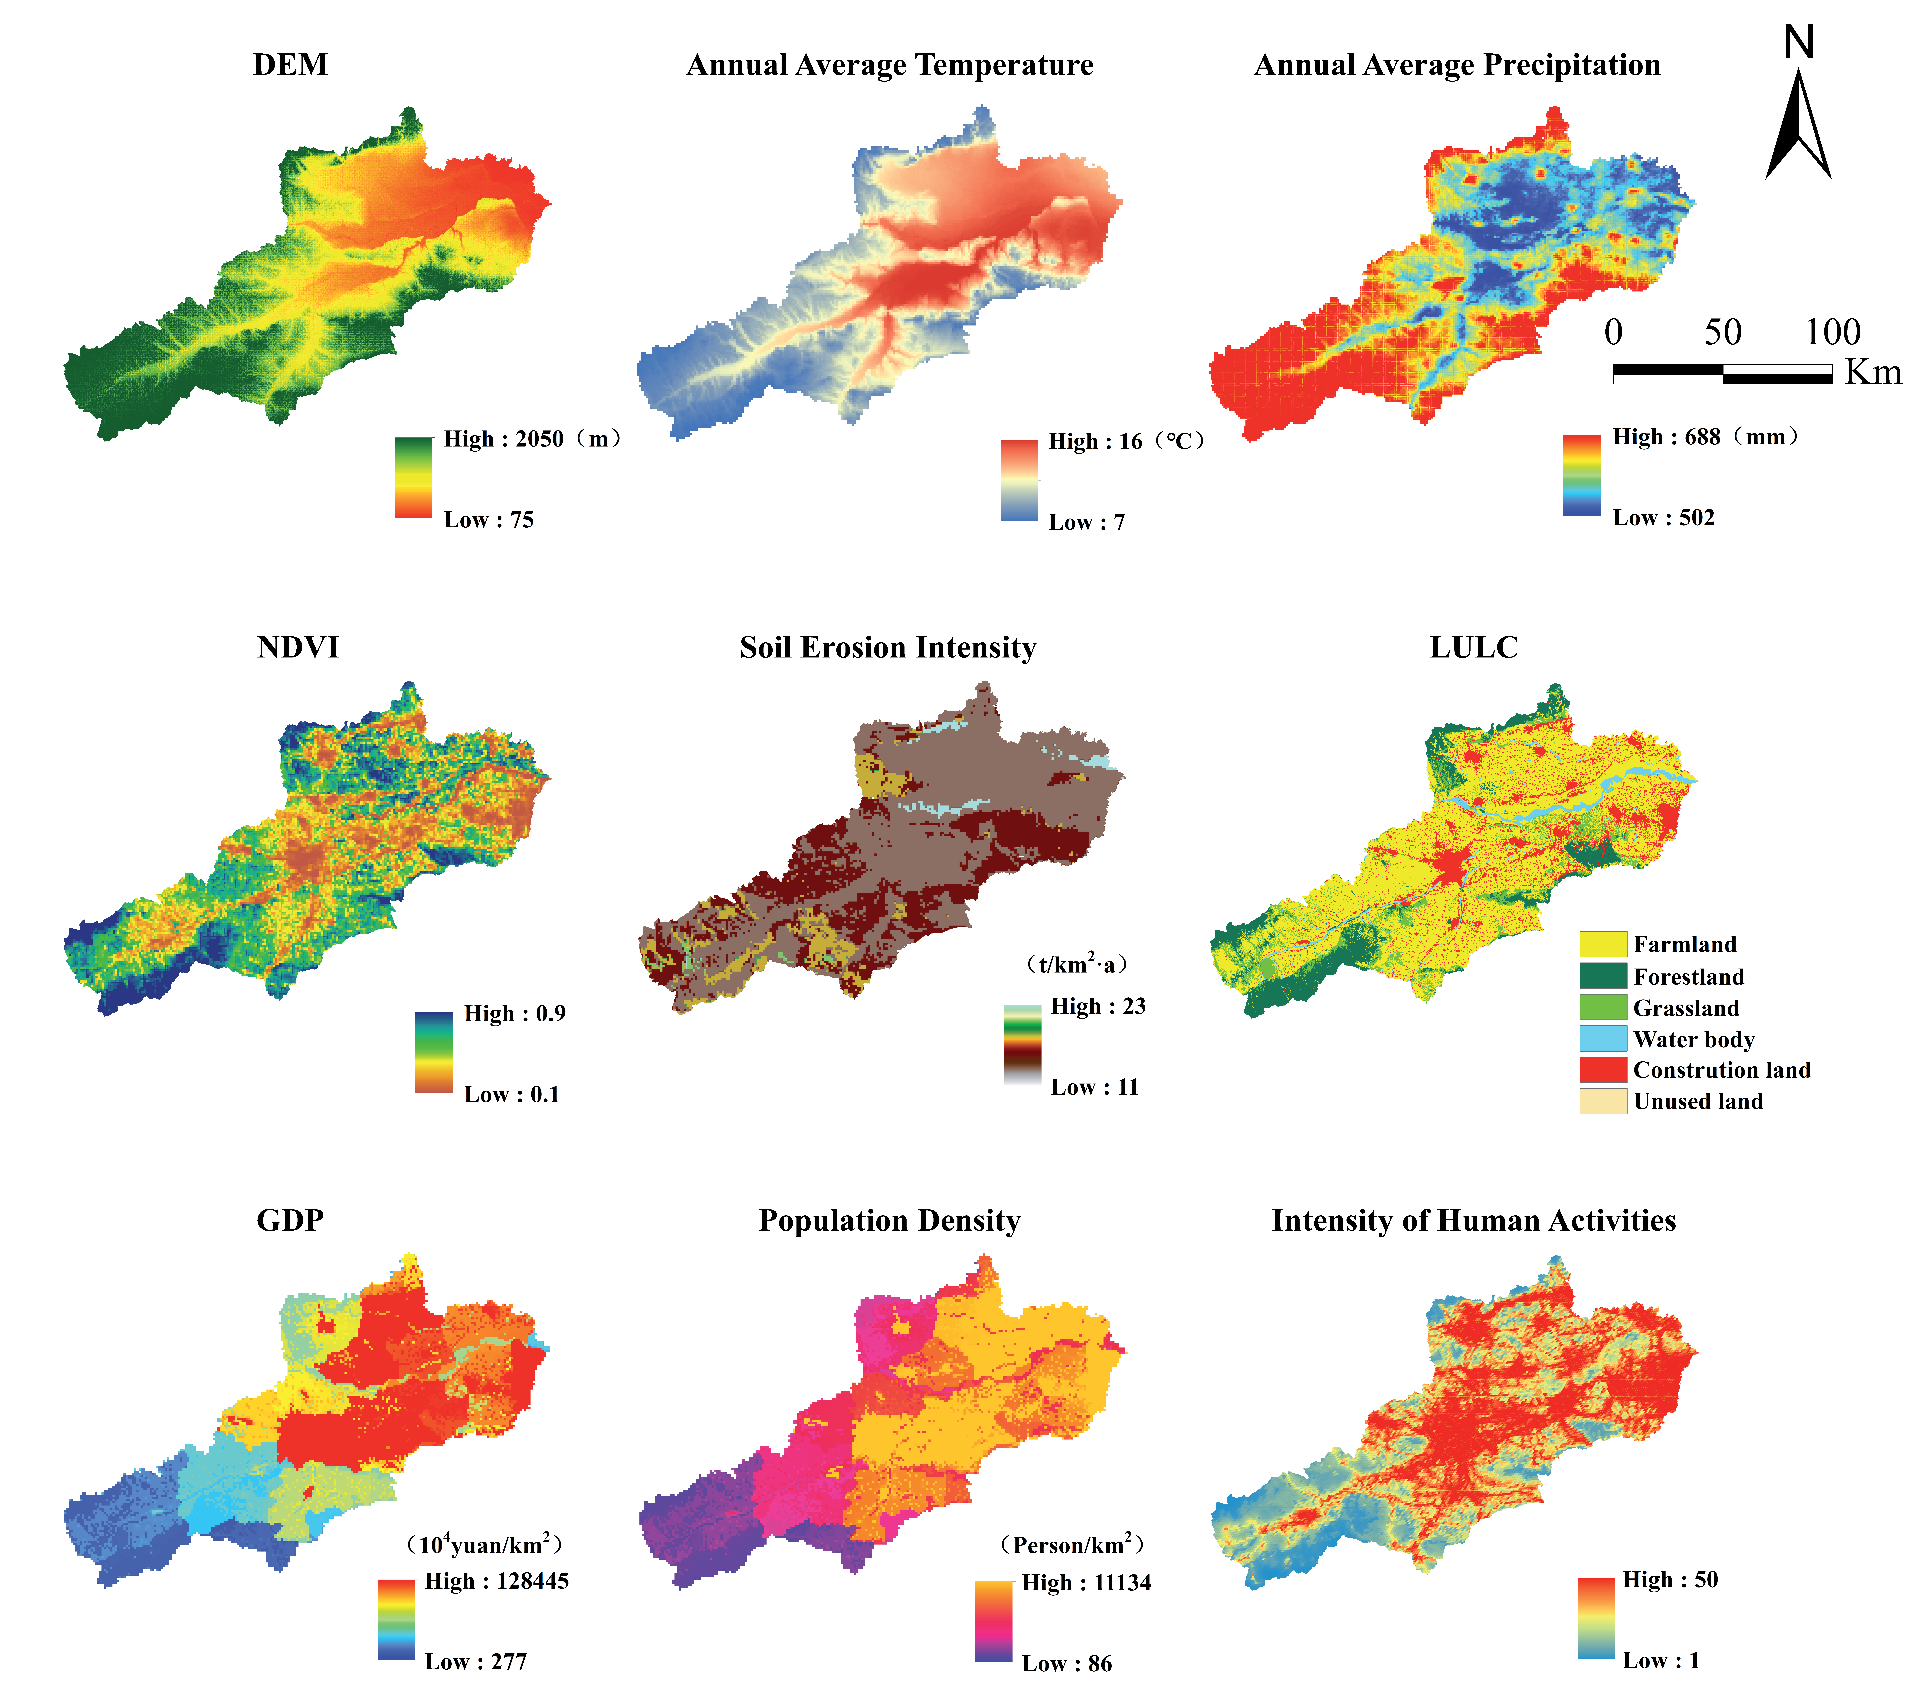
To explore the driving factors affecting ESV in the Yellow River, we selected nine indicator factors that align with the characteristics of this study, based on the specific traits of the research area, data accessibility and applicability, and by referencing previous studies [49, 50]. Then, we used the factor detection module in the Geodetector to determine the contribution rate of each driving factor to the spatial differentiation of ESV (Table 8).
The contribution rate of soil erosion intensity is 16.42%, making it the dominant factor affecting ESV spatial differentiation in the research field, mainly attributed to the insufficient flood control capacity and the reduced soil resistance to erosion due to heavy metal pollution [51]; the influence of LULC type upon ESV spatial distribution is also quite significant, with a contribution rate of 15.13%, which is closely related to ecosystems and LULC patterns and extent; the contribution rate of GDP is 13.12%, indicating that regions with higher economic development levels cause more severe damage to ecosystems, becoming a key factor in ESV spatial distribution differences; the contribution rates of NDVI, population density, and human activity intensity are close to 11.5%, making them relatively important factors in ESV spatial distribution differences; in contrast, the contribution rates of precipitation and temperature are about 9%, indicating a lesser impact on ESV spatial distribution; DEM variations within the research field are not significant, and thus have a weaker explanatory power regarding ESV spatial distribution (Fig. 8).
Interaction Detection Results
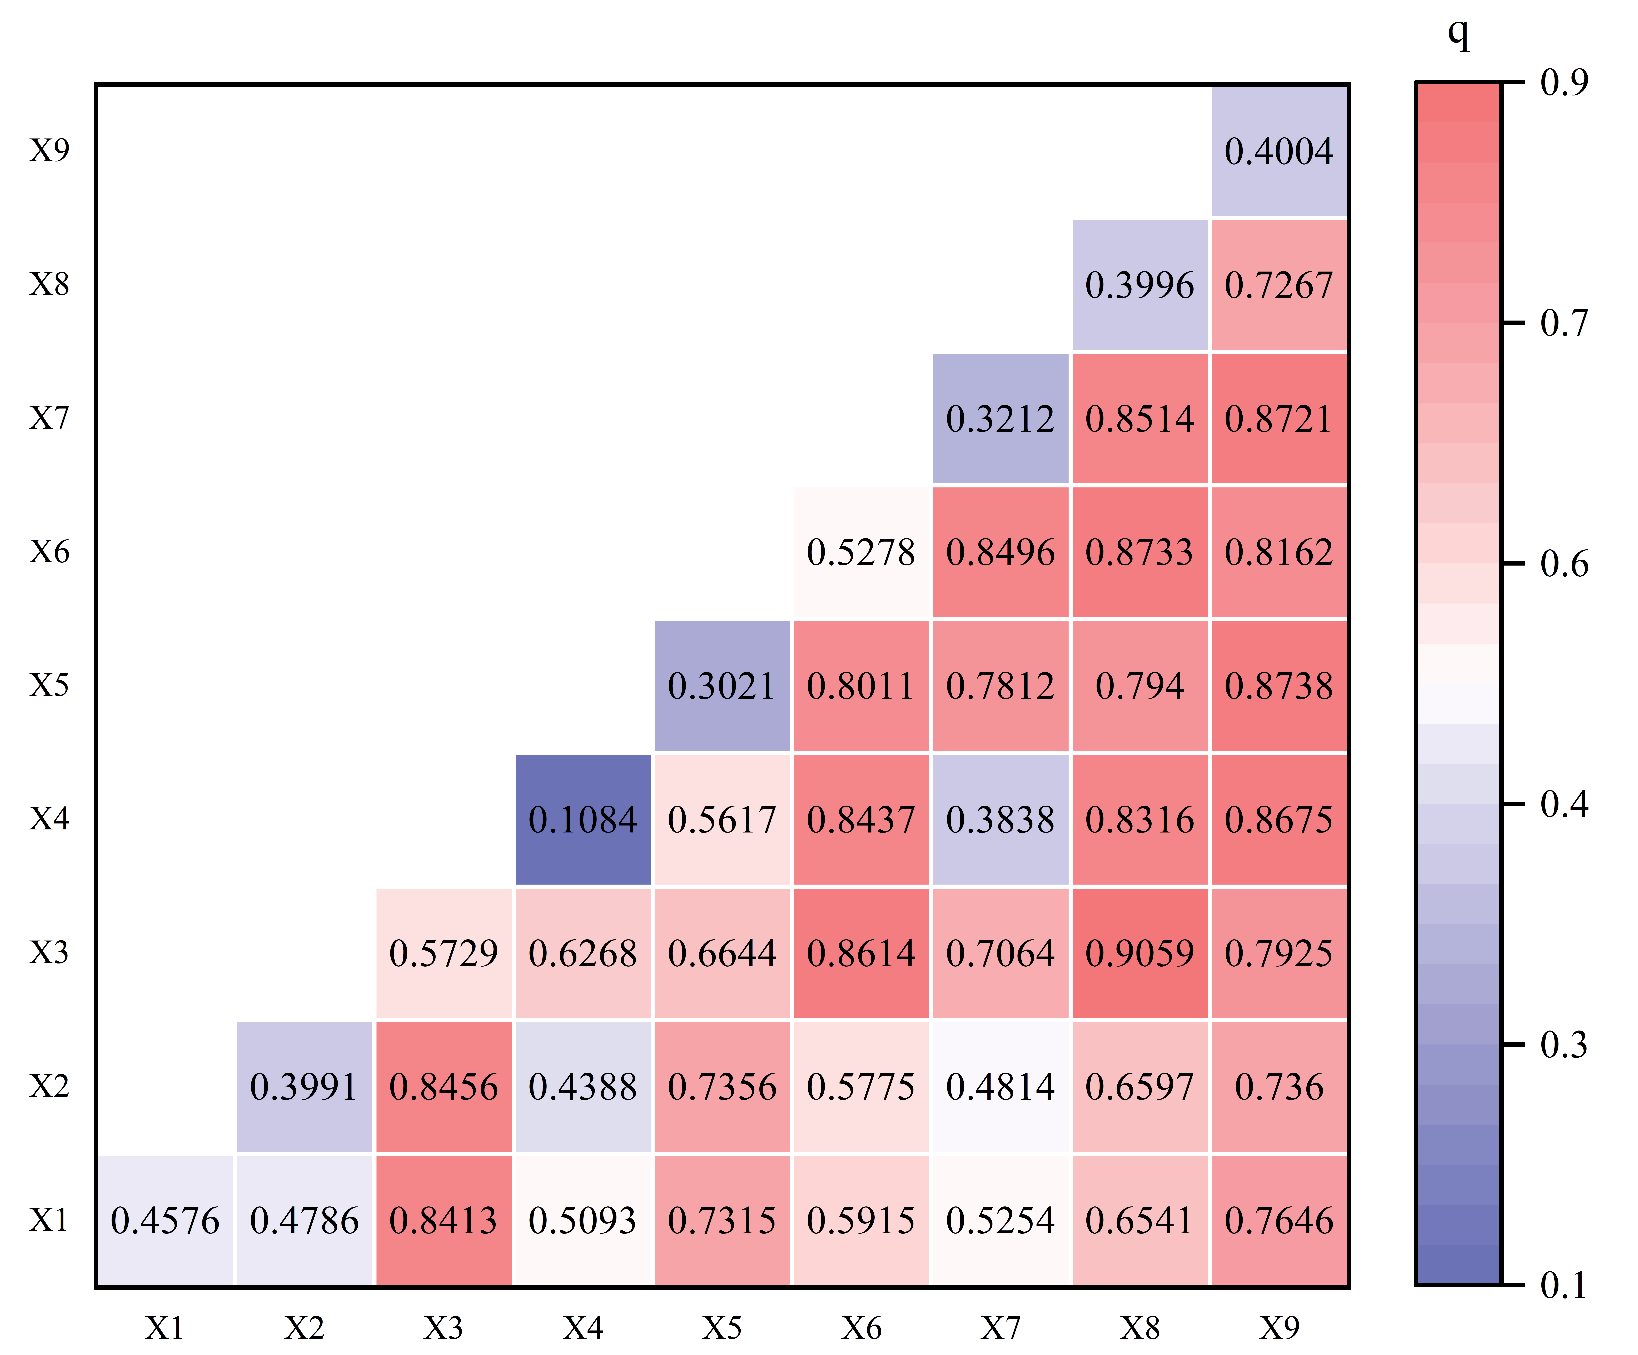
The mutual effect of the selected two variables on spatial distribution differences of regional ESV was analyzed by using the interaction detection function of the geographical detector (Fig. 9).
When the two sets of driving factors interact, their influence significantly outperforms the independent effects of single factors. Specifically, the interaction between human activity intensity and soil erosion intensity has a particularly prominent impact on spatial distribution differences of ESV in the research field, with a q value reaching 0.906; the interaction q value between NDVI and other factors is also high, further confirming the critical role of NDVI in spatial distribution differences of ESV; the interaction between LULC type and other factors also shows a clear enhancement effect, indicating that LULC methods significantly affect ESV spatial distribution; the interaction between annual mean temperature and other factors also exhibits a strong synergistic effect, highlighting the importance of climatic factors in ESV spatial distribution differences. In a word, the interaction between natural environmental factors is significantly stronger than that of socio-economic factors, highlighting the decisive role of the natural environment in the spatial distribution differences of ESV. Based on these findings, it is essential to comprehensively consider the actual conditions of the natural environment and formulate development strategies that are adapted to local conditions while developing and utilizing the UAMLYR. It aims to minimize potential damage to natural ecosystems while maximizing their ES functions, better serving human society.
Table 8.
Detection results of driving factors for spatial heterogeneity of ESV.
Discussion
Impact of LULC Variations on ESV
LULC variations are considered one of the key factors influencing global environmental change [52-54]. With the surge in population, accelerated urbanization, and intensified climate change, the service functions of global ecosystems are experiencing continuous degradation, which in turn has profound impacts on human well-being [55, 56]. Therefore, quantitatively assessing how LULC variations affect ESV is crucial for guiding the sustainable development of the global environment [57, 58].
We conducted an in-depth analysis of the LULC variations in the research field over the past three decades. The study found that LULC variations exhibit similar fluctuation trends to ESV variations. From 1990 to 2000, the ESV in the region declined; from 2000 to 2020, the ESV showed a slow upward trend, which aligned with the findings of Yin et al. [59]. The research results indicate that farmland is the main land type in the region and is also the primary contributor to conversions to other land types, providing ES such as SC, FP, and BP [60]. Due to the process of urbanization, the ESV of farmland has decreased, clearly revealing the potential impact of farmland reduction on the ESV downstream [59]. Different LULC conversion categories can have both positive and negative impacts upon ESV [61]. The mutual conversion between farmland and other land types is the main driving force behind the variations in the region’s ESV, with the conversion of farmland to water bodies, construction land to farmland, and farmland to forest land being the primary types leading to an increase in ESV. Although water bodies and forest land occupy relatively smaller areas in the region, their expansion has driven up the total ESV of the region, indicating that increasing the area of these two land types can effectively improve the region’s ESV [62]. Therefore, greater emphasis on future development ought to be placed on the protection and management of water bodies and forest land [63, 64]. The conversion of farmland to construction land and the conversion of water bodies and forest land to farmland are the main factors leading to a decrease in ESV. Against the background of rapid urbanization, various laborers have migrated to towns, and the surge in housing and consumption needs has promoted the encroachment of construction land on farmland and forest land [65]. Implementing the policy to return farmland to forest land has also reduced the area of farmland to some extent [66], jointly leading to a decrease in ESV.
In recent decades, global ES have declined by nearly 60% due to population surges and urban expansion, and such a trend is expected to continue in the future [4, 5]. However, thanks to a series of ecological restoration and protection measures implemented by the Chinese government, forest land has been restored, and the expansion of farmland and construction land has been effectively controlled; thus, the pressure on regional ESV has been alleviated [67]. In this study, the total ESV in the region has slightly declined over the past 30 years, showing a trend of rapid decline followed by a gradual increase, similar to the global trend of ESV variations [4].
The results show that all four ES demonstrated a slight downward trend, which was consistent with other studies [68]. Among different individual ES, the level of RS was the highest, which aligned with the ESV structure in provinces across China [69]. HR and CR are two key ES, ranking the highest among all types of ES. After experiencing a decline, HR services showed a recovery primarily due to the increase in water body area. However, CR services showed a yearly downward trend, possibly due to the large-scale conversion of forest land to farmland [70]. BP services, which form the foundation of ecosystem sustainability, showed an overall downward trend, indicating that the urbanization process in the region has had a negative impact on ecosystem diversity [71]. WS also showed a decline, likely related to increased water demand for agriculture and town use [72].
Pearson correlation analysis accurately calculated the correlation between ESV and LULC variations, thereby revealing the response patterns of ESV to LULC variations. This may be due to the high weight of water bodies in the equivalent factor, while unused land has a relatively lower weight, making these two land types the strongest in terms of positive and negative correlations with ESV. The results of this study show that correlation coefficients between total ESV variations and water body, as well as unused land, are both above 0.8, indicating that ESV variations are significantly influenced by variations in water body and unused land. This finding conforms to the trends reported by Guo et al. [68]. Therefore, variations in unused land and water body areas can significantly affect the total ESV. At the same time, other LULC variations, such as those in grassland and construction land, also played a non-negligible role.
This study delves into the relative importance of ESV driving factors within the research field and identifies the complex interactions among these factors. The analysis shows that ESV spatial differentiation in the research field results from the interaction of multiple factors. Among the single factors, soil erosion intensity was identified as the primary driving factor. Soil erosion intensity was explicitly determined to be the main driver of this change process, which was inconsistent with existing studies. Zhang et al. [45] pointed out that in the Lower Yellow River region, the comprehensive human impact index is the primary factor causing ESV spatial differentiation. However, the differences in the results of this study mainly stem from the differences in the research background: this study focuses on specific ecological issues, where there is a lack of large-scale ecological projects, and soil erosion problems are particularly severe, which have a long-term impact on the ecosystem; whereas the study of Zhang et al. is set within a broader socio-economic framework [45]. The differences in region and research scale may lead to significant differences in the identification of influencing factors. Further analysis reveals that the impact of natural factors stands out more prominently in this study at a smaller scale; whereas study of Zhang covers a vast area of the Lower Yellow River region, including 20 prefecture-level cities in Henan and Shandong provinces, where the cumulative effects of human activities may be more pronounced at this larger scale [45]. Additionally, Tao et al. [73] conducted a quantitative assessment of soil erosion intensity in different regions of the Loess Plateau. Results showed that the soil erosion intensity in some cities in Henan Province was particularly severe, which basically matched the situation in the research field. This further validates soil erosion intensity as the main driving factor affecting ESV spatial differentiation.
Multi-scenarios LULC Based on the PLUS Model
The results of ESV have been widely applied to uphold LULC planning over the years [74]. Rational decision-making can only be achieved when it is possible to reliably predict the impact of various development scenarios on ESV [75]. In terms of territorial space optimization, this study utilized the PLUS model to simulate the LULC distribution patterns under various scenarios for the next decade in UAMLYR. The study considered multiple scenarios, including ecological civilization construction, farmland protection, and regional economic development, aiming to reveal the trends in ESV variations under four future scenarios and to offer an important reference for urban ecological construction and land expansion [62]. Previous studies have indicated that the PLUS model performs well in simulating the spatial distribution of LULC in regions and helps policymakers to coordinate the relationship between urbanization and ecologization, thereby ensuring the sustainable development of urban economies [76]. Overall, all four future scenarios show a reduction in forest land and grassland areas, an increase in water bodies, and a sharp expansion of construction land. Under different scenarios, the conversion patterns of various land types are constrained, resulting in varying degrees of positive or negative impacts on ESV. In the FCs, the expansion of construction land is suppressed, causing a significant decrease in the conversion of farmland to construction land, thereby slowing down the urbanization process. In the ECs, the overall ESV increases substantially, primarily in view of the increased conversion of all land types to ecological land. The conversion of farmland to water bodies and forest land significantly contributes to the improvement of ESV, which is closely related to the higher ES equivalent values of forest land and water bodies adjusted by Xie et al. [44] based on specific conditions in China. The study results indicate that the TDs and the ECs are more favorable for the future development of the region. In the TDs, the urbanization process accelerates, and the overall ESV grows slowly. In the ECs, the ecosystem quality of water bodies has significantly improved, and forest ecosystems are effectively restored, ultimately leading to a substantial increase in the overall ESV. Therefore, future development policies will comprehensively impact the service functions of the regional ecosystem. The pros and cons should be fully considered, and appropriate solutions suitable for the development of the UAMLYR should be chosen to propel future socio-economic development and enhance ESV when formulating policies [77].
Limitations and Future Work
The approaches proposed in this study aim to enhance the accuracy of research in this field, and the findings can provide important references for future studies on the rational utilization of land resources and ecological environment construction. However, due to the accuracy of the data and the dynamism and complexity of ecosystems, the method still has certain limitations. First, LULC variations are a complex and dynamic process, and a simple comparison of current and historical LULC fails to fully reflect the qualitative variations in LULC types [78] or fully consider the impact of multiple development goals. Second, under the same primary land use type, the investment returns of secondary land types may vary [79]. Additionally, the value coefficients for construction land in the ESV equivalent factor table have not actually been calculated, which affects the overall ESV. However, the limitations of this study need to be addressed in future research. Future research should comprehensively consider various human and natural factors to reveal the mechanisms of ESV variations and survey synergies and trade-offs between ES [80]. This study only investigated the driving factors of spatial distribution differences of ESV in the UAMLYR in 2020. Further analysis of driving factors can be extended to many years and different spatial scales to reveal the changing patterns of the impacts of different driving factors over time and across multiple spatial levels.
Finally, in the context of national spatial planning and ecological protection strategies, future research ought to focus on the synergies and trade-offs of ES, the spatiotemporal matching of ES supply and demand, and the quantification of ES flows, so as to develop scientific responses for optimizing LULC patterns and landscape sustainability.
Conclusions
This study focuses on the LULC variations in the UAMLYR from 1990 to 2020, and uses the PLUS model to simulate the LULC pattern over the next ten years. The equivalent factor method was employed to estimate the variations in ESV. We found that over the past three decades, the region has experienced a sharp reduction in farmland and a rapid expansion of construction land. In this process, farmland became the primary source for the conversion to other LULC types, while construction land saw the largest increase in area. Four scenarios for the year 2030 were predicted, with a significant increase in water body area and a decrease in forest land and grassland areas. The ESV in the region showed a declining trend from 1990 to 2020, but under all four scenarios for 2030, the ESV is expected to be higher than that in 2020. The RS and SS are the primary ecosystem functions in the research field, and the unit area ESV of water bodies and forests is higher than that of other land types. In the single-factor detection results, soil erosion intensity had the most significant impact on regional ES. Under the dual-factor interaction, the interaction effect between human activity intensity and soil erosion intensity was the greatest. In the LULC and ESV correlation analysis, grassland and water body showed a strong positive correlation with ESV, whereas unused land and construction land exhibited a strong negative correlation.
The findings of this study aim to provide scientific guidance for coordinating regional economic development and ecological protection in fragile ecosystem areas, and to help relevant policymakers and scholars understand the future evolution patterns of LULC in the UAMLYR, and accordingly contribute to the sustainable socio-economic and ecosystem development of the region.

