

Introduction
Global climate change and intensified human activities have significantly altered land use structure and ecosystem functions, resulting in widespread ecosystem degradation [1]. Socioeconomic factors, including urbanization, industrialization, and economic growth, have exerted profound impacts on ecological environments. Empirical studies have demonstrated * liuhui119@glut.edu.cn that air pollution, soil erosion, and biodiversity loss during urbanization are closely linked to socioeconomic dynamics [2]. For example, recent research has highlighted significant fluctuations in air quality, particularly in particulate matter (PM2.5) concentrations, during the COVID-19 pandemic, underscoring the direct influence of human activities on environmental conditions [3, 4]. Ecological security patterns (ESPs), which refer to landscape patterns composed of certain key layouts in the natural landscape, are critical for ecological security maintenance, and they represent an effective way of mitigating social-ecological conflicts in ecologically fragile areas, with implications for regional sustainable development [5, 6]. Constructing urban ESPs that account for the dynamic nature of human activities, enhancing multi-scale collaborative governance, restoring ecologically damaged areas, and improving urban ecological adaptability and resilience have emerged as critical strategies for addressing ecological pressures induced by rapid urbanization.
ESPs refer to the layout and design of various natural resources and human elements in a region to obtain a multi-factor and multi-layered spatial configuration of points, lines, surfaces, and networks to cope with regional ecological challenges associated with rapid urbanization [7]. Forman et al. systematically summarized the methods of landscape pattern optimization in the 1980s [8]. In the late 1990s, Yu introduced ESP studies to China [9]. As environmental challenges in the country have become increasingly prominent, ESP research has gradually emerged as a focal point. ESP combines the principles of landscape ecology with modern urban planning theory and practice, maintains the landscape elements of ecological processes at the regional scale, and optimizes the spatial pattern of potential ecosystems. Currently, source identification-resistance surface establishment ecological corridor extraction has become a standard paradigm for obtaining security patterns [10].
Identifying ecological sources is essential for the construction of ESPs. Ecological sources are key to determining the supply of regional ecosystem services and maintaining ecological processes in the landscape, and they ensure regional ecological security and provision of essential ecosystem services [11]. To identify ecological sources, most early studies selected large ecological patches and nature reserves directly. These selections often include areas designated through policy, such as nature reserves and ecological red lines, as well as regions characterized by high ecological quality, such as forest parks [12]. The method is straightforward and operationally simple, making it easily implementable. In recent years, to ensure ecological connectivity and the integrity of ecosystem functions, methods, such as morphological spatial pattern analysis (MSPA) [13], ecological service importance assessment [14], landscape connectivity analysis [15], and habitat quality evaluation [16], are applied in ecological source identification. Compared with the former methods, MSPA relies on land use data, and it accurately identifies landscape types and structures at the pixel level. The method enhances the accuracy of selecting ecological sources when combined with landscape connectivity evaluations [17, 18].
Constructing an ecological resistance surface is essential for extracting ecological corridors, as these surfaces represent the challenges associated with gene flow, information transmission, and species movement among different ecological sources [19]. Some scholars adopt direct assignment of land cover type; however, the method has certain limitations, including overlooking internal resistance differences of different locations in the landscape under similar land types [20]. Therefore, many scholars have adopted the comprehensive index method and combined multiple resistance factors to construct resistance surfaces, such as selecting land use type, vegetation cover, slope, and other major obstacles, as resistance factors to construct resistance surfaces and ultimately establish a multi-dimensional and comprehensive ecological resistance surface [21].
Ecological corridors play a crucial role in facilitating material exchange, ecological processes, and energy flow, which considerably improves landscape connectivity, resilience, and stability [22]. The methods commonly used to simulate ecological corridors include minimal cumulative resistance (MCR) [23], ant colony algorithm [24], gravity model [25], and circuit theory [26]. The MCR model effectively delineates corridor directions and rapidly identifies the locations of ecological corridors; however, it overlooks the random movement patterns of organisms and fails to provide specific information regarding the extent of these corridors. In comparison, circuit theory is highly valuable for predicting species diffusion and migration paths, determining corridor widths, and accurately identifying node locations based on the strength of the modeled electric current [27, 28]. This method addresses the limitations of other models in representing information exchange and provides robust support for identifying key areas for national territorial ecological restoration.
The methodologies and frameworks for studying ESPs have progressively become more refined. However, the majority of current studies predominantly rely on analyses of historical or current land use. While such a static approach to constructing ecological security patterns offers some valuable insights into existing configurations, it tends to overlook the evolution of land use influenced by both natural and anthropogenic factors. This oversight limits its ability to accommodate the complexities and dynamics of ecosystems and spatial patterns. Consequently, it falls short of comprehensively examining the spatiotemporal trends of ecological security patterns and inadequately uncovers the underlying mechanisms of their evolution, in turn weakening its practical value and contemporary relevance [29]. To address the issue, researchers have employed computer and geographic information technologies that integrate methods such as system dynamics [30], cellular automata (CA) [31], CA-Markov [32], and future land use simulation (FLUS) [33]. Researchers have also examined the stability of ecological networks under various scenarios to enhance the efficiency of identifying ecological sources and corridors. Such efforts have aimed to enhance the accuracy of ecological restoration and improve ecological environment adaptability. CA has attracted considerable attention as a complex system simulation tool for analyzing spatio-temporal transformations, particularly in land use expansion simulations [34]. The CA-Markov combines Markov Chain predictions and focuses on forecasting land-type transitions under various scenarios [35]. The FLUS model enhances the traditional CA framework by incorporating an adaptive competition mechanism via roulette selection and an artificial neural network algorithm to determine land-type transition probabilities, thereby improving simulation accuracy. However, the approach does not delve deeply into the underlying factors and mechanisms of land use change. To address the gap, Liang et al. (2021) introduced the Patch-Generating Land Use Simulation (PLUS) model [36], which integrates a Land Expansion Analysis Strategy (LEAS) module with a multiclass CA random patch seed model. By analyzing historical data, the PLUS model interprets the intricate relationships among different land uses, examines land use change strategies, and projects future land use dynamics. The PLUS model effectively manages the uncertainties arising from multiple influencing factors and achieves high-precision simulations at the patch level, thereby providing robust support for sustainable planning policies. Yao et al. (2022) applied the PLUS model to predict the progression of regional ecological networks, and their research provides vital scientific insights that are crucial for formulating regional territorial space governance strategies [37, 38]. Therefore, incorporating the dynamic evolution of land use into the ESP construction process can effectively optimize the adjustment of ecological sources and corridors. This approach mitigates the adverse effects of urban expansion on the ecological environment, ensuring more resilient and sustainable urban development.
Liuzhou is a key ecological barrier in the Lingnan region of China. The region has abundant natural resources, rich biodiversity, distinctive karst landscapes, and unique mountain and natural water scenery, which contribute to its ecological value. Historically, Liuzhou has been an industrial hub in the western region of China, with substantial deposits of iron, copper, lead-zinc, and limestone. Over the years, it has evolved into Guangxi’s largest industrial city, driven primarily by the automobile, metallurgy, and machinery industries. However, the rapid pace of industrialization and urbanization has led to several environmental challenges, including encroachment of ecological spaces, degradation of mine ecosystems, soil erosion, and rocky desertification. Such persistent challenges threaten the stability and security of the regional ecosystem. Therefore, the present study aimed to construct the ESPs in Liuzhou and explore the construction measures of traditional industrial cities, which can not only lay an ecological foundation for synergistic development of the Lingnan region but can also provide a reference for similar regions focusing on planning sources and corridors around the underdeveloped areas of western China.
Table 1.
Literature review on Ecological Security Patterns (ESPs).
This study addresses the insufficient dynamic considerations in conventional ESP frameworks by adopting an ecological priority development scenario. Methodologically, we integrate the PLUS model with MSPA to identify potential ecological sources, optimize source selection through landscape connectivity evaluation and overlay analyses of nature reserves, and construct an ecological resistance surface using AHP. By combining the gravity model and circuit theory, we extract ecological corridors and establish a comprehensive ecological network. This framework enables the identification of key areas for national territorial ecological restoration, including ecological pinch points, barriers, and breakpoints. The novelty of this research lies in its synthesis of multiple methodologies and dynamic land use change simulations, which enhance traditional ESP construction approaches. Using Liuzhou – a representative karst industrial city – as a case study, this research provides theoretical and practical references for addressing the complexities of ecological restoration in similar contexts. By precisely locating priority restoration zones and proposing targeted protection and remediation measures, our study offers spatial guidance for eco-city development and ensures systematic ecological rehabilitation, contributing to both academic research and practical applications in ecological restoration.
Materials and Methods
Study Area
Liuzhou is located in the north-central part of Guangxi, China (Fig. 1) (108°32′–110°28′E, 23°54′– 26°03′N). Liuzhou encompasses a broad administrative area covering 10 districts, with a total land area of 18,600 km2. The topography of Liuzhou is diverse, featuring mountainous and hilly terrain in the north, gentle slopes and plains in the central and southern regions, and low hills in the southwest region. This reflects a natural geographical pattern, described locally as seven mountainous areas, one water area, and two farmland areas. The city has a high forest cover of 66.7%, predominantly composed of woodlands and grasslands. The total ecological land, including woodland, grassland, and water bodies, spans 18,084.70 km2, which constitutes 80% of the total area.
Data Sources
This study used data from various sources, including DEM topographic data of Liuzhou for elevation and slope extraction, meteorological data for annual temperature and precipitation averages obtained through inverse distance weighting interpolation, normalized difference vegetation index (NDVI), vector data of river networks and residential points, a survey on the of Liuzhou’s land use change, and statistical data, such as population density per capita GDP, road network data, vector data for river networks, and residential areas. The origins of research data and information used in this study are documented in Table 2.
Research Framework
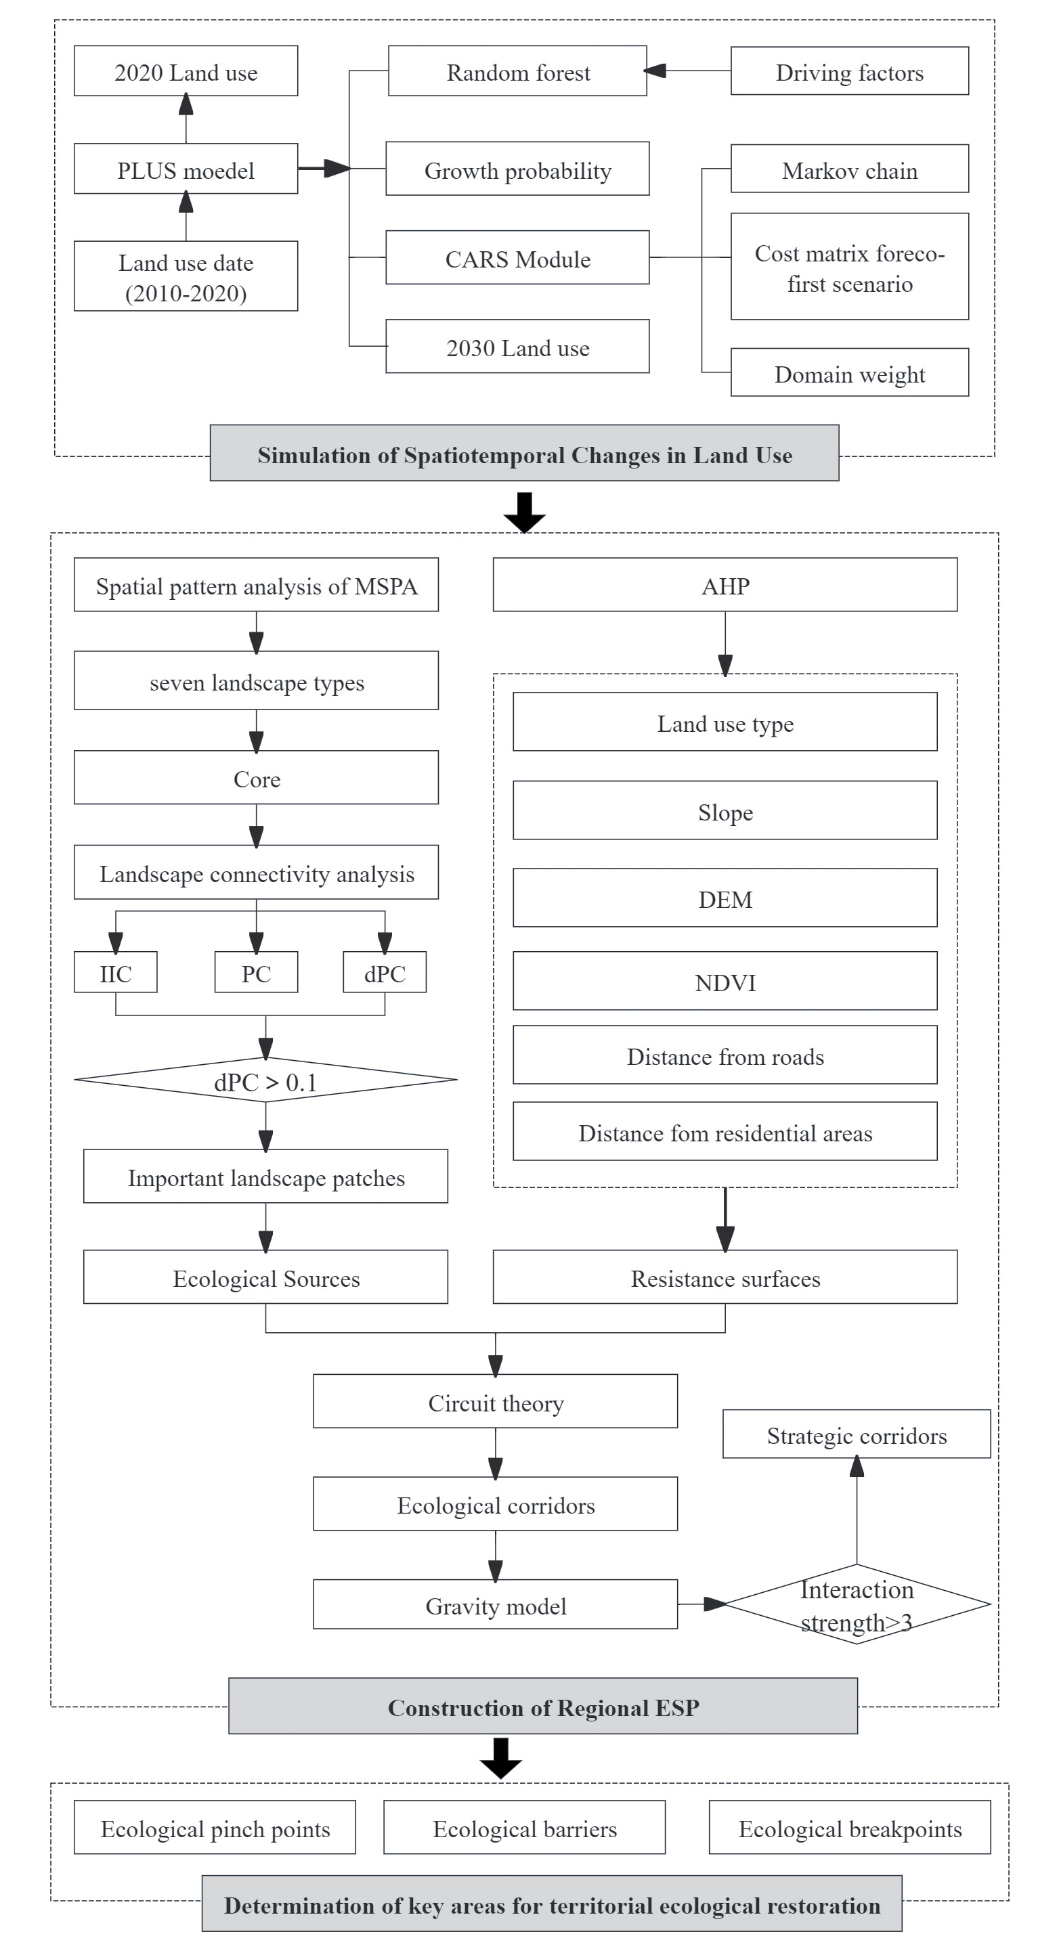
The research methodology includes several steps. First, the PLUS model was employed to simulate land use in 2030 under an ecological priority development scenario. Second, MSPA was used to identify potential ecological sources, which were refined further by evaluating landscape connectivity and performing an overlay analysis of the nature reserves. Seven indicators were used to construct an ecological resistance surface. Third, circuit theory and the gravity model were used to extract and identify important ecological corridors, thereby establishing ESPs and identifying key areas for ecological restoration, including ecological pinch points, barriers, and breakpoints. Fourth, based on the findings from the previous steps and considering the geographical and ecological characteristics of the key areas, ecological restoration strategies were conducted. The detailed technical route is illustrated in Fig. 2.
Simulation of Spatiotemporal Changes in Land Use
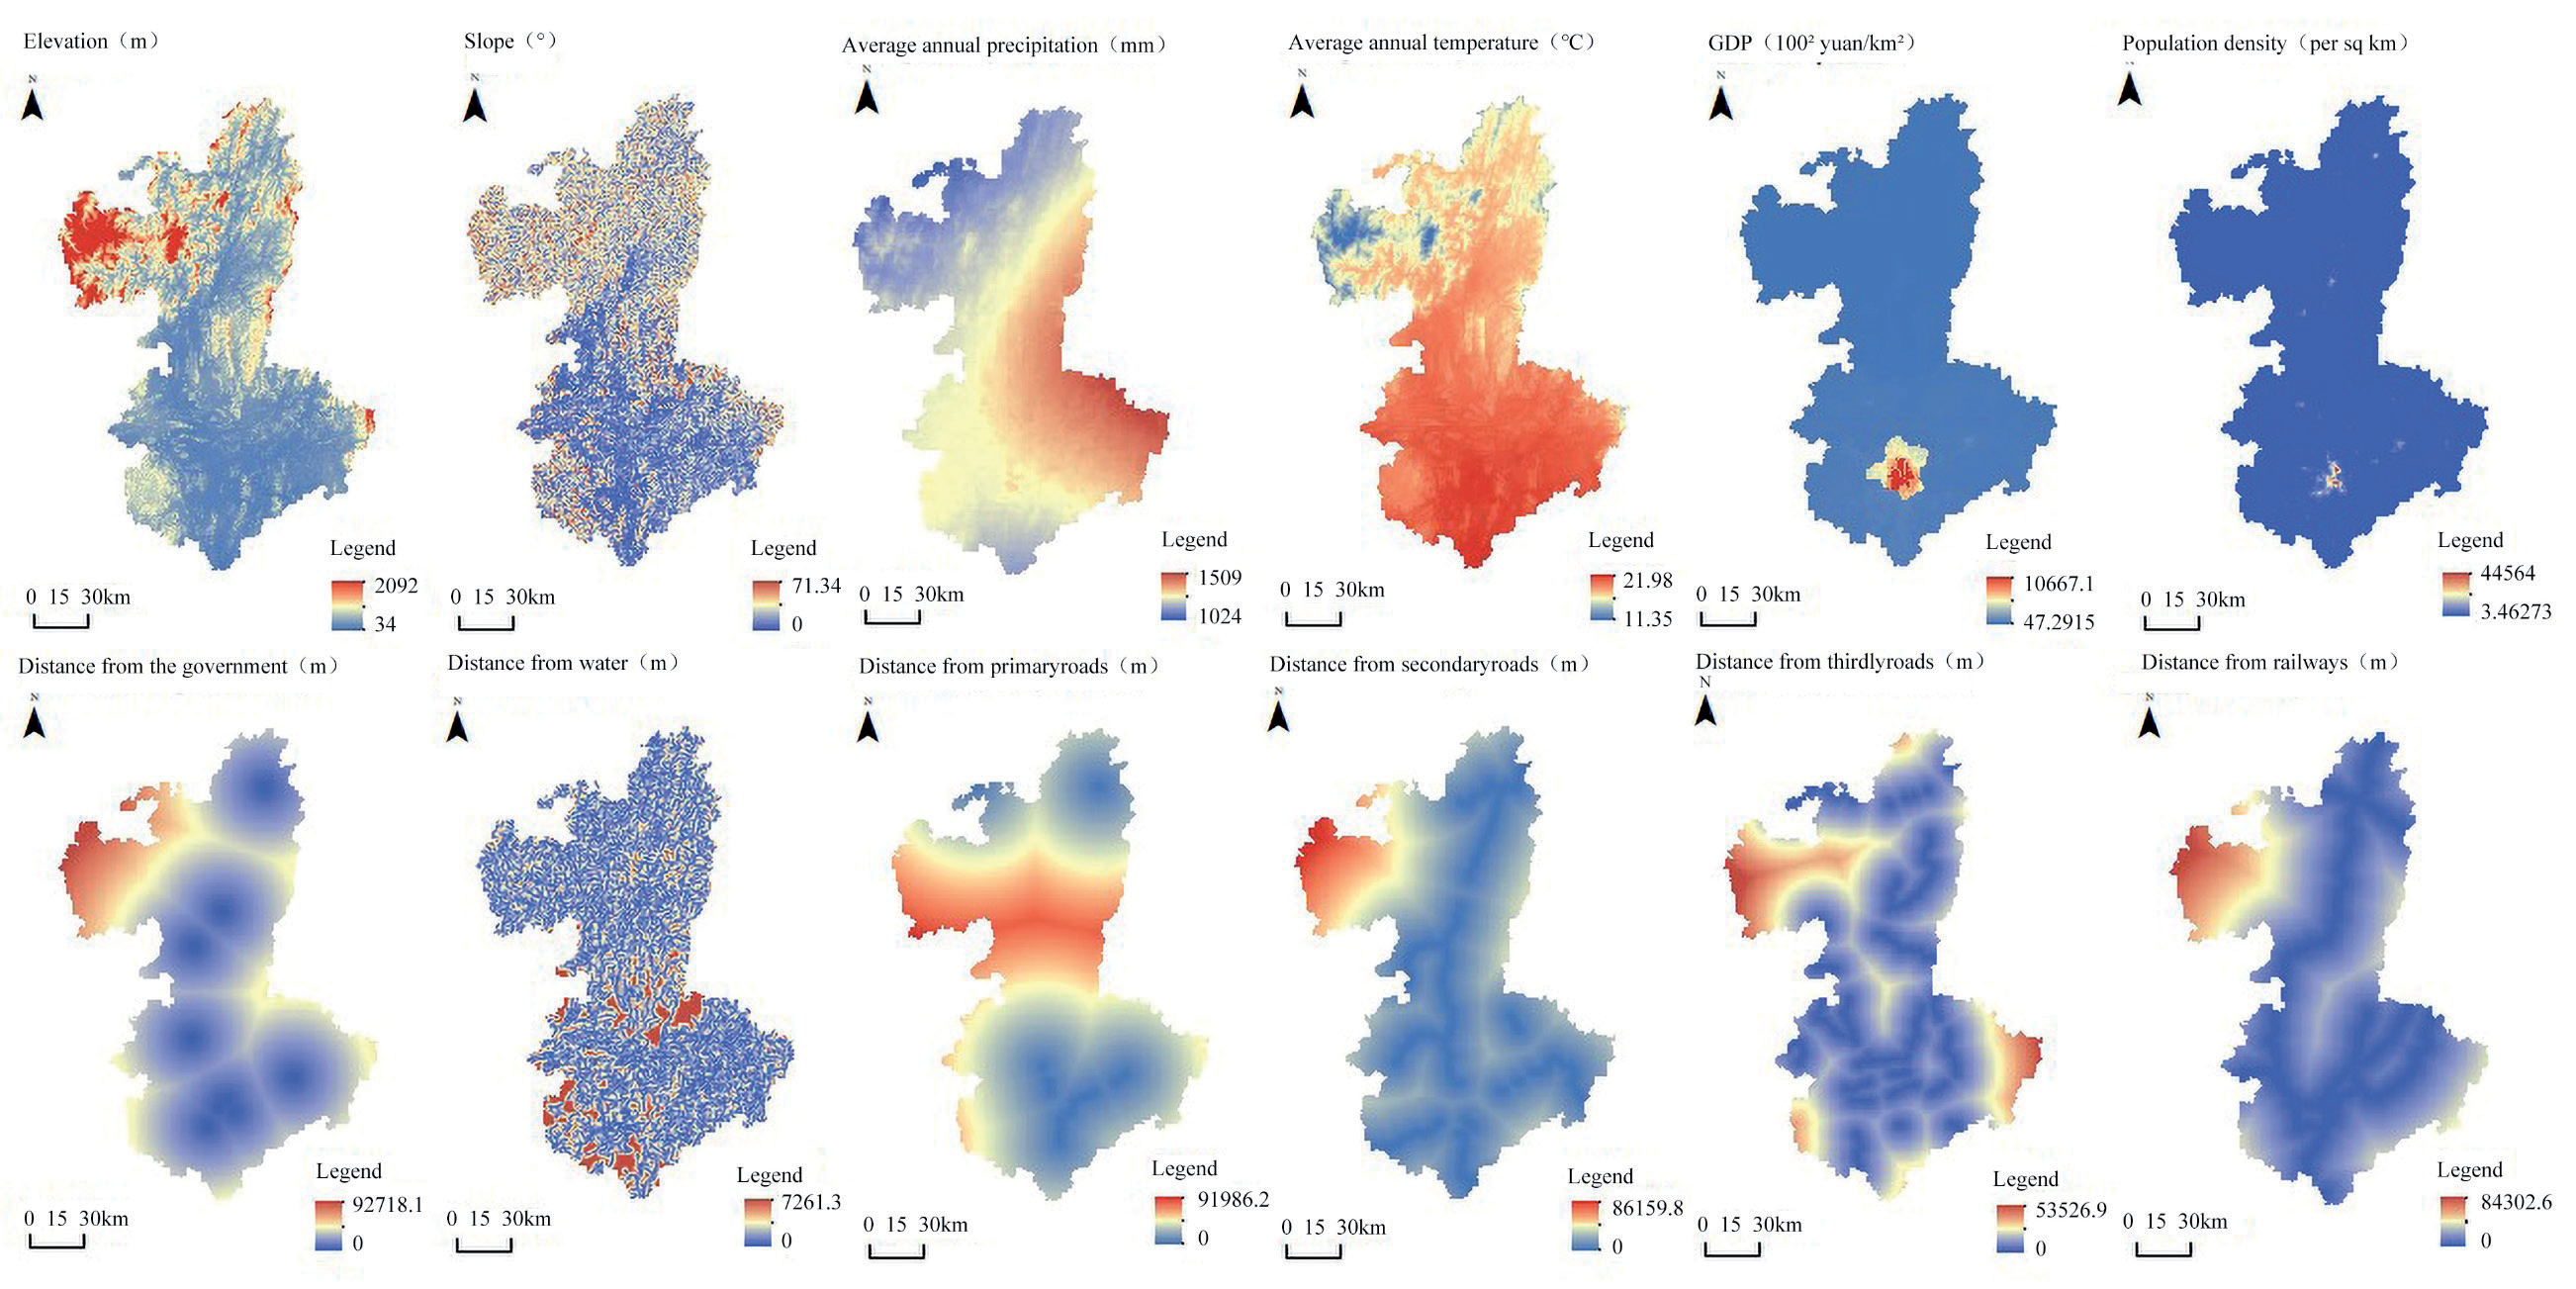
The PLUS model simulated the land use process in three steps. First, we selected 12 factors related to the natural environment, transportation, and socioeconomic aspects after examining the unique circumstances in Liuzhou and reviewing relevant literature. The factors included elevation, slope, annual average temperature, annual average precipitation, distance to water bodies, highways, county government seats, railways, population density, and GDP (Fig. 3). The integration of socioeconomic factors such as population density and GDP in the land use model ensures that the planning process considers the economic needs and social well-being of the local population. This balanced approach fosters economic development while safeguarding environmental health. The purpose of the selection was to determine the inherent connections among the variables and increase diverse land use. Second, we derived transformation rules for various land use expansion patterns and calculated the probabilities of land use change using the LEAS module based on the random forest algorithm. Finally, we set the future demand for different land uses under specific scenarios, configured key parameters such as transition matrices and neighborhood weights, and employed a CA model with multiple random patch seeds and threshold decrement rules to simulate future land use patterns with high precision.
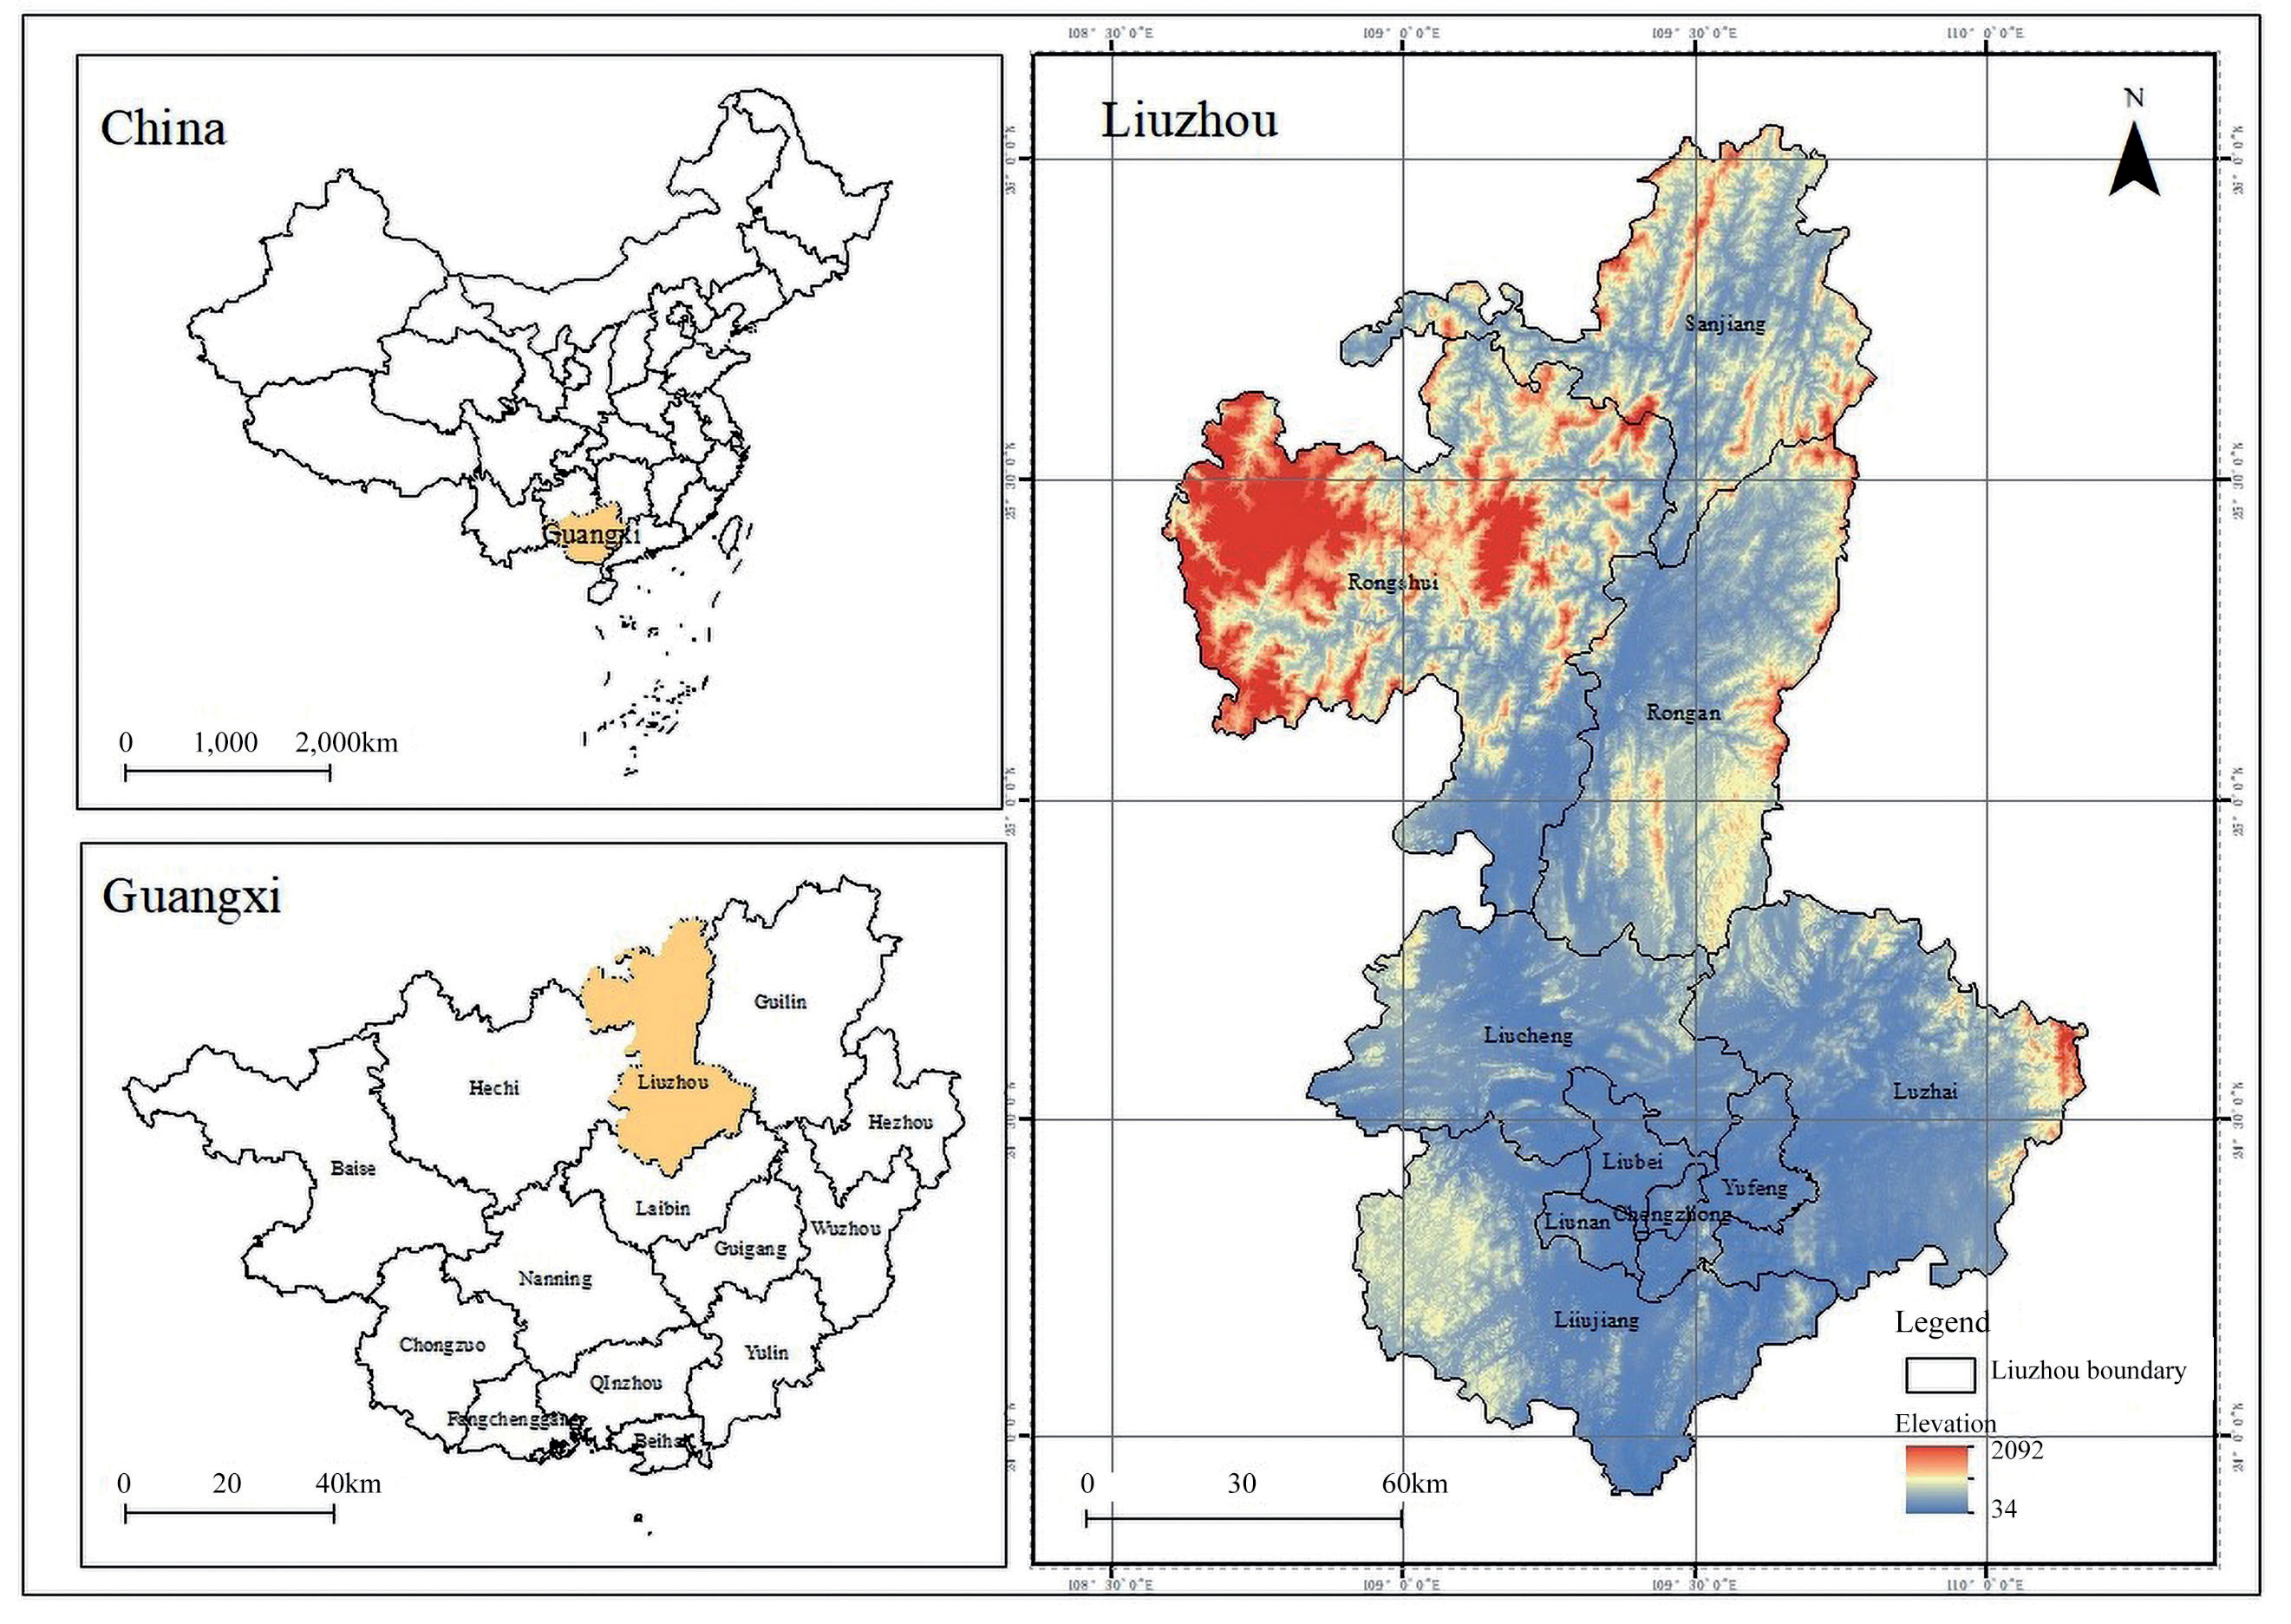
Table 2.
Research data and their sources.
Considering Liuzhou’s future economic transformation, the present study established an ecologically prioritized scenario in which ecological protection was prioritized over development by implementing stringent regulations on the transformation of natural land into different categories [39, 40]. The scenario ensures that ecological lands such as woodlands, grasslands, and water bodies are preserved and restored. This is crucial for mitigating environmental degradation and enhancing resilience against climate change. We used the PLUS model to predict land use demand trends. Similarly, we adjusted the land type conversion matrix (Table 3) based on land use transfer conditions to implement stringent ecological protection measures. Specifically, the probability of transforming woodlands and grasslands into construction land was reduced by 50%. By limiting the transformation of ecological land into construction areas and promoting the conversion of unused lands into green spaces. This approach helps in reducing urban sprawl, minimizing habitat fragmentation, and maintaining the aesthetic and recreational value of natural landscapes. Cultivated land conversion into woodland and grassland increased by 30%, and cultivated land conversion into water bodies increased by 10% under the wetland restoration policy. The conversion of unused land into woodland and grassland increased by 20%. Furthermore, we strictly limited the conversion of water bodies to other uses and considered artificial land inherently stable and unlikely to change.
During the simulation process, we extensively reviewed previous studies and integrated land use change dynamics observed in Liuzhou from 2000 to 2010 and from 2010 to 2020 to establish the neighborhood weights (Table 4). To validate the accuracy and reliability of the results, we evaluated the models using kappa and FoM coefficients. The results revealed that the kappa values ranged from 0 to 0.7, whereas the FoM values were generally below 0.3 [41, 42]. The validation of the models using Kappa and FoM coefficients ensures the accuracy and reliability of the predictions, making the study a credible reference for future research and policy formulation.
Construction of Regional ESP
Ecological Sources
Ecological sources, which are characterized by high habitat quality, stable structures, and functions, are vital for ecosystem stability, service provision, and regional ES. MSPA is based on mathematical morphology principles and provides a precise analytical approach to categorizing the functional spatial patterns of raster images. MSPA identifies key areas at the pixel level that affect landscape connectivity and enhance precision in selecting ecological source areas. In the MSPA, we classified biologically important areas, such as woodlands, grasslands, and water bodies, as foreground data, and categorized other land types as background data. We classified the foreground data into seven landscape types using an eight-neighbor analysis: perforation, islets, branches, cores, loops, edges, and bridges. The core and bridge patches have a crucial role in preserving ecological diversity and facilitating species exchange [43], particularly in Liuzhou, where unique ecosystems are under threat from urbanization and industrial activities. Maintaining biodiversity through these foundational patches ensures the resilience of ecosystems, which in turn supports genetic diversity. Notably, the edge effect of MSPA can nonlinearly affect the number of core patches, which is influenced by the width. Studies show that a 60 m width effectively reduces nutrient (nitrogen and phosphorus) loss and provides habitats for fish, birds, and other wildlife. Therefore, the present study used a 60 m edge width to identify the potential ecological sources [44]. Considering the distribution of ecological sources and current biodiversity status in the study area, we identified highly connected patches by setting specific connectivity thresholds and connection probabilities. Using MSPA results, Conefor 2.6 was used to calculate three key metrics: the number of landscape components (NC), probability of connectivity (PC), and landscape connectivity importance index (dPC). NC represents the number of interconnected patches, where a low value indicates high landscape connectivity. High PC values indicate more connectedness between patches. The dPC metric reflects the importance of a particular patch in maintaining overall landscape connectivity and quantifies the change in connectivity upon patch removal. The formulas are as follows [45]:
where αi and αj are the areas of patches i and j, respectively, measured in hm²; Pij* is the maximum product of the probabilities of all pathways connecting patches i and j; and PCremove indicates the probability of the connectivity index after removing a patch.
Based on MSPA, the identification of ecological sources can achieve relatively precise landscape patterns with minimal data. Employing quantitative methods for MSPA and landscape connectivity evaluation using multi-year land use data helps mitigate subjectivity in identifying ecological sources. However, factors such as quantification criteria, temporal and spatial scales, and data sources can result in discrepancies between the research findings and ecological restoration practices. Consequently, the present study considered the specific ecological protection needs of Liuzhou by integrating current nature reserve data, thereby enhancing the identification of ecological sources to ensure a more accurate approach. This approach ensures that development activities do not encroach on critical ecological areas, promoting a balance between economic growth and environmental conservation.
Ecological Resistance Surface
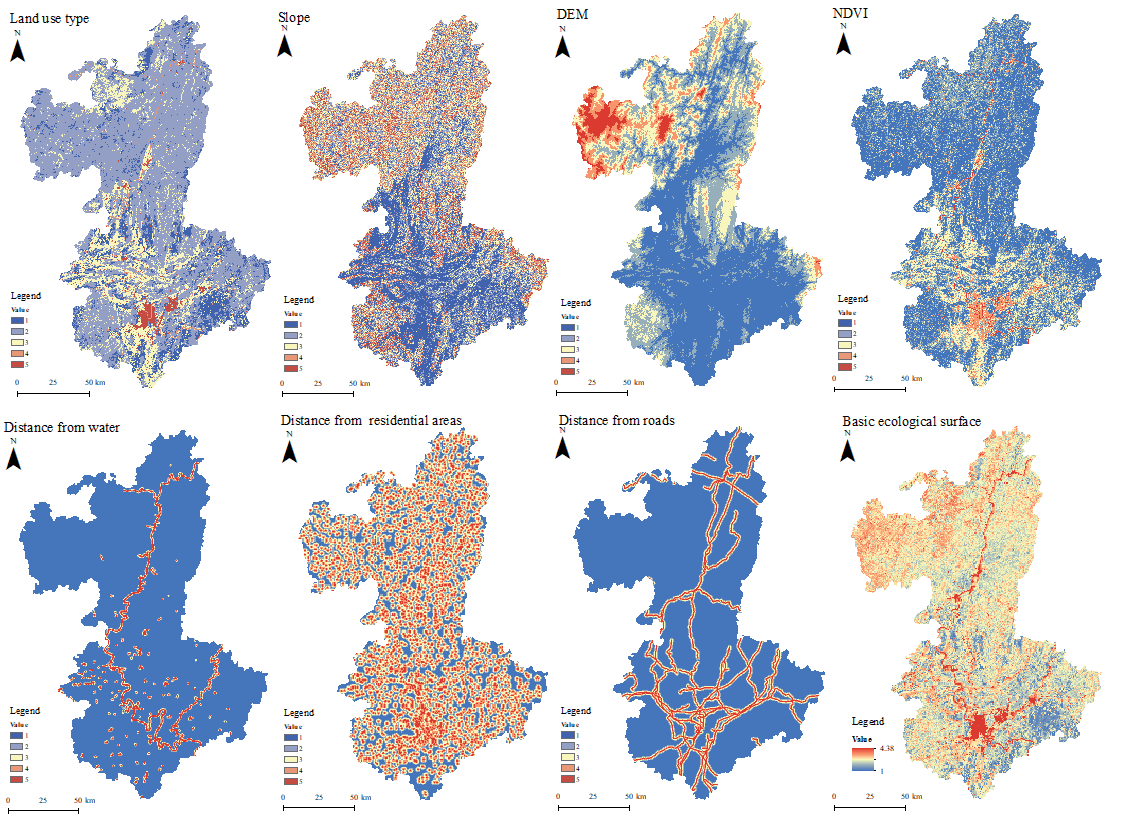
To build on previous studies [46, 47], this study selected seven indicators – land cover (land use type, vegetation coverage), topographic conditions (elevation, slope), and ecological stress (distance to water bodies, roads, and residential areas) – as resistance factors to develop an ecological resistance surface. The selected resistance factors reflect key determinants influencing ecological connectivity and habitat sustainability. During this process, we utilized ArcGIS 10.8 to calculate the distance between each evaluation unit and the resistance factors, and we employed the natural breaks classification method to determine classification intervals. Subsequently, we reclassified the resistance factors into grades ranging from 1 to 5, where low values indicated low resistance. We applied the analytic hierarchy process to assign weights to each resistance factor based on relevant literature (Table 5).
Ecological Corridors
Ecological corridors act as crucial pathways for species migration, linking ecological sources and maintaining ecological process continuity while enhancing landscape connectivity [48]. The present study employed circuit theory and the Linkage Mapper within the Circuitscape plugin to analyze adjacency relationships and distance data, identify adjacent ecological sources, and construct regional networks. Additionally, we calculated the cost-weighted distance from each grid to the ecological sources based on the ecological resistance surface and identified the lowest cumulative cost paths as optimal ecological corridors. Furthermore, we employed a gravity model to develop an interaction matrix between ecological sources, quantify interaction forces, and classify the importance of ecological corridors. According to the literature, ecological corridors with an interaction gravity value exceeding one are considered important, while those with lower values are classified as general corridors. Higher importance levels indicate closer connections between ecological sources and more frequent flows and transfers of ecological elements. The formula was as follows [49]:
Table 5.
Resistance value weights and assignments.
where Ni and Nj are the weights of patches i and j, respectively; Dij is the resistance value between patches i and j; Pi and Pj represent the resistance values of the individual patches; Lij is the cumulative resistance value of the corridor between patches i and j; Lmax is the maximum resistance value of the corridors in the study area.
Determination of Key Areas for Territorial Ecological Restoration
Ecological Pinch Points
Ecological pinch points are critical areas or irreplaceable paths within an ecological network where species migration is most likely to occur. These locations are essential for preventing the degradation or alteration of ecological spaces. In the context of circuit theory, ecological pinch points refer to specific areas where there is a concentrated flow of current densities between the ecological sources. Damage to these areas can substantially disrupt the ecological network connectivity. PinchPoint Mapper in ArcGIS 10.8 was used to determine the current density values for ecological corridor distribution based on the all-to-one mode. We classified the density values into five levels using the natural break method, with the highest-level areas being designated as ecological pinch points.
Ecological Barriers
Ecological barriers are areas where the flows of substances, information, and energy are obstructed. Eliminating these barriers can considerably impede biological connectedness between ecological sources, thereby reducing resistance to species migration. In circuit theory, ecological barriers are identified by calculating the extent of current restoration following the removal of barriers. A high recovery value indicates a considerable enhancement in the overall landscape connectivity. This study employed the Barrier Mapper in ArcGIS 10.8 based on the moving window search strategy. The cumulative current recovery values were calculated and classified into five levels using the natural break method, with the highest-level areas being identified as ecological barriers.
Ecological Breakpoints
Ecological breakpoints disrupt ecological corridors, reduce their connectivity, and hinder species migration [50]. Crisscrossing transport infrastructure, particularly railways and highways, often interrupts the connectivity between landscape patches, which threatens organism dispersal and migration. In the present study, we overlaid the vector network of railways and highways in Liuzhou with the ecological corridors to identify the ecological breakpoints.
Results
Land Use Simulation Results Based on the PLUS Model
This study employed a comprehensive modeling process to evaluate the developmental potential of various land categories in Liuzhou, providing a detailed analysis of their expansibility. According to our hypothesis, the restoration measures were responsible for the changes in land use under the ecological restoration scenario. Therefore, we integrated the requirements of territorial ecological restoration planning into our model as an anti-planning constraint to simulate land use patterns for 2030. Utilizing these simulation outcomes, we then reconstructed and analyzed the ecological security pattern for 2030, comparing it with the 2020 baseline. Through coupling the PLUS model with this analysis of the ecological security pattern, our study proposes a methodological framework for evaluating the anticipated impacts of ecological restoration initiatives. This approach not only highlights potential weaknesses and issues within current restoration plans but also facilitates the government’s ability to implement informed and dynamic policy adjustments.
The PLUS model was used in the present study to simulate land use patterns in 2030 at 10-year intervals. It was necessary to first simulate land use patterns for 2020 by extrapolating from the changes documented between 2000 and 2010. Following this, we rigorously evaluated the precision of our simulation by comparing it with actual land use data from 2020. According to the findings, the Kappa and FoM values were 0.89 and 0.17, and the overall accuracy was 94%. The PLUS model effectively simulated land use changes in Liuzhou with high accuracy and predictive capability based on the selected factors influencing land use.
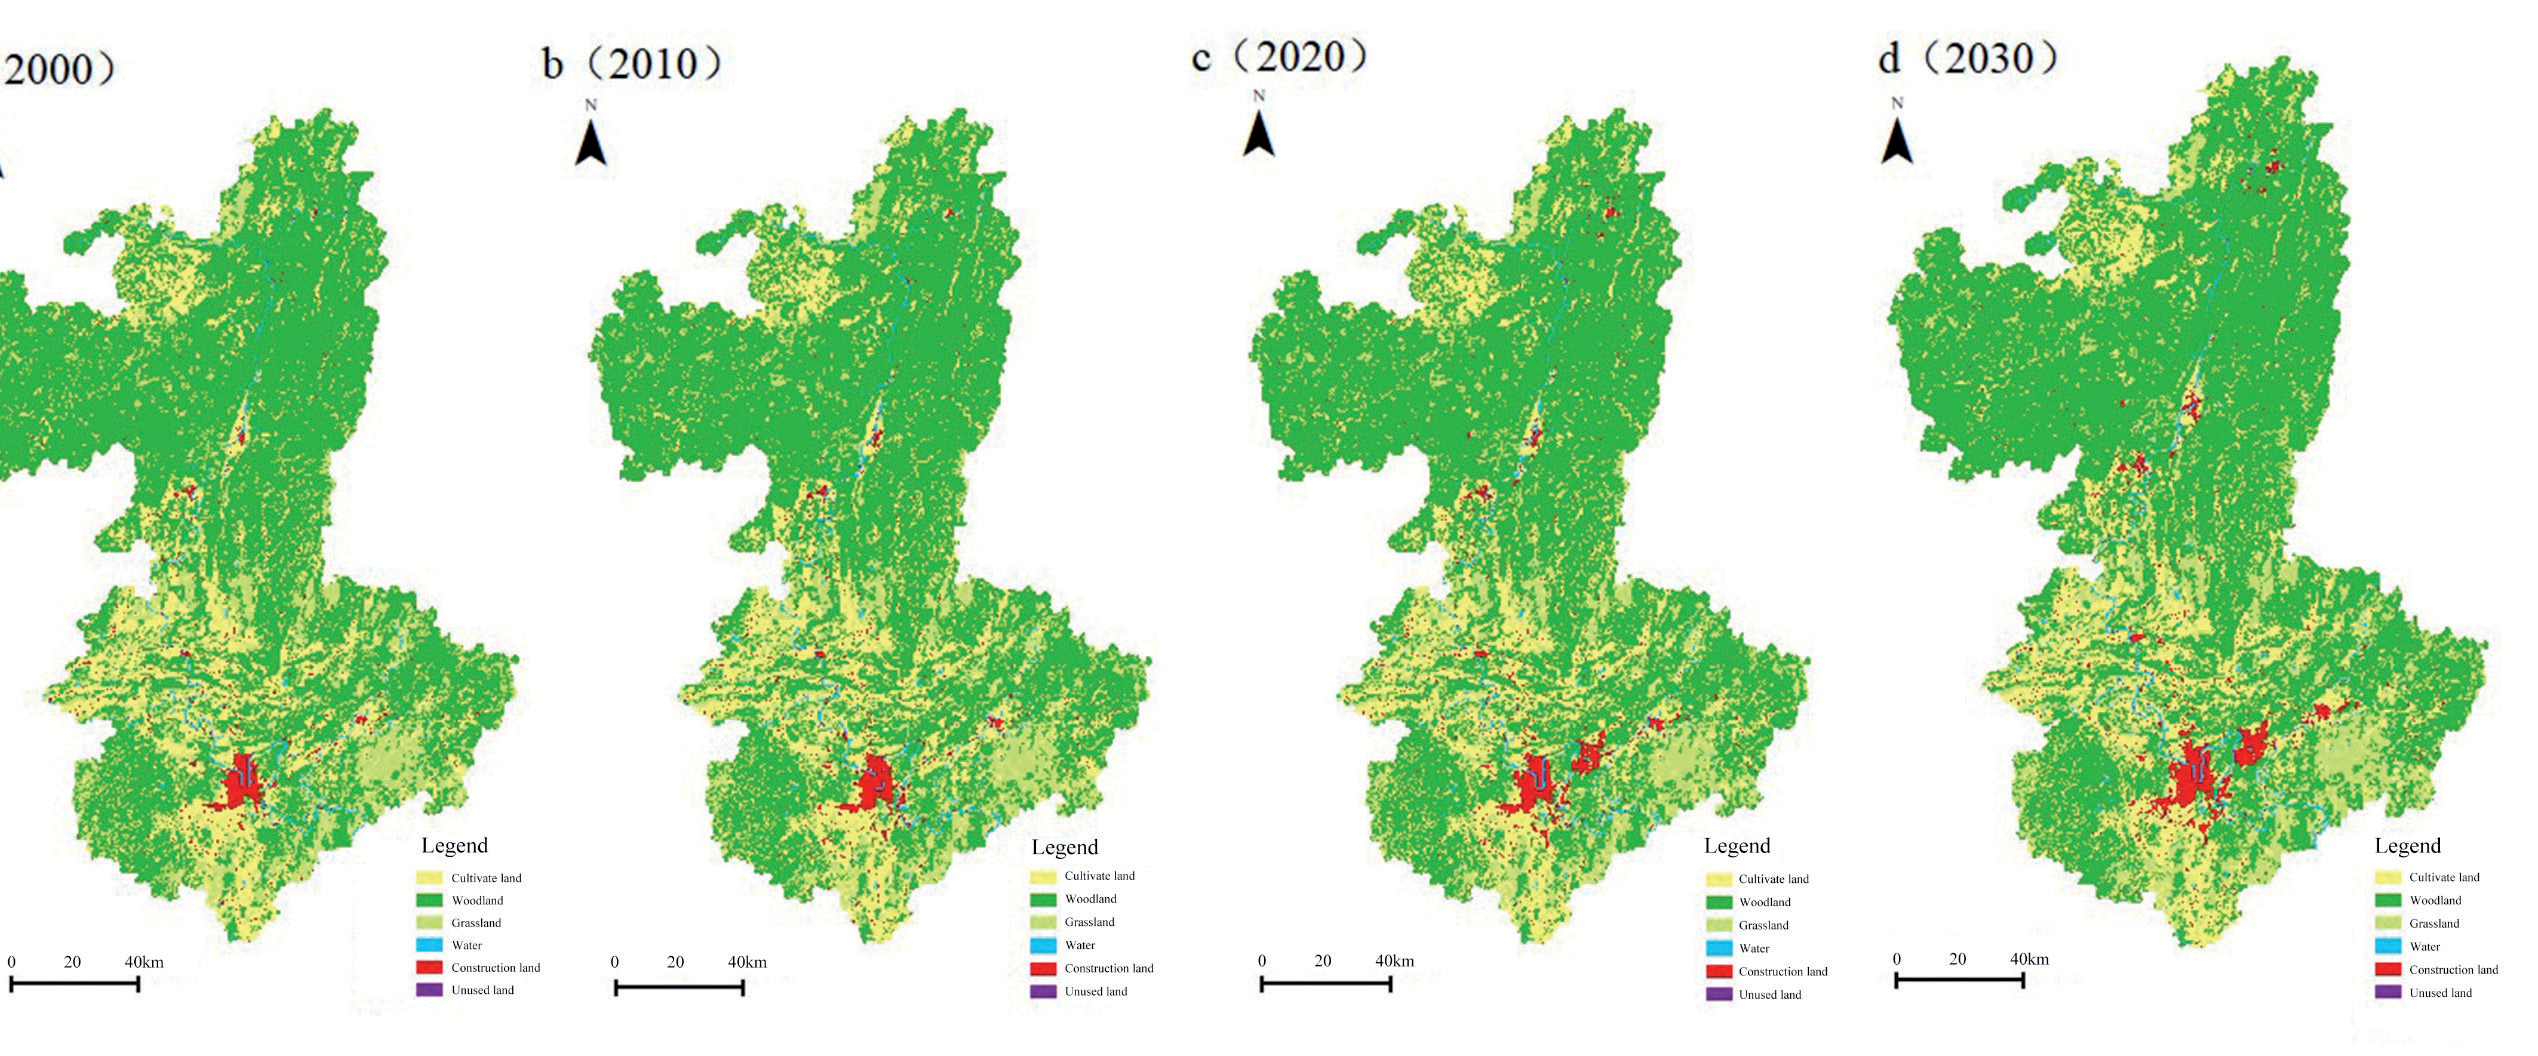
Woodlands and cultivated areas have been the dominant land use types in Liuzhou over the years. Spatially, woodlands and grasslands occurred primarily in the hilly and mountainous regions in the east, west, and north, with lesser presence in the central and southern regions. Most cultivated land was situated in the central plains and low hilly areas of the southwest region, and the cultivated land area decreased with an increase in elevation. Water bodies and unused land were distributed predominantly along the Liu and Rong River basins.
Construction land was located primarily in the plains and hilly areas of the central and southern regions, particularly in the five districts (Fig. 4). The rapid expansion of construction land in Liuzhou, particularly in the central urban areas, has led to the fragmentation of ecological lands such as woodlands and grasslands. This urban sprawl threatens the integrity of the region’s ecosystems, reducing biodiversity and disrupting ecological processes. The study highlights that construction land is projected to expand by 12.07% by 2030 (Table 6), which could further isolate large green patches and fragment ecological lands. The conversion of cultivated land to construction land is a significant concern, as it not only reduces agricultural productivity but also impacts the ecological functions of these areas. The study notes a decrease in cultivated land by 0.42% from 2020 to 2030, primarily due to urban expansion.
Construction of Regional ESP
Ecological Sources
Under the criterion of patches with an area larger than 2 km2 and a dPC at or above 0.1, 13, 12, 12, and 11 important ecological sources were identified in 2000, 2010, 2020, and 2030, respectively (Fig. 5). The findings demonstrated that dynamic land use changes affected the number of ecological sources. We identified 13 ecological sources (Table 7) covering an area of 13,994.62 km2, accounting for 60.29% of the study area, by aggregating data from the four years. Table 6 shows the areas of ecological sources and the corresponding dPC values. The maximum value of dPC was 99.96. From the data in the table, it is concluded that No. 12 and No. 6 are important ecological sources. The results of this study demonstrate that the degree of connectivity among ecological sources differs significantly between regions. This variability highlights the importance of connectivity as a key determinant in the identification and selection of ecological sources. Consequently, when selecting areas for conservation or restoration efforts, it is crucial to consider the connectivity of ecological sources to ensure the effectiveness and sustainability of these initiatives.
Ecological sources in Liuzhou exhibited substantial spatial variation, with most ecological sources occurring in the northern and eastern regions, while the central and southern regions had few ecological sources. In northern regions, such as Sanjiang, Rongshui, and Rong’an, ecological sources were abundant and extensive in major areas, including the Bajiang Scenic Area, Hongcha Valley Forest Park, and Xiangqiao Rock Scenic Area, which together constituted approximately 95.40% of the total ecological source area. In contrast, the central regions, including Chengzhong, Yufeng, and Liunan, had fewer and smaller ecological sources, accounting for less than 2% of the total area. The distribution of ecological sources in Liuzhou was influenced by natural environmental conditions and human activities. The northern and eastern regions were predominantly mountainous and hilly, with extensive woodlands and grasslands that maintain a relatively intact ecosystem structure and function. Conversely, the central and southern regions were primarily gentle plains dominated by agricultural and construction land, with frequent human activities. Although woodlands and grasslands are present in the southwestern region, their small size limits their ecological functions. An overlay analysis of the provincial nature reserves revealed an 82.92% overlap, demonstrating that the constructed ESPs comprised critical ecological areas in Liuzhou.
Ecological Resistance Surface
Both natural conditions and anthropogenic disturbance influence the ecological processes of species migration and energy flow. We constructed an ecological resistance surface for Liuzhou (Fig. 6) by considering the different elements mentioned in Table 4. The results showed considerable spatial variation in ecological resistance, with the southern region exhibiting higher resistance values than the northern region. This pattern closely corresponded to the resistance surfaces of the various land cover types. High resistance areas were located primarily in regions with intense human activities, particularly within the five districts of the main urban area and the eastern Luzhai area. Other high resistance zones were sporadic and found mainly in urban and rural residential areas, as well as in industrial and mining lands.
Different ecological resistance areas have different ecosystem functions. The low resistance areas are conducive to ecological flow, buffer the ecological source from external disturbances, and stabilize the ecological structure. Therefore, in areas with low ecological resistance, human activities should be restricted and ecological construction should be strengthened. High-resistance areas block ecological processes to a certain extent and affect connectivity between ecological sources. Hence, the ecological conservation and restoration of these areas should be promoted to effectively improve the resilience of the ecosystem and to support ecological processes.
Ecological Corridors
In the present study, ecological corridors were extracted using both identified ecological sources and a comprehensive ecological resistance surface. Based on Equation (3), we developed a gravity model matrix (Table 8). We identified 29 ecological corridors with a total length of 1740.55 km by integrating all ecological corridors while eliminating redundancies using the circuit theory. Among them, 15 ecological corridors with a total length of 828.11 km were identified as strategically important, accounting for approximately 47.58% of the total corridor length. These strategic corridors were located primarily in Rongshui, Rong’an, and Liucheng. Notably, ecological source site No. 12 in southern Rong’an was connected to key sites, such as Rongjiang, Cliff Mountain Scenic Area, Biyun Valley Recreation Area, and Hongma Mountain Scenic Area via five strategic ecological corridors. Similarly, ecological source site No. 1 in central Rongshui connected four strategic corridors to key sites, such as Sijian Daxiushan Nature Reserve, Jiuwan Dashan Nature Reserve, and Hongcha Valley Forest Park. Most of these corridors were distributed between Rongjiang, Cliff Mountain Scenic Area, Biyun Valley Recreation Area, and Hongma Mountain Scenic Area. If future urban expansion compresses existing ecological corridors or undermines their ability to perform essential ecological functions due to unforeseen factors, such corridors must become a focal point for urban planners and policymakers. Prioritizing these areas during the construction process is crucial to safeguarding their integrity and ensuring they continue to support vital ecological processes. This approach also facilitates the implementation of adaptive management strategies to mitigate potential impacts on the ecological network.
Table 6.
Changes in land use dynamics in Liuzhou.
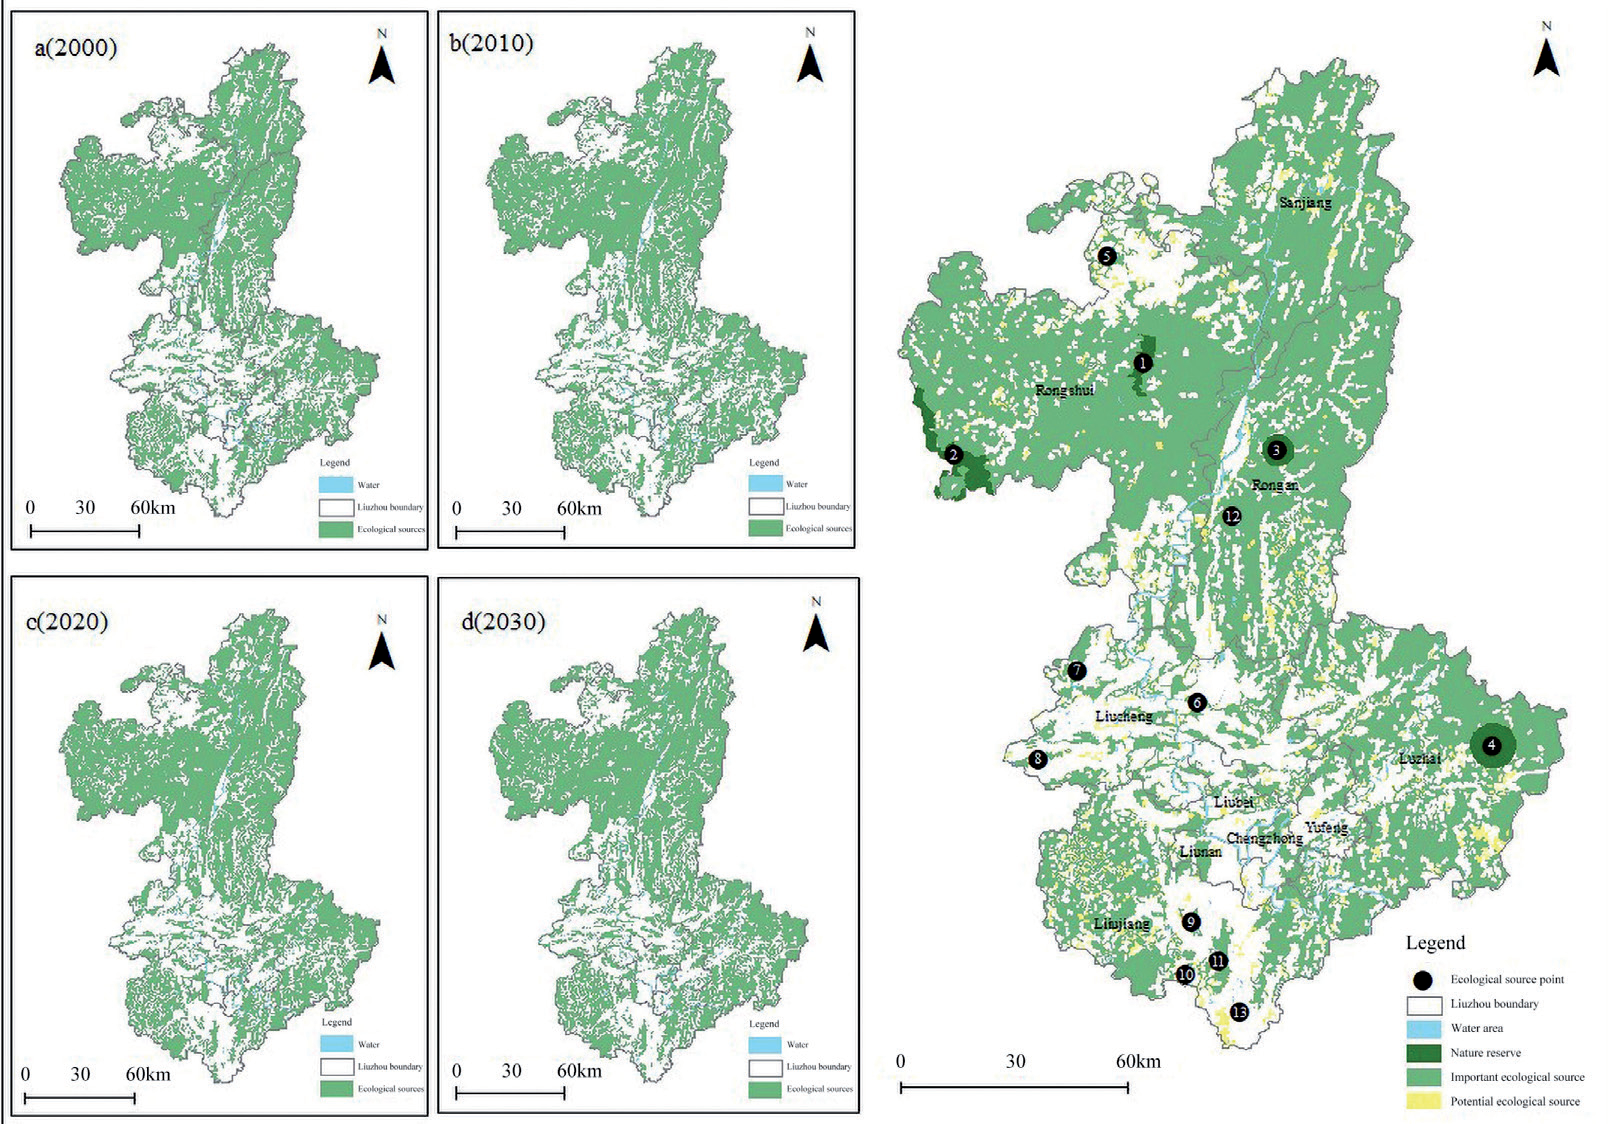
Table 7.
Distribution of ecological source areas and locations in Liuzhou.
A comparative analysis of the Liuzhou Land Spatial Overall Plan (2021-2035) confirmed that these corridors aligned with the spatial planning for land use in Liuzhou. In addition, general corridors were distributed across various counties, primarily extending from southwest to northwest along forested areas and waterways (Fig. 7). To maintain coherence and connectivity of the national land spatial ESPs of Liuzhou, these corridors require enhanced protection and restoration.
Identification of Key Ecological Restoration Areas
Ecological Pinch Points
Ecological pinch points are crucial zones between ecological sources that actively maintain regional ecological integrity and enhance network connectivity by facilitating species and resource flow. Ecological pinch points in the ecological corridors of Liuzhou were identified using the circuit theory. The corridors had a current density of 3.566, leading to the identification of 112 ecological pinch points (Table 9). The pinch points covered a total area of 336.92 km2, accounting for 1.81% of the study area. Spatially, the pinch points were primarily concentrated in the western and central regions (Fig. 8). The largest pinch point, which covered a total area of 42.17 km2, was located in the Laguo Nature Reserve in Luzhai. The area overlapped with key ecological corridors linking important ecological reserves, such as the Sijian Giant Salamander Nature Reserve and Chagou Forest Park, thereby highlighting its high ecological value. Other pinch points were mostly situated along ecological sources and corridors.
Overlay analysis of land use data showed that the pinch points were predominantly woodland (49.75%), grassland (31.10%), and cultivated land (17.33%), with water and construction land accounting for only 1.03% and 0.78%, respectively. Further analysis of the comprehensive resistance surface indicated that the pinch points had relatively low resistance values. This feature promotes species migration by facilitating movement through areas of low resistance and enhancing ecological connectivity. Therefore, such regions should be prioritized for protection to maintain overall landscape connectivity. Fragmentation of these pinch points could adversely affect the overall landscape function.
Ecological Barriers
Through identification and analysis of ecological barriers, targeted actions, such as softening or removing these obstacles, can significantly enhance overall ecosystem connectivity. Reducing ecological resistance in such a manner supports more effective species migration and dispersal, ultimately leading to improved ecological integrity and resilience. Implementing such measures is crucial for maintaining and enhancing ESP functionality. A total of 168 ecological barriers were identified in Liuzhou using the circuit theory (Table 10), with the highest current density of ecological corridors being 3.00. The ecological barriers covered a combined total area of 164.91 km2, accounting for 0.89% of the total area, with the largest ecological barrier covering 21.28 km2. Spatially, ecological barriers were primarily located in the northern and southwestern regions (Fig. 9), particularly near major transportation routes, such as railways and highways. Notably, the Yuanbaoshan area in Rongshui County and the Longfeng Reservoir area in Liujiang District had a high number and extensive areas of ecological barriers, which were largely fragmented. Overlay analysis of land use data indicated that the ecological barriers were predominantly woodland (54.61%) and cultivated land (34.40%), with smaller proportions of water bodies (4.31%), grasslands (3.70%), and construction land (3.36%) being observed. Further analysis of the comprehensive resistance surface revealed that large ecological barriers were primarily located in construction land or its surrounding areas, which experienced high levels of human disturbance and ecological resistance, thereby negatively impacting landscape connectivity.
Table 8.
Ecological source interaction matrix derived from the gravity model.
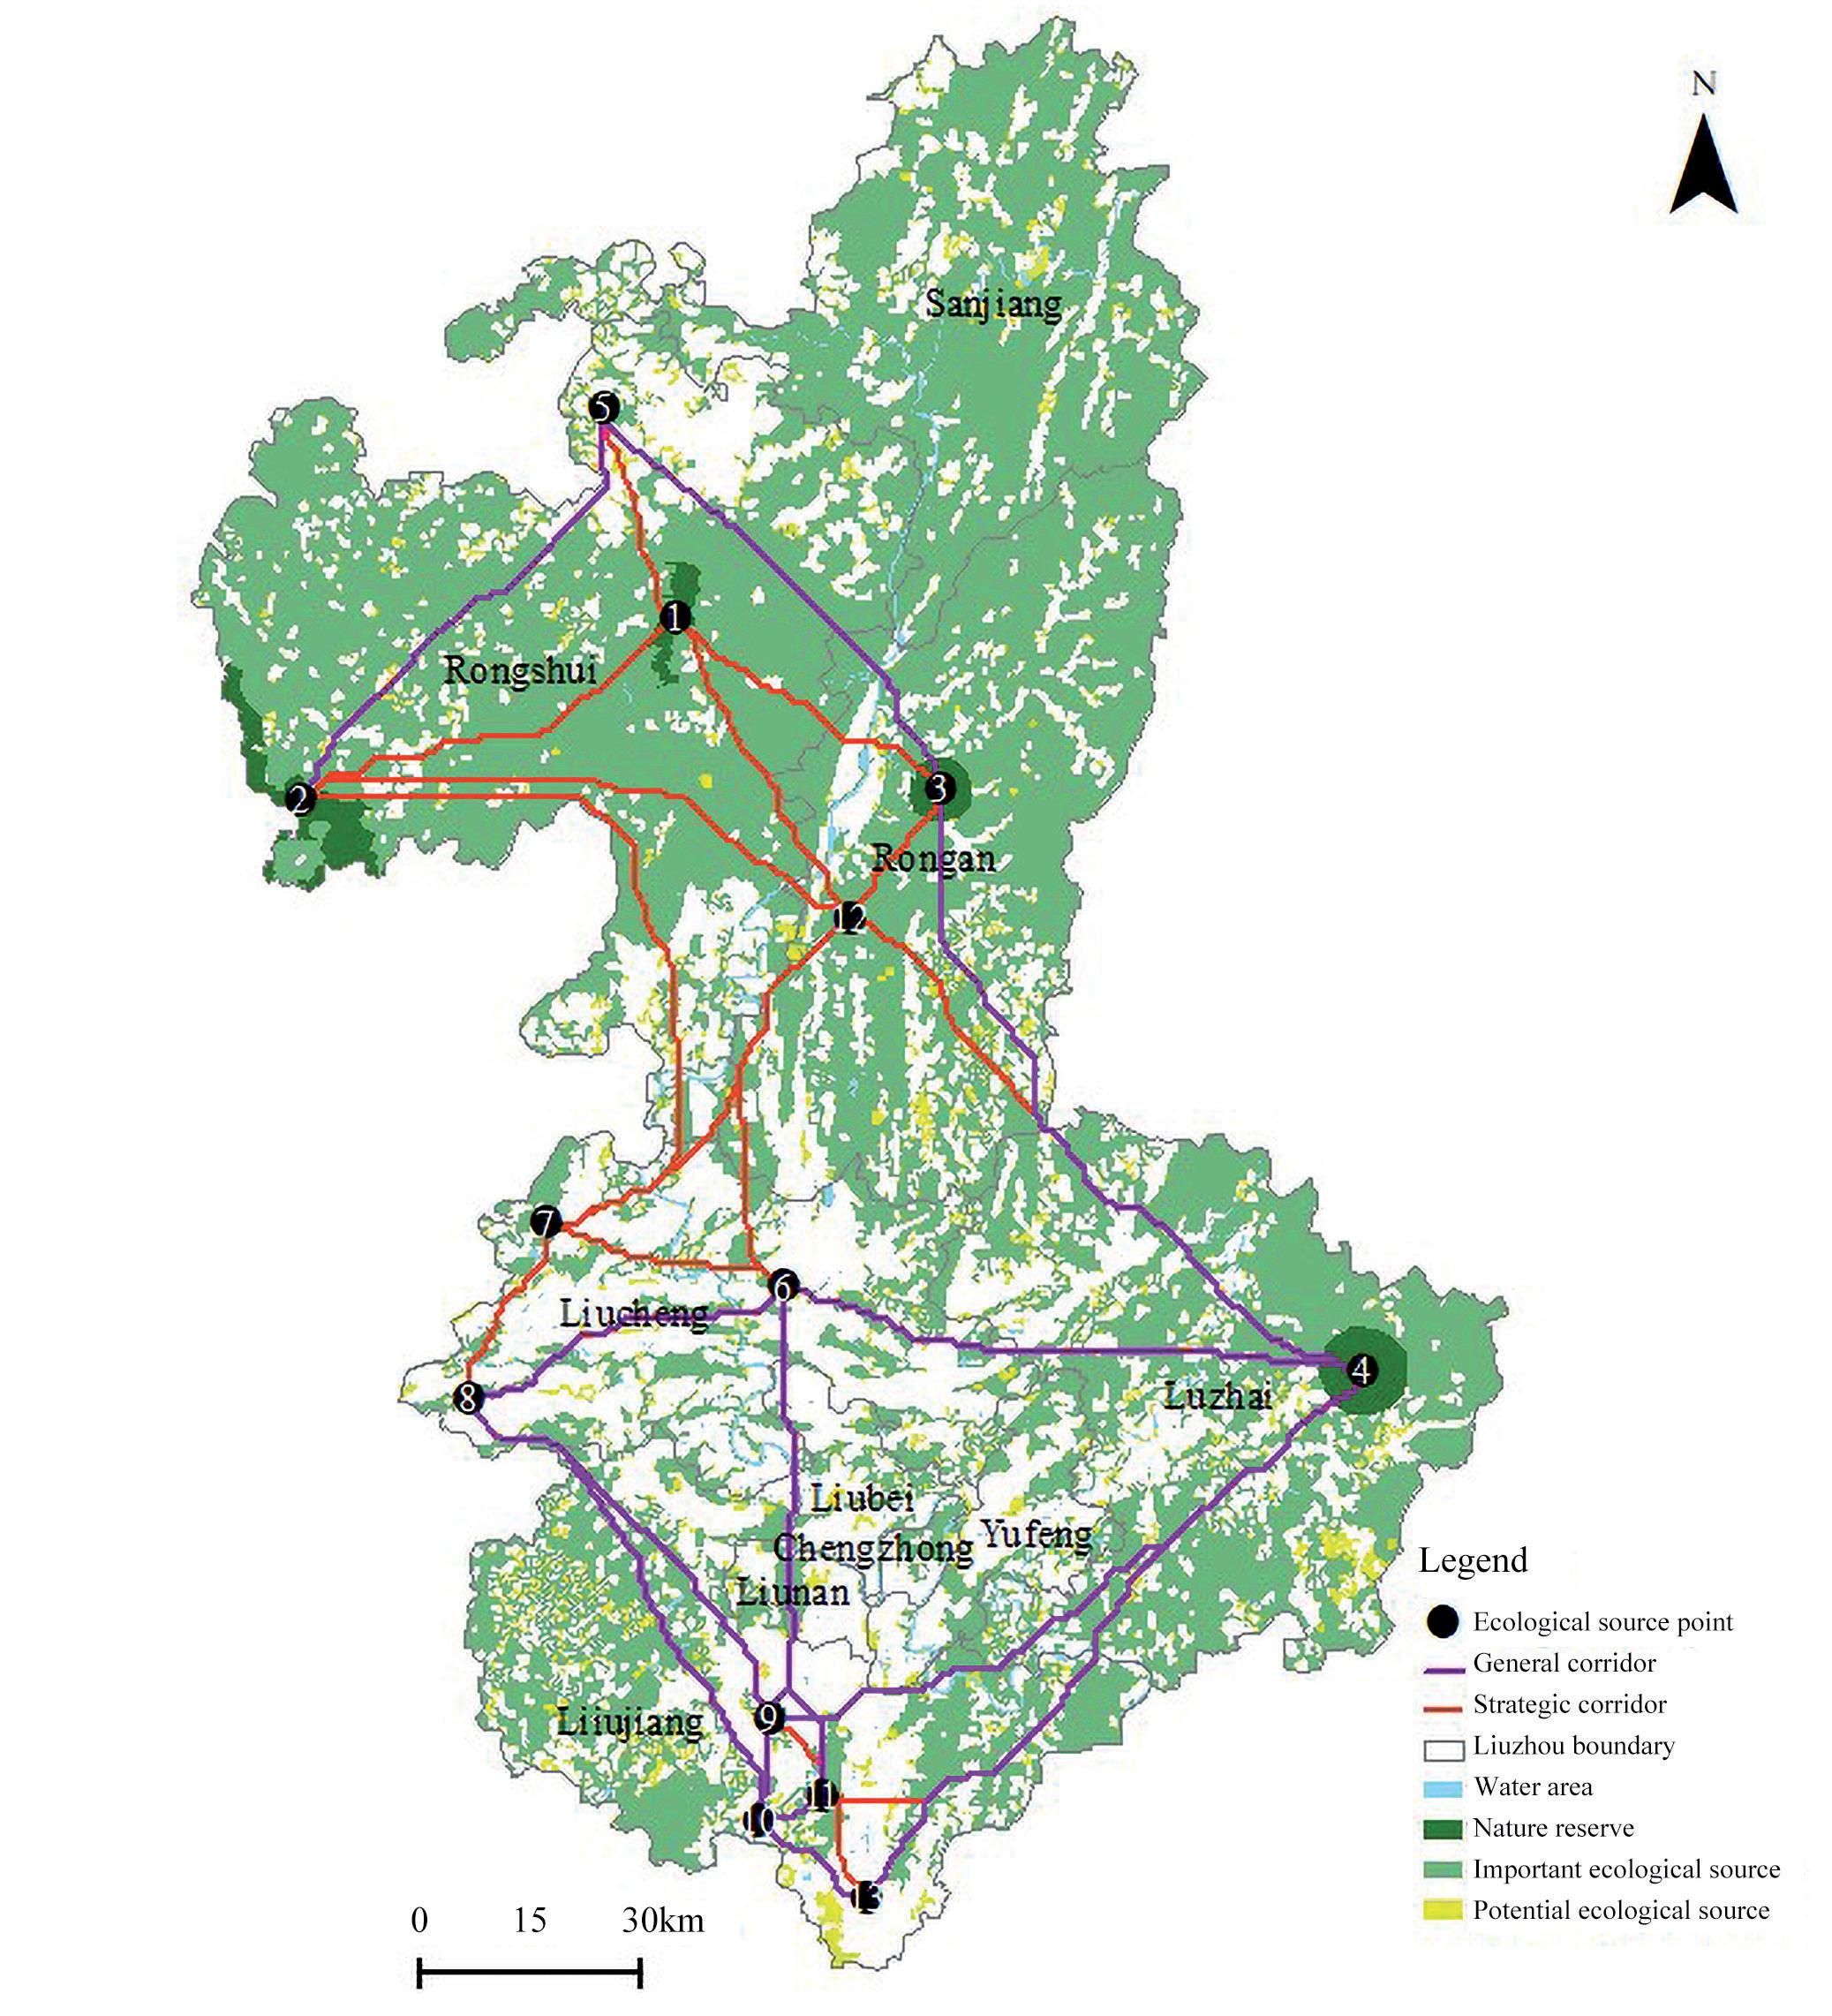
Table 9.
Identification of ecological pinch points in Liuzhou.
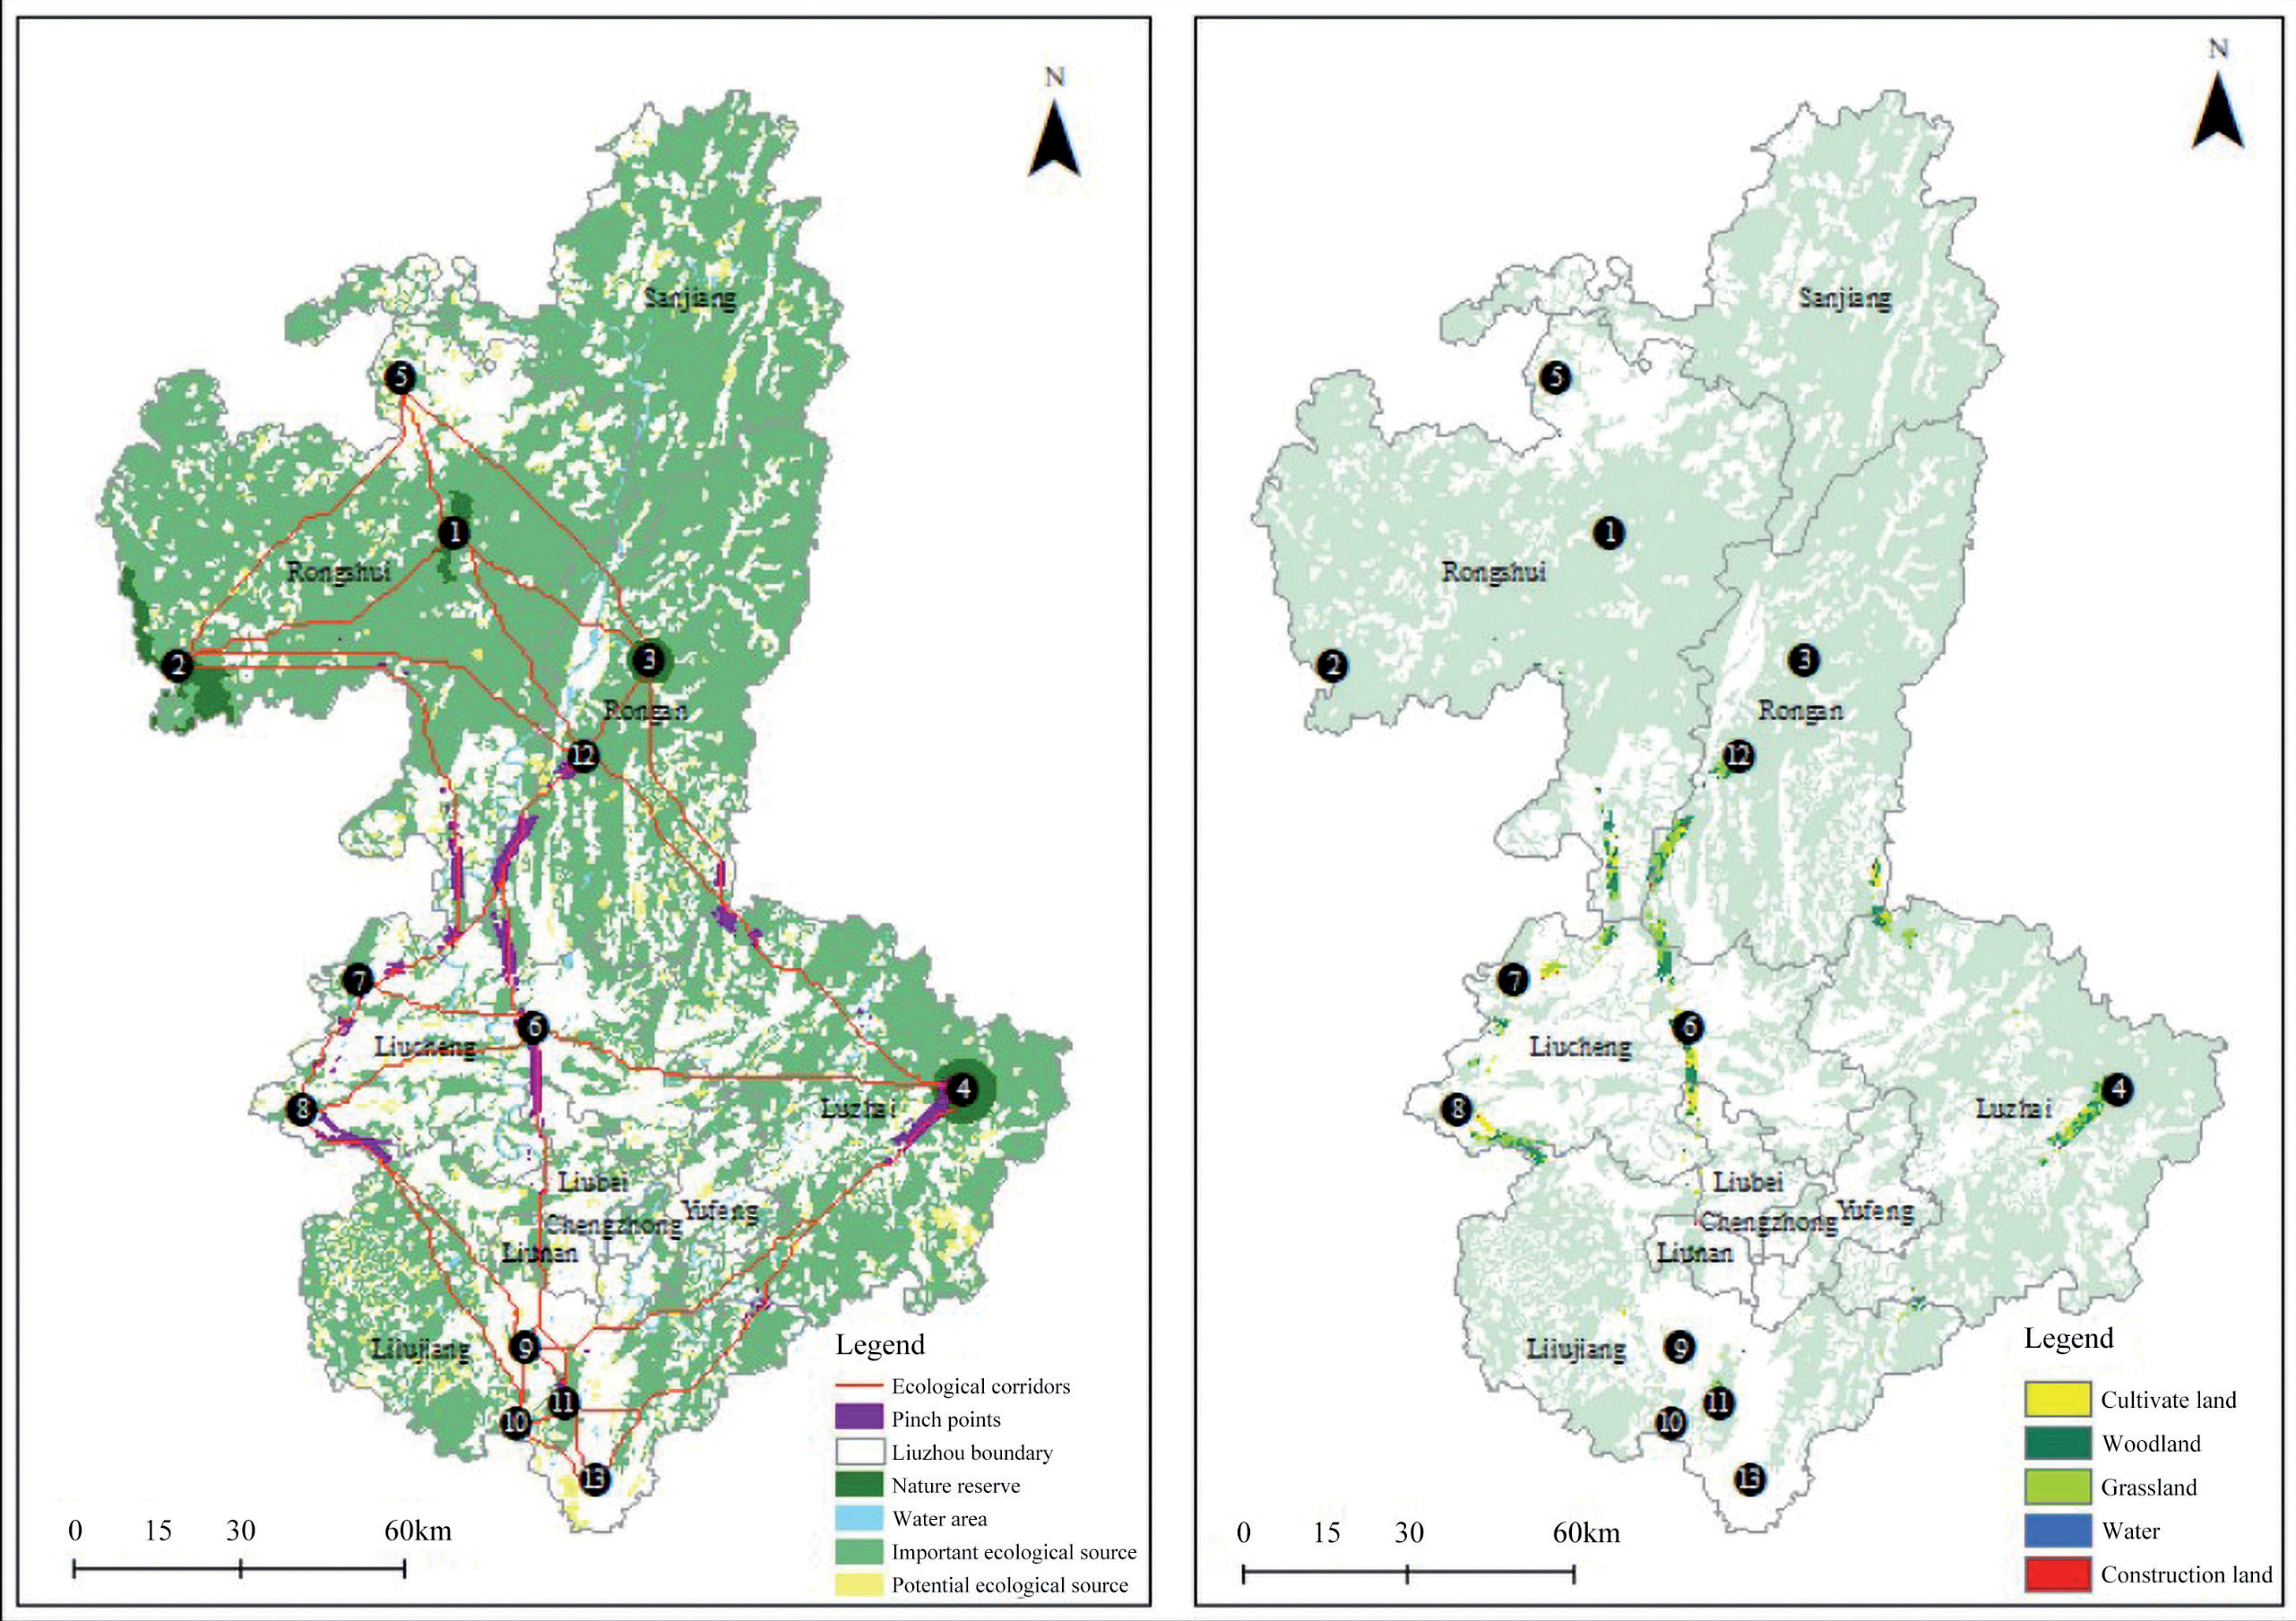
Table 10.
Location of ecological barriers in Liuzhou.
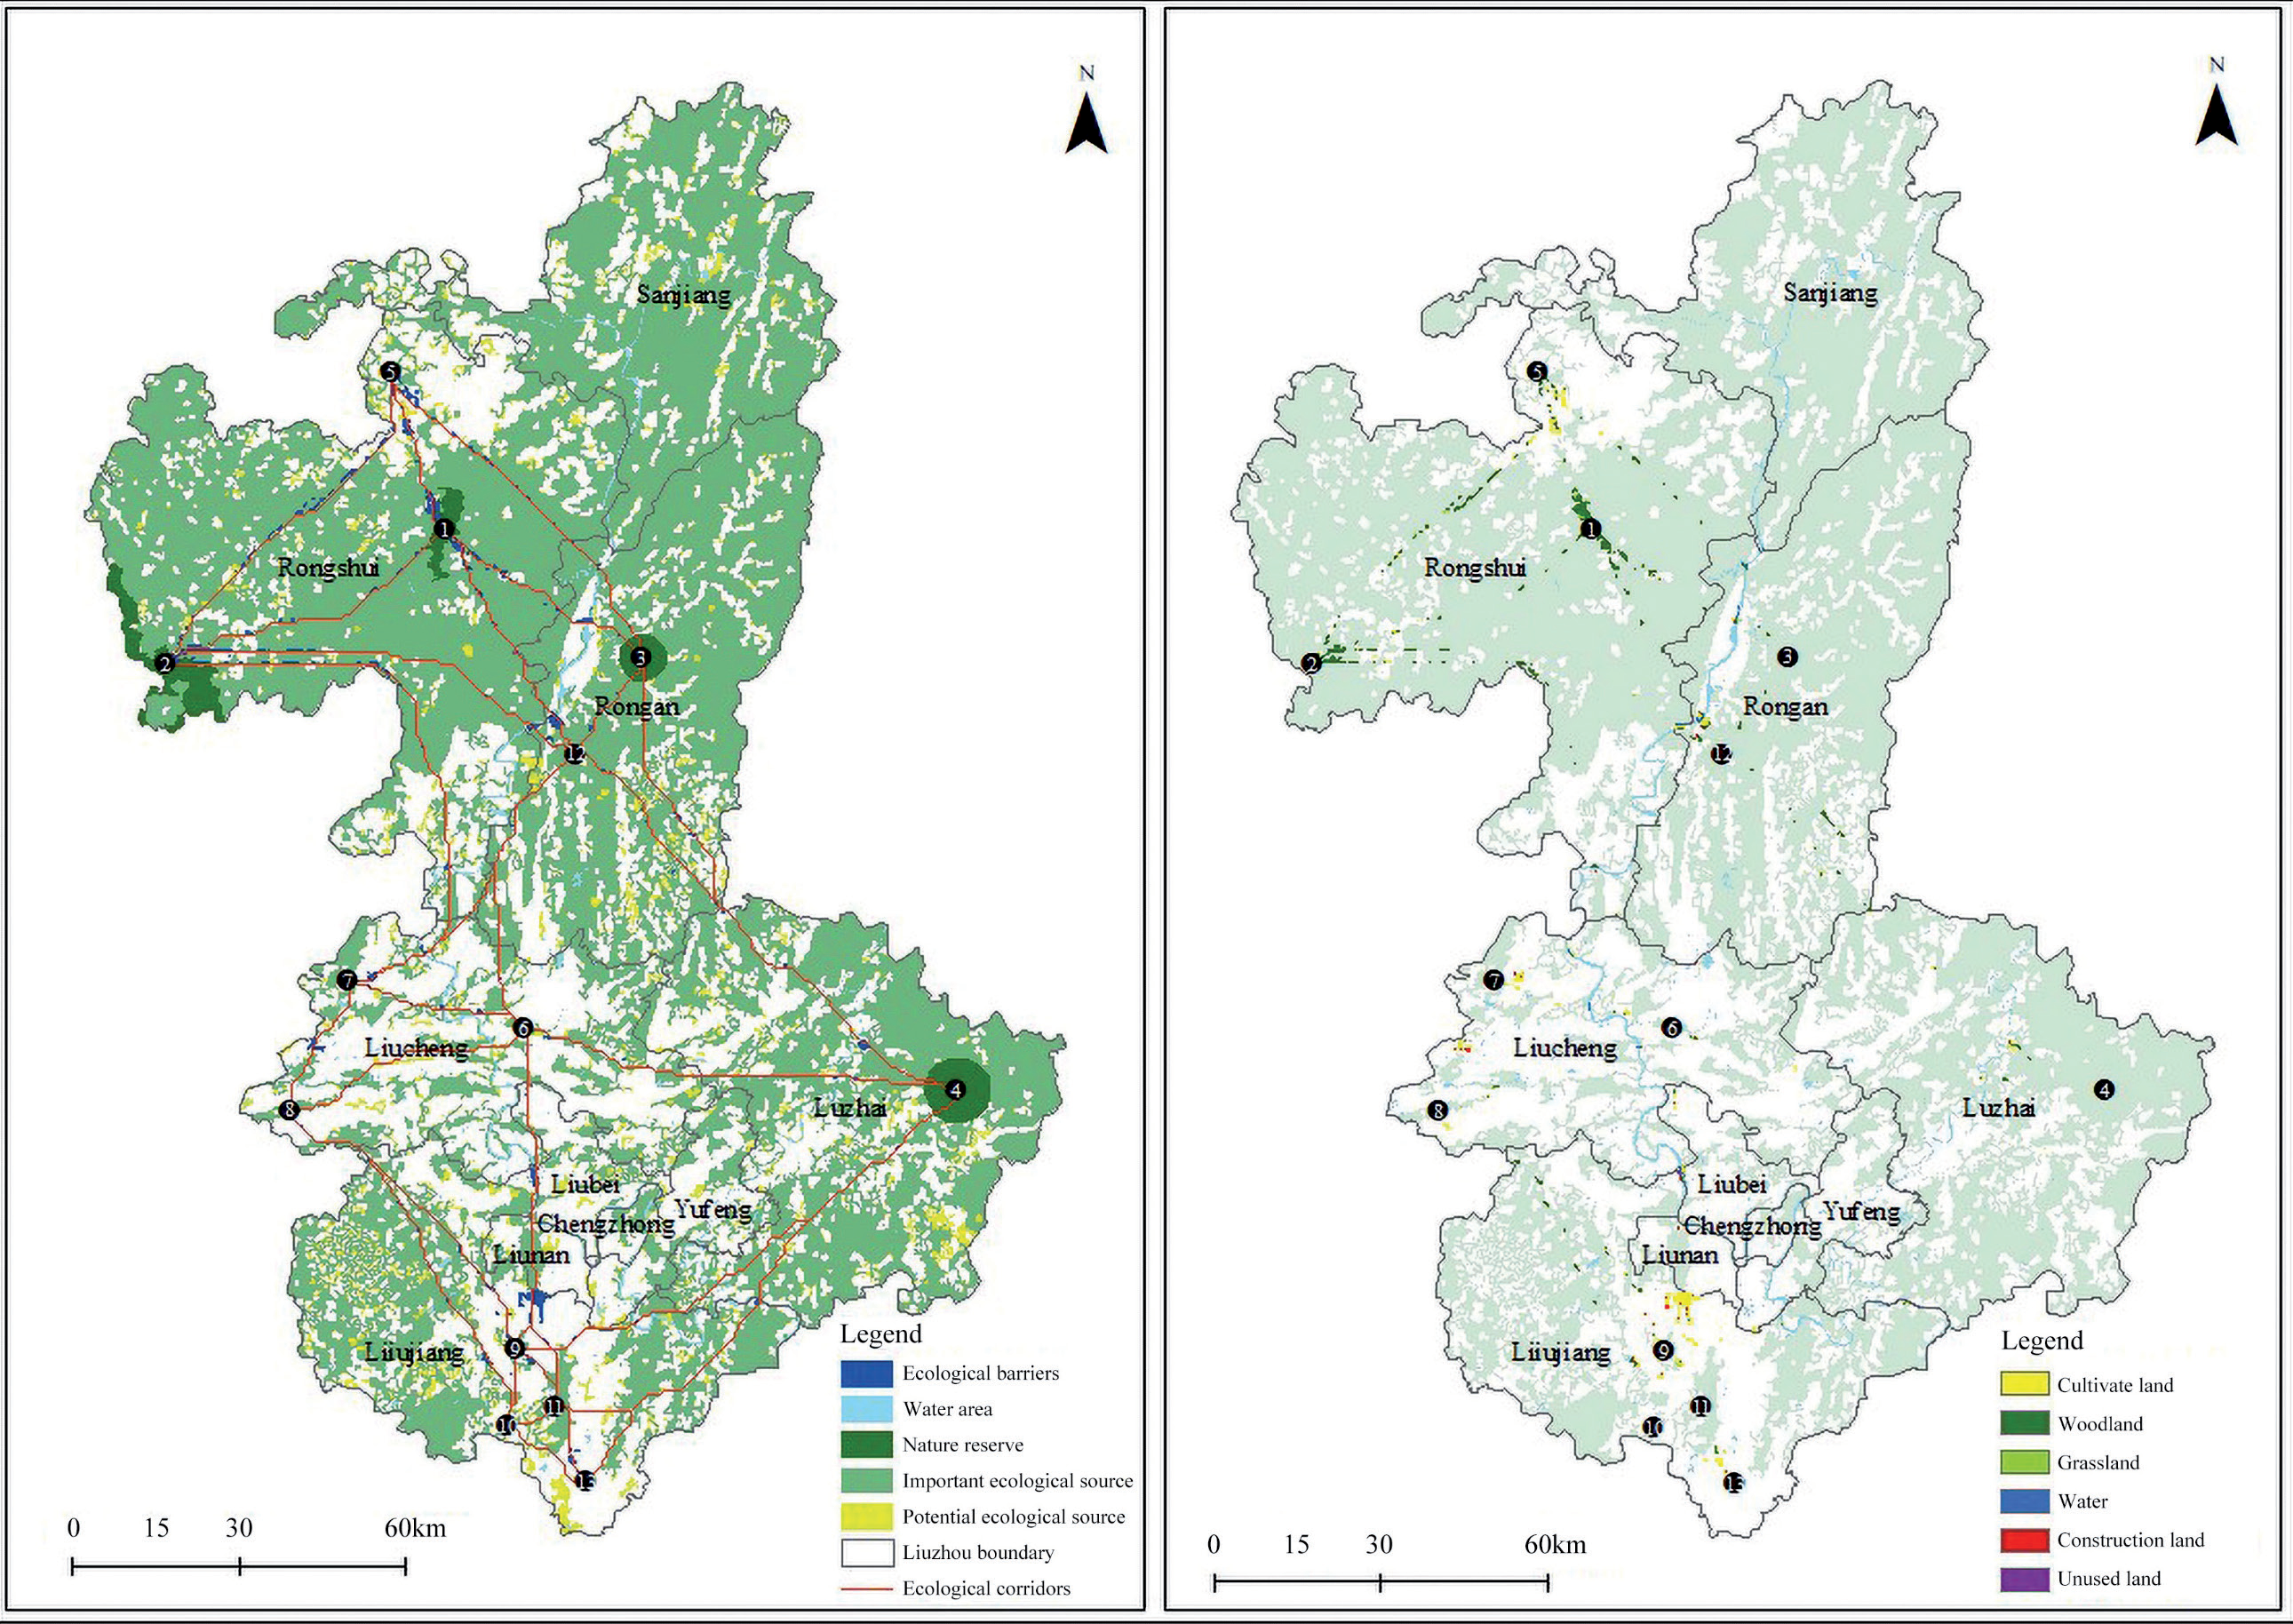
Ecological Breakpoints
Overlay analysis of the ecological corridors and transportation networks revealed 129 ecological breakpoints (Fig. 10), with 91 railway intersections and 38 highway intersections being distributed across various ecological sources. These ecological breakpoints substantially compromised the integrity of ecological networks. Therefore, prioritizing the construction and maintenance of infrastructure, such as natural protection belts and wildlife passages along transportation routes, is crucial for maintaining ecosystem connectivity and stability.
Policy Suggestions
Strengthening Ecological Sources Protection
The spatial analysis revealed a substantial overlap (approximately 82.92%) between identified ecological sources and existing nature reserves, including the Jiuwan Mountain Nature Reserve and Bajiang Scenic Area. To enhance biodiversity conservation, we recommend: (1) expansion of reserve boundaries through a connectivity-based approach, particularly in Rongshui and Rong’an counties where ecological connectivity indices exceed regional averages; and (2) establishment of new protected areas in high-connectivity zones, ensuring effective linkage between existing ecological sources to mitigate fragmentation and optimize landscape connectivity.
To prevent ecological source fragmentation, particularly in the northern and eastern regions where ecological source density reaches 0.85/km2, stringent land-use regulations should be implemented. These regulations should: (1) prohibit conversion of ecological lands (woodlands, grasslands) to construction or agricultural use; and (2) establish “Ecological Conservation Redlines” with strict development controls, particularly in areas with connectivity indices above 0.2.
For degraded ecological sources, we propose targeted restoration initiatives focusing on: (1) reforestation and afforestation programs prioritizing native species;
(2) grassland rehabilitation; and (3) implementation of ecosystem function-based management strategies. In northern Liuzhou, where ecological source integrity remains relatively high, forest management practices should be optimized to enhance biodiversity and improve ecosystem resilience metrics.
Enhancing Ecological Corridor Connectivity
The 15 identified strategic ecological corridors, particularly those connecting key nodes such as the Bajiang Scenic Area and Hongta Valley Forest Park, require immediate protection measures. Recommended policies include: (1) implementation of corridor-specific zoning regulations with construction restrictions within 500m buffers; and (2) establishment of multi-tiered buffer zones to minimize anthropogenic impacts, particularly in urban-adjacent areas.
To reconcile urban development with ecological conservation, we recommend: (1) integration of green infrastructure networks in urban planning, particularly in central Liuzhou; (2) development of interconnected green belts and urban parks with minimum width; and (3) implementation of wildlife crossing structures at critical connectivity nodes.
For degraded corridors, restoration should focus on: (1) vegetation rehabilitation using native species; (2) construction of wildlife passages meeting minimum dimensional requirements; and (3) removal or modification of linear infrastructure barriers. In southwestern Liuzhou, where transportation infrastructure has caused 32.7% corridor fragmentation, we recommend strategic placement of wildlife overpasses and underpasses at 2 km intervals along critical connectivity routes.
Optimizing Ecological Restoration in Key Areas
Enhancing the effectiveness of ecological restoration practices requires the development of precise and practical strategies to protect and restore key areas, including ecological pinch points, barriers, and breakpoints. These three types of areas are key to ensuring the optimal circulation of biological flow in the system. By integrating and restoring these three types of areas, the integrity of Liuzhou’s ESPs can be improved significantly. This process will stabilize the city’s ecological matrix and spaces, leading to enhanced provision of ecosystem services. Such improvements are crucial for supporting biodiversity, improving environmental quality, and ensuring sustainable urban development. The key areas identified were compared to the Liuzhou Territorial Spatial Master Plan (2021-2035), the Liuzhou Comprehensive Territorial Renovation and Ecological Restoration Plan (2022-2035), and the Major Ecological Protection and Restoration Projects for the Southern Hilly and Mountainous Regions (2021- 2035), alongside field investigations. We showed a high level of consistency with the actual conditions, which underscored their critical role in guiding ecological restoration efforts. Therefore, considering the unique characteristics and existing land use conditions of various key areas designated for ecological conservation and restoration within Liuzhou’s territorial space, this study proposes a series of targeted restoration strategies specifically designed for each type of land use (Table 11). These strategies aim to address the specific challenges and opportunities presented by each area, ensuring effective and sustainable ecological restoration.
Discussion
Impact of Land Use Change on ESPs
Industrialization and urbanization are double-edged swords. They foster socio-economic development, enhance human welfare, and improve the quality of life. Conversely, the two factors disrupt ecosystem structure and function and threaten regional ES [51]. To address these challenges, several cities are actively engaging in systematic territorial and spatial ecological restoration. This includes the coordinated management of mountains, rivers, forests, fields, lakes, and grasslands, as well as promoting the construction and regulation of ecological spaces. Such efforts aim to minimize ecological pressure, improve environmental quality, enhance resident welfare, and sustain socioeconomic development. Establishing ESPs is a strategic approach for optimizing the management of ecological spaces, offering a systematic and holistic framework to uphold ecosystem integrity, functional stability, and connectivity [52]. Territorial spatial ecological restoration and integrated management are dynamic and ongoing processes. Urban land use is constantly evolving, and current studies often overlook the corresponding changes in ecosystem structure and function resulting from land use transformation [10, 53, 54].
Table 11.
Conservation and restoration strategies for key areas in Liuzhou.
During urbanization, human activities constantly disrupt ecosystems, resulting in the gradual accumulation of environmental challenges. The core issue of ES is the protection of ecological spaces, with land use serving as the foundation. This study developed ESPs through simulations of land use dynamics. A comparison of the important ecological sources in Liuzhou over the four years revealed a decline in both the number and area of ecological sources, indicating the impact of land use changes. Notably, the important ecological sources in Danian Township, Rongshui, including the Jiuwan Mountain Nature Reserve and the contiguous peak, are predicted to vanish by 2030. Furthermore, the number of ecological corridors and nodes will have decreased, thereby compromising the resilience and stability of ESPs. Ecological sources, which are essential for building ESPs, are considered crucial areas for safeguarding regional ES and its functions in the future. This study identified important ecological sources over four years, including those that vanished, and used the data to construct ESPs. This approach aimed to identify key areas at risk of land use changes, offering feedback for land use planning and ecological protection efforts. Consequently, the findings can be used to effectively safeguard ecological spaces and mitigate future environmental changes.
Impact of Different Thresholds on ESPs
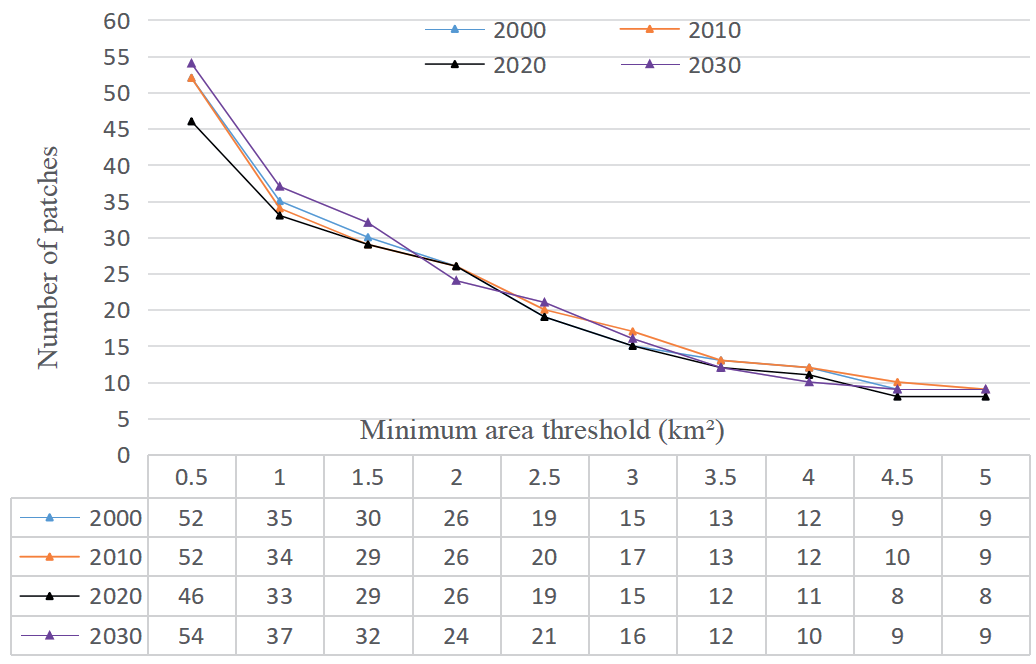
The ecological restoration of territorial spaces demands substantial human and material resources and requires scientific planning of restoration goals and processes. Therefore, a quantitative analysis of the threshold variations in ecological sources and corridors during the construction of regional ESPs is crucial. This approach provides robust support for regional ecological management. The number of ecological sources is directly affected by the minimum area criterion [54]. As depicted in Fig. 11, increasing the minimum area required for ecological source patches considerably decreased their quantities. However, when the threshold reached 1.5 km2, the rate of decrease slowed and stabilized at a threshold of 2 km2. Consequently, 2 km2 was selected as the minimum area threshold for ecological source patches. This criterion identified 26 potential ecological sources in 2000, 2010, and 2020, and 24 sources in 2030, which were predominantly located in the hilly and mountainous regions of eastern, western, and northern Liuzhou. Although smaller and more dispersed patches were excluded, the total area of the ecological sources remained at approximately 62%, indicating that the overall configuration of the ecological sources was largely unaffected by this threshold.
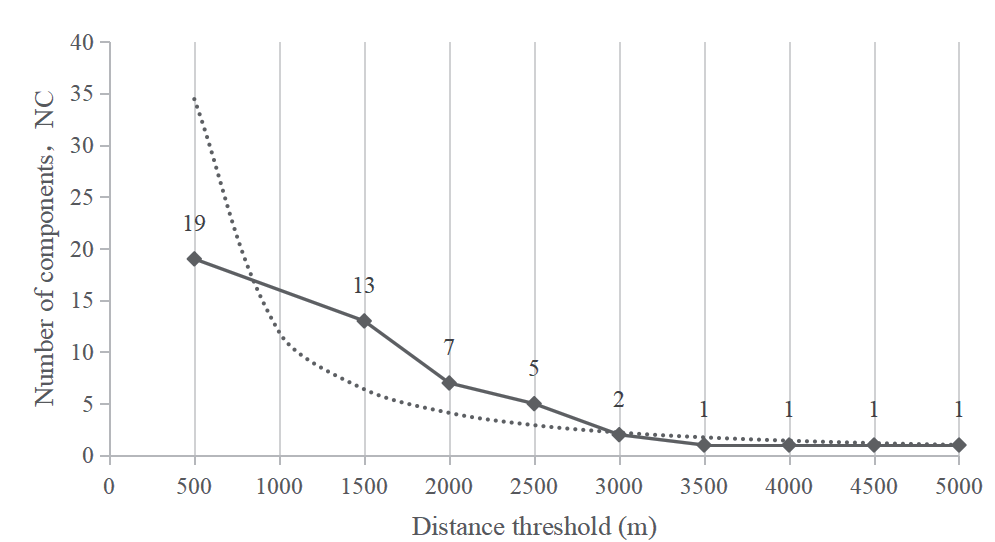
Establishing a distance threshold for connecting landscape patches is crucial for computing the landscape connectivity indices. The ecological source patches were considered disconnected when patches were separated by distances greater than the minimum threshold, whereas distances less than or equal to the minimum threshold indicated connectivity. Patch connectivity closely correlates with biological migration patterns. Therefore, the selection of a distance threshold should account for migration characteristics to enhance the relevance of research findings. Based on the literature and surveys of wildlife activity ranges in Liuzhou (such as the range of Cabot’s Tragopan), Conefor 2.6 was used to compute component scores incrementally at thresholds ranging from 500 to 5000 m in 500-m increments. As shown in Fig. 12, the NC value gradually decreased with an increase in the threshold distance. For instance, the NC value at a threshold of 500 m was 19, indicating largely independent patches and poor landscape connectivity. Conversely, the NC value at a threshold of 3000 m was 2, stabilizing with distance according to the power function analysis, suggesting predominantly connected patches. Therefore, a connectivity probability of 0.5 was set as the threshold, and landscape connectivity was assessed for potential ecological sources across four time periods, with the patches being sorted based on dPC values. Patches with dPC>0.1 were considered important ecological sources.
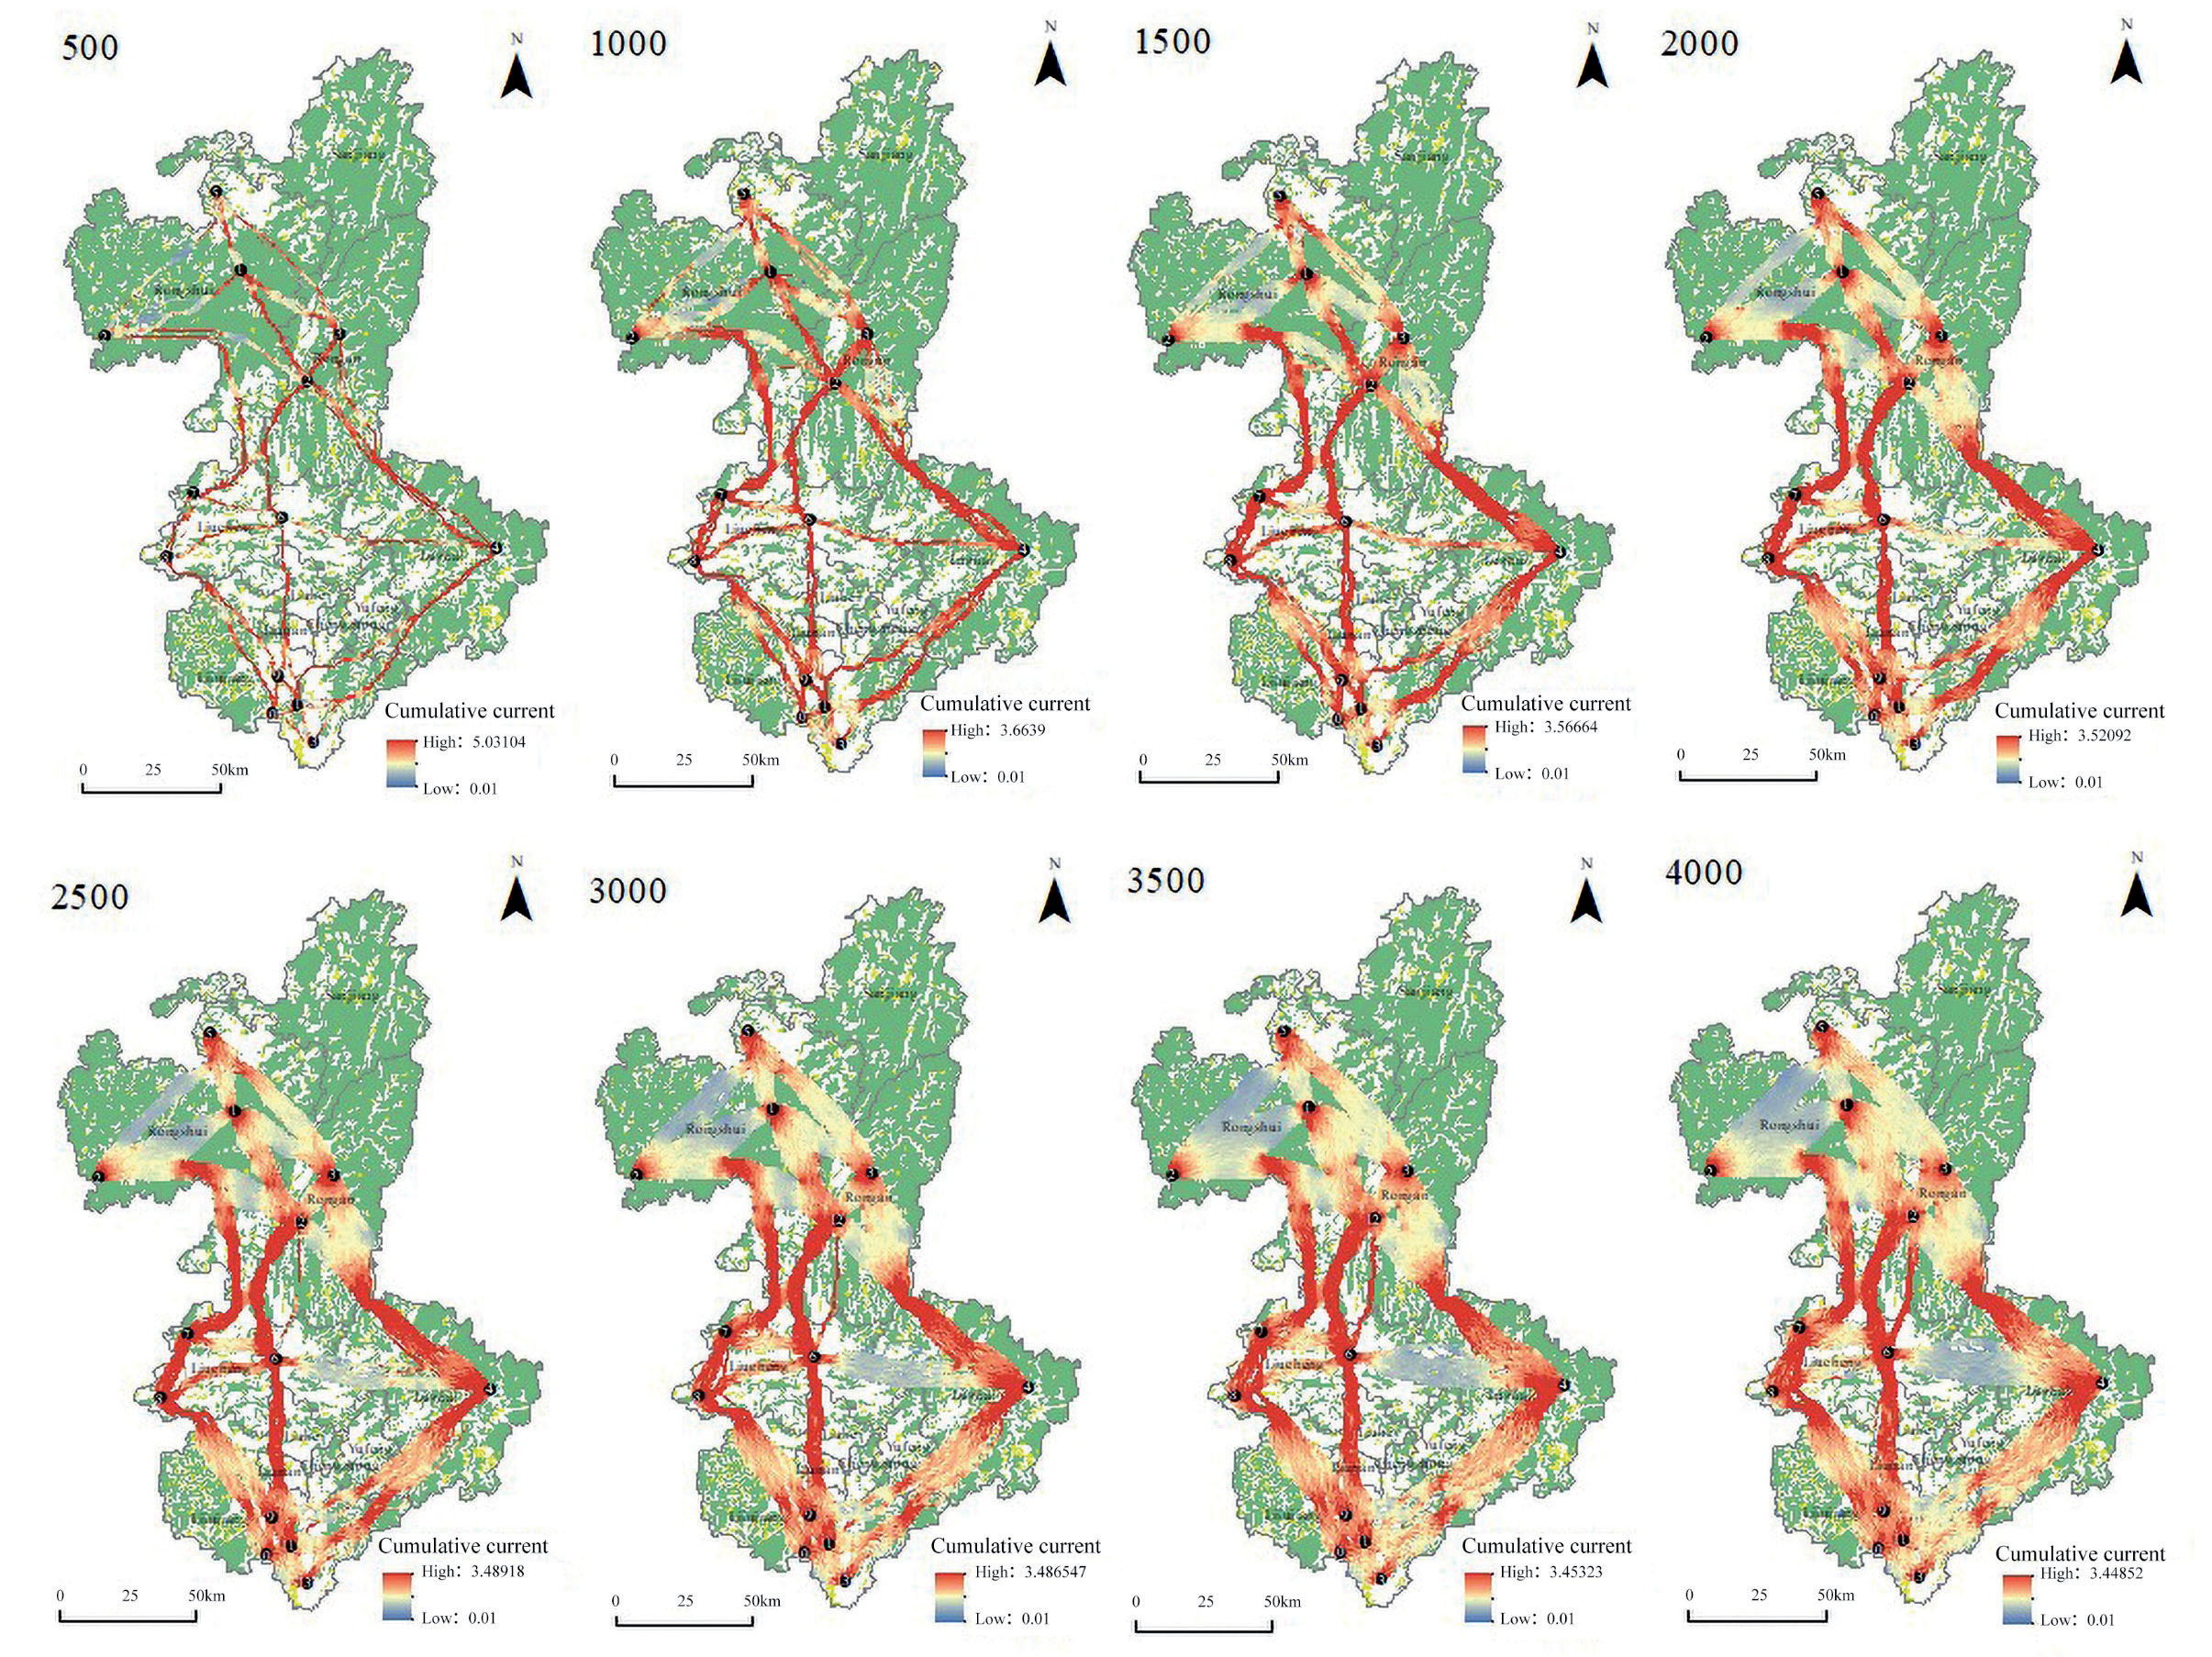
According to previous studies regarding ecological restoration and ESPs, the width of ecological corridors is pivotal for enhancing habitat suitability and facilitating species movement. Ecological corridors have often been considered optimal pathways for species migration or dispersal in previous studies, as identified using the MCR model. However, species may not always select optimal pathways based solely on landscape features. Therefore, this study employed the circuit theory based on the random walk hypothesis to determine the optimal ecological corridors, their widths, and critical areas. Defining the spatial extent of the ecological corridors involved comparing the threshold settings used in similar studies. Previous studies have typically set thresholds based on expert judgment; Peng et al. (2018) proposed that ecological conservation efforts should cover only 50% (4000 cumulative resistance thresholds) of the management area[10]. In contrast, Gao et al. (2022) considered land resource and ecological conservation goals and suggested that a 5% cumulative resistance threshold (7000 cumulative resistance threshold) was optimal for defining ecological corridors [55]. The present study employed cumulative current values at specific thresholds to identify the scope of ecological corridors. The corridors were defined within a range of 500 to 4000 based on increments of 500, which was used to calculate and analyze the proportion of the corridor area relative to the total study area (Table 12). As the threshold increased, wider corridors provided more paths for circuit connections, causing current splitting. Although the cumulative current value decreased, the maximum cumulative current at the ecological pinch points gradually decreased. However, ecological pinch point locations remained largely unchanged (Fig. 13). This demonstrates that the designation of key protected areas effectively ensures regional ES. Expanding corridor areas promotes species migration by increasing migration pathways; however, it is associated with high construction and maintenance costs. Additionally, expanding the corridor area may compete with development land, potentially affecting local economic growth.
To enhance the area under protected ecological zones and minimize the loss of ecosystem services and biodiversity, a threshold of 1500 is recommended for determining the spatial locations of ecological pinch points based on the Convention on Biological Diversity and recommendations from the International Union for Conservation of Nature advocating for the protection of at least 30% of the land [56].
Limitations and Future Research Directions
Currently, the identification of ecological corridors typically employs the MCR model, which uses the cost path tool in ArcGIS 10.8 to determine the minimum cost distance between ecological sources. However, this method overlooks the random movement behavior of organisms and does not clearly define the precise scope and key nodes of ecological corridors. Circuit theory leverages the random-walk characteristics of electrons, accurately simulates species migration patterns, identifies critical areas for landscape ecological restoration, and addresses the limitations of single-point, single-element, and single-process restoration methods. This approach mitigates the spatial fragmentation of ecological restoration activities and offers valuable insights into systematic and targeted landscape restoration. This study used the circuit theory to identify ecological corridors, pinch points, and barriers and recommend targeted restoration measures.
However, this study has several limitations. First, although the PLUS model simulated land use changes under multiple driving factors, it did not account for the impact of macro-level policy factors. Therefore, future studies should develop a spatial coupling model that incorporates the system dynamics model and additional driving factors to enhance the accuracy of land use simulations. Second, we used the landscape group number NC mutation point method to determine the distance threshold for connectivity when identifying ecological sources by evaluating landscape connectivity, which requires extensive simulations. This approach may overlook patches with high functional connectivity. Future studies should incorporate ecosystem service functions to assess the quality of ecological networks comprehensively. Third, despite standardizing the data to the same resolution, variations in the original data sources may have introduced deviations during the importation process. Thus, ensuring consistency in data sources is crucial. In addition, this study relied primarily on quantitative analysis; therefore, conclusions should be continuously refined based on real-world applications to enhance guidance for ecological restoration practices in the territorial space of Liuzhou.
Conclusions
Based on the findings of this study, the following conclusions can be drawn:
(1) The land use pattern in Liuzhou has changed significantly over the past 20 years due to industrialization and urbanization, leading to the expansion of construction land. Based on the PLUS model simulations under an ecological priority scenario, land use in Liuzhou is projected to remain unchanged until 2030. This stability includes decreasing cropland, increasing woodland, a slight increase in water bodies, and a slight decline in both grassland and unused land. However, construction land is projected to expand by an additional 59.51 km2.
(2) Thirteen key ecological sources, which covered a total area of 13,994.62 km2, accounting for 60.29% of the study area, were identified by integrating MSPA with landscape connectivity evaluation. Ecological sources are predominantly situated in the northern and eastern regions of Liuzhou, with fewer sources being located in the central and southern regions. The predominant ecological sources are woodlands and grasslands.
(3) A total of 29 ecological corridors with a combined length of 1740.55 km were identified using the circuit theory and a gravity model. Among them, 15 ecological corridors with a total length of 828.11 km, which accounted for approximately 47.58% of the total corridor length, were identified as key corridors. These corridors are primarily located in Rongshui, Rong’an, Liucheng, and the surrounding areas. The ecological corridors extended from the southwest to the northwest, which links several crucial scenic areas, thereby enhancing ecosystem connectivity.
(4) Key areas for territorial ecological conservation and restoration in Liuzhou include ecological pinch points, barriers, and breakpoints. A total of 112 ecological pinch points were identified, with the majority being located in the central and north-central regions. Furthermore, 168 ecological barriers, which are primarily located at the edges of ecological sources or within corridors, and 129 ecological breakpoints, including 91 railway and 38 highway intersections, were identified. Owing to the variations in geographical features and land use, the recommended restoration strategies are primarily natural restoration with supplementary artificial restoration for pinch points, a balanced approach of both natural and artificial restoration for ecological barriers, and measures to mitigate or compensate for fragmentation effects at ecological breakpoints.

