

Introduction
In recent years, the global landscape has undergone remarkable transformations in terms of land use and land cover changes (LUCC), largely due to the interplay between climate change and human interventions [1]. These shifts have significantly influenced the ecosystem service value (ESV) of numerous regions, with the Qinghai Lake Basin, an integral part of the Qinghai‒ Tibet Plateau, being particularly responsive to such changes [2]. As the largest inland saltwater lake in China, Qinghai Lake serves as a biodiversity hotspot and a crucial intersection for multiple ecosystem services (ESs), including climate regulation, water resource management, and grassland livestock sustenance. Over the past two decades, the basin’s ecosystem has experienced varying degrees of disruption, with land use changes being a significant contributing factor [3]. These alterations have had profound implications for biodiversity, soil retention, water conservation, and ESV, posing challenges to the overall health and sustainable development of the ecosystem [4].
Earlier studies revealed that the basin’s land use pattern was primarily composed of grassland, desert, and the lake itself, with limited allocation for arable land and construction purposes [5]. The enforcement of the “Qinghai Lake Basin Ecological and Environmental Protection Regulations” in 2003, along with broader national ecological protection policies, has led to substantial shifts in land use patterns [6]. Vegetation restoration projects, the conversion of farmland into forests and grasslands, and the expansion of tourism and infrastructure have notably reshaped land use types and their distributions [7]. While these changes have increased the basin’s ESV, such as by improving biodiversity and water conservation, the recent surge in tourism development and urbanization has introduced new pressures, resulting in complex and dynamic changes in ESV [8]. Previous studies have focused primarily on analyzing the processes and trends of land use change, while comprehensive assessments of their impacts on ESV remain scarce. Although some studies have explored the effects of key land use types on ESs, few systematic studies have investigated the dynamic impact of land use change on overall ESV across different timeframes. Furthermore, the intricate mechanisms underlying the interaction between land use change and ESs, particularly with respect to trade-offs and synergies among various land use types, are not yet fully understood.
The driving forces behind land use change in the Qinghai Lake Basin encompass both natural and human dimensions. Natural factors that affect vegetation growth, soil moisture, and lake water levels include changes in precipitation and temperature due to climate change [9]. Human factors include population growth, policy directives, economic progress, and technological advancements. Notably, tourism development has had a profound influence on a region’s ESV, promoting regional economic growth and investment in ecological restoration projects while intensifying competition for land use and exerting pressure on sensitive ecosystems [10].
Contemporary research trends emphasize comprehensive, multiscale evaluations utilizing remote sensing, GIS technology, and ESV assessment models to discern changes in ESs under various land use scenarios. By integrating considerations of climate change, socioeconomic development, and policy factors, dynamic simulation models of land use and ESV can be developed to predict future shifts and their implications for ESs [11]. These models provide scientific support for land use planning and the formulation of ecological protection policies. However, studying the impact of land use change on ESV presents challenges, such as the uncertainty surrounding the assessment of ESV for different land use types, especially in highland ecosystems, and the time lag between land use change impacts and their manifestation in ESs [12]. Additionally, the influence of socioeconomic factors on land use change varies across regions, necessitating the incorporation of these complex driving mechanisms into the research framework [13].
To address these research gaps, this study aims to conduct a comprehensive evaluation of the dynamic impact of land use change on ESV in the Qinghai Lake Basin between 2003 and 2023 via ESV assessment models [14]. By examining the trade-offs in ESVs across different land use types, this study seeks to identify optimal land use configurations, provide scientific support for regional sustainable development, and anticipate potential future shifts in land use and ESV. This endeavor will offer forward-thinking decision-making guidance for ecosystem protection and management.
Materials and Methods
Study Area
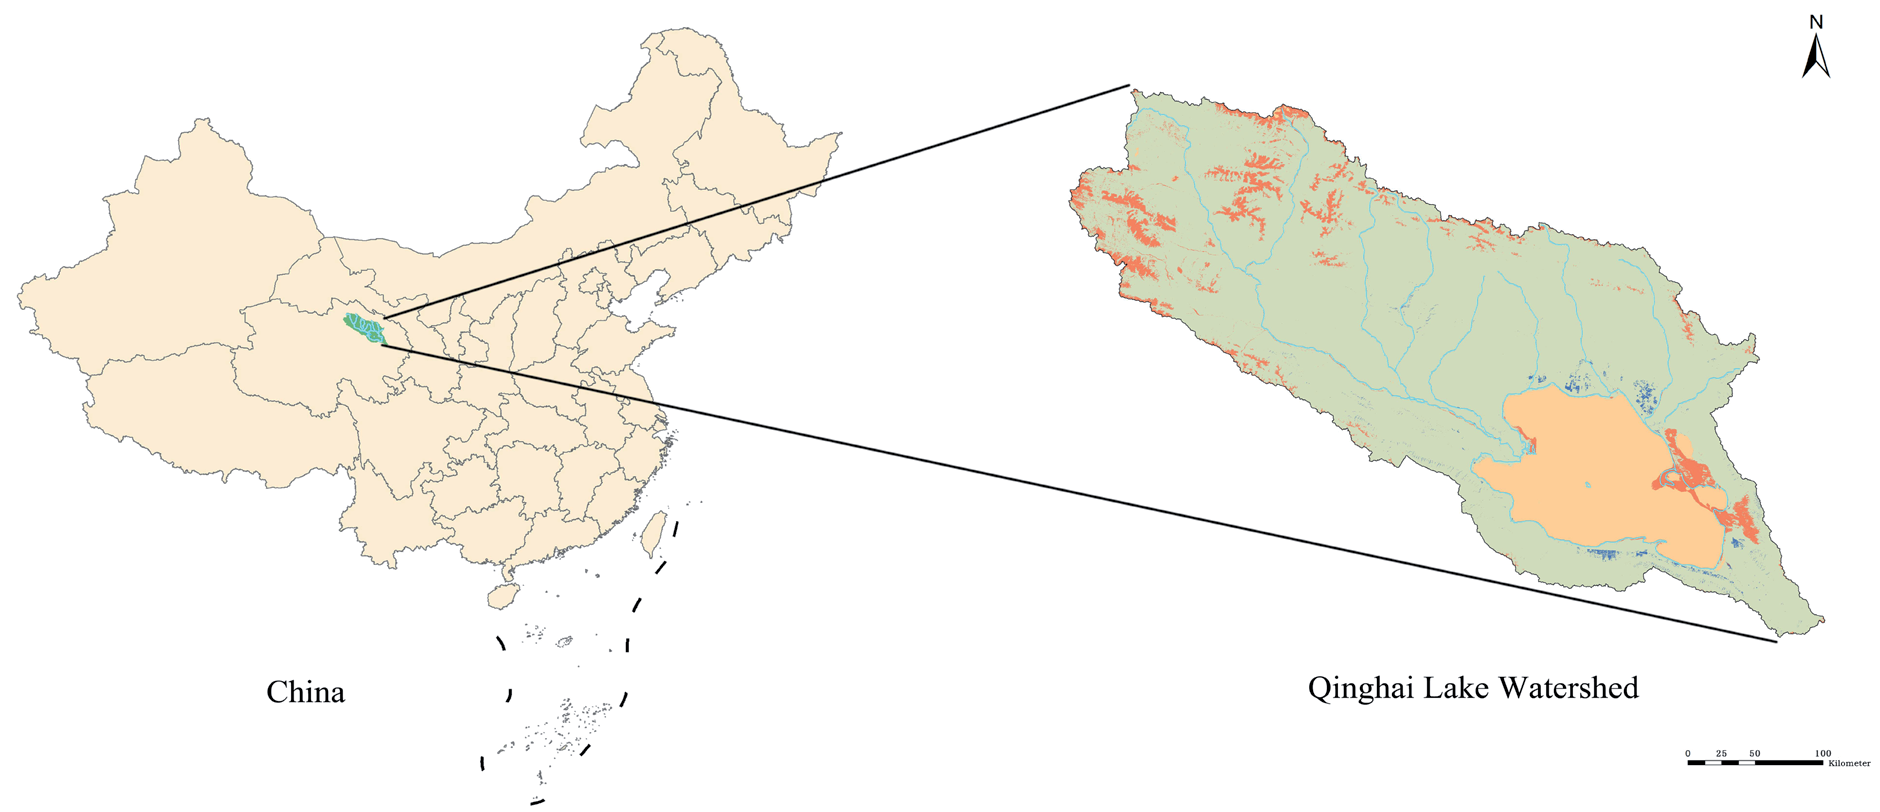
The Qinghai Lake Basin, located in the northeastern Qinghai‒Tibet Plateau, serves as a vital ecological barrier and climate modulator for China. Its diverse terrain, including mountains, hills, and plains, supports various ecosystems, including lakes, wetlands, grasslands, sandy areas, and deserts (Fig. 1). These ecosystems are crucial for regional climate regulation, biodiversity conservation, water resource maintenance, and livestock forage [15]. The basin hosts several rare and endangered species, emphasizing the importance of ecological stability and diversity in preserving high-altitude biodiversity. The basin’s climate is cold and arid, with annual temperatures averaging between -1ºC and 3ºC. The annual precipitation, primarily from June to September, ranges from 200 mm to 400 mm [16]. The lake’s water supply mainly comes from snowmelt, groundwater, and rainfall, with snowmelt being critical for determining the lake’s water level. However, recent climate change-induced glacier retreat and altered precipitation patterns have significantly impacted the water level and surrounding ecosystems of Qinghai Lake, highlighting the potential disruptions that land use changes may pose to the region’s ESs.
Since 2003, the land use pattern in the Qinghai Lake Basin has undergone significant transformations. The strengthening of national ecological protection policies has led to the restoration and safeguarding of natural ecological lands, such as grasslands and wetlands. Projects focused on grazing prohibition and wetland restoration have mitigated grassland degradation and desertification, enhancing biodiversity and ESVs in the region. However, the recent surge in tourism has altered land use patterns, with increased infrastructure development, urban expansion, and tourism-related facilities [17]. Some pristine grasslands and wetlands have been converted into tourist attractions, recreational amenities, and transportation networks, potentially adversely impacting the basin’s ESs. Balancing ecological protection and economic development has become a central challenge for the sustainable advancement of basins [18].
Changes in human activities are also evident in shifts in livestock production methodologies. Before 2003, traditional grazing was the primary livelihood, but overgrazing led to grassland degradation, impairing ES functions [19]. Following the enactment of the “Qinghai Lake Basin Ecological and Environmental Protection Regulations” in 2003, grassland carrying capacity assessments and grass‒livestock balance management were strengthened, promoting more sustainable pastoral livestock practices. Grazing prevention measures have alleviated pressure on grassland ecosystems [20]. Concurrently, adjustments in land use practices, such as forage crop cultivation and grassland enclosure construction, have positively influenced the ESs of Qinghai Lake, although they have introduced new challenges related to trade-offs between land use and ESs. Furthermore, socioeconomic development has led to dynamic shifts in land use patterns. Population growth, economic restructuring, and increasing demands for infrastructure development have pressured land resources. The rapid growth of tourism has driven the conversion of natural lands into construction sites for transportation, accommodation, and commercial facilities. While this transformation has contributed to local economic progress, providing employment and income sources, it has also intensified pressure on ecosystems and altered the composition of ESVs. A reduction in grassland and wetland areas may have irreversible impacts on crucial ESs, such as water conservation, climate regulation, and biodiversity protection.
Data Sources
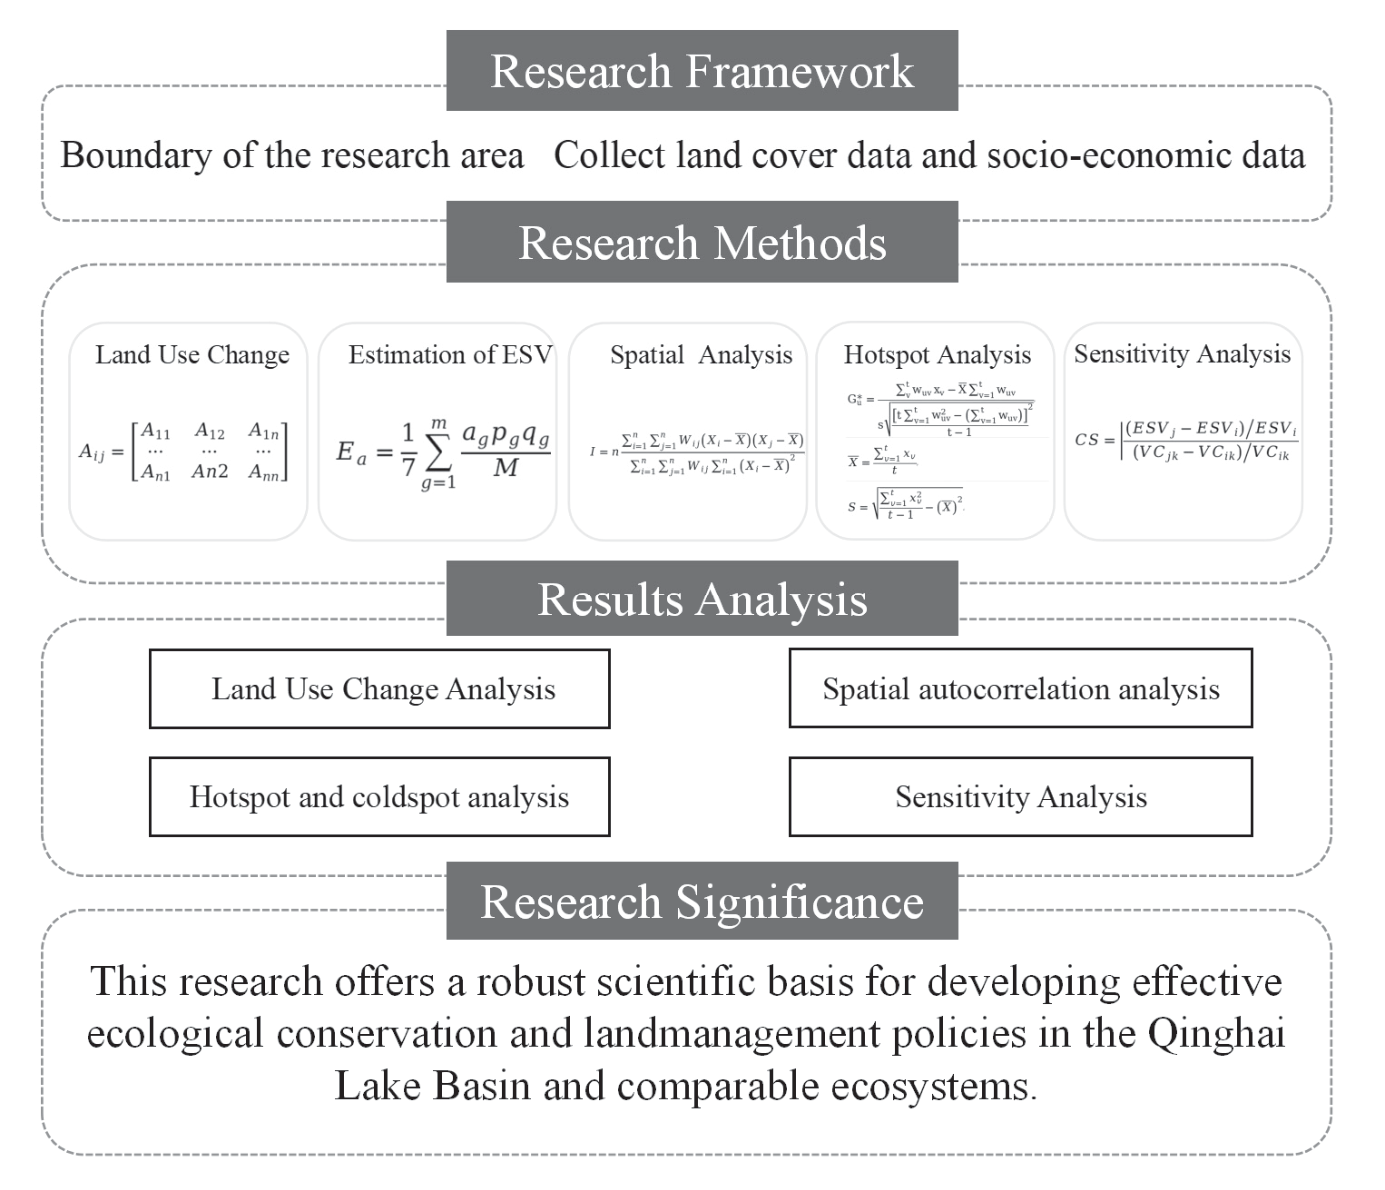
To analyze changes, this study used the vector boundaries of the research area, which are all based on the Qinghai Lake Basin boundary in 2023. The land cover data were derived from cloud-free Landsat satellite images captured in the dry season for the years 2003, 2013, and 2023. We classified the areas via the maximum likelihood supervised classification method into six categories: cropland, forest, grassland, water, wetland, and unused land [21]. This study constructed a comprehensive evaluation framework for examining the variations in LUCC and ESV across distinct basins in the Qinghai Lake Basin (Fig. 2).
Land Use Change Analysis
To conduct an in-depth analysis of land use changes in the Qinghai Lake Basin from 2003 to 2023, this study utilized multitemporal remote sensing imagery data combined with geographic information system (GIS) technology to quantitatively assess changes in various land use types [22]. The key land use types of focus in this study include cropland, forestland, grassland, water bodies, construction land, and unused land [23]. By comparing the land use status across different years, this study analyzes the trends and characteristics of changes in these land use types (Fig. 3).
Data Source: The primary data used in this study consists of Landsat series satellite imagery, including data from the TM, ETM+, and OLI sensors. For the study period, images from three key time points – 2003, 2013, and 2023 – were selected, with a spatial resolution of 30 m [24].
Preprocessing: The collected remote sensing images underwent several preprocessing steps, including radiometric correction, atmospheric correction, and topographic correction, to ensure the usability and accuracy of the data.
Land Use Classification System: Based on the “Land Use Classification Standard of Qinghai Province” and tailored to the specific characteristics of the study area, the land use types were categorized into six major classes: cropland, forestland, grassland, water bodies, wetlands, and unused land [25].
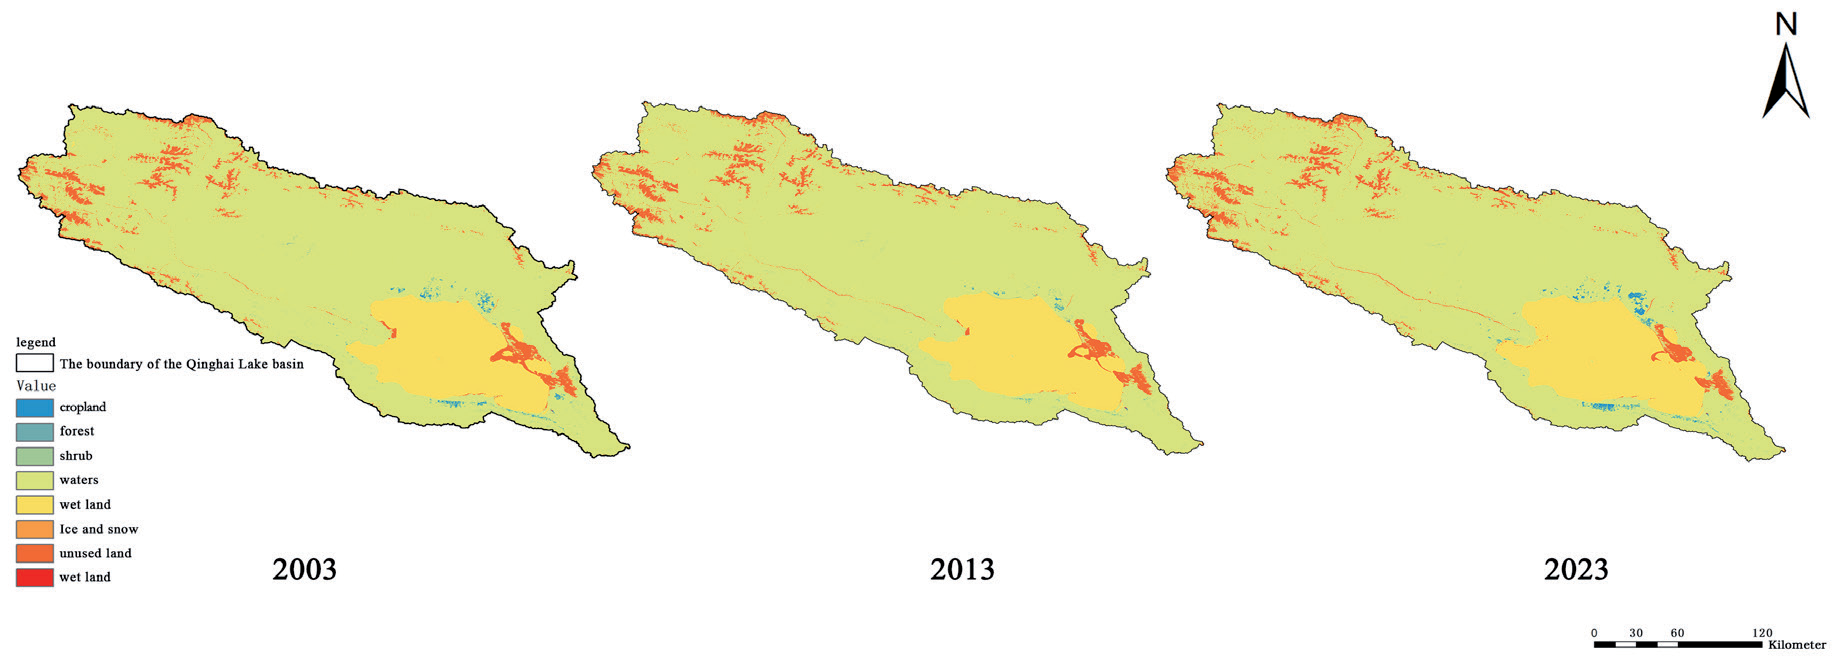
Change detection methods: A combination of supervised and unsupervised classification methods was employed to classify the land use data for different years [26]. Multitemporal land use change detection was conducted via GIS software, enabling the identification of changes across the selected years [27].
In this context, n represents the total number of land use types within the study area, where n = 7. The variable Aij denotes the area that has transitioned from land use type i to land use type j.
Estimation of ESV
ESV estimation is crucial for assessing ecosystem contributions to human well-being [28]. This study uses the equivalent factor method to quantify ES functions into economic values for the Qinghai Lake Basin (2003- 2023). By multiplying unit area values by land use areas, overall ES values were obtained [29].
where Ea refers to the economic value of food production (FP) per unit area of cropland, measured in RMB per hectare. g represents the primary grain crop types. m represents the total number of grain crops. ag, pg, and pg represent the cropland area of the grain crop g, the price of the grain crop g, and the food production FP or yield of the grain crop g, respectively. m is also used to represent the total cropland area dedicated to grain crops [30].
Equivalent factors: Referring to the study by Xie et al. (2003) and considering the actual conditions of the Qinghai Lake Basin, the ESV equivalent factors for each land use type are determined [31]. These factors represent the economic value of the ESs provided by each land use type per unit area.
ESs encompass four categories: provisioning services (PSs), regulating services (RSs), support services (SSs), and cultural services (CSs). Specifically, PS includes food production, raw materials, and water resources. RS comprises gas regulation, climate regulation, purification, and hydrology. SS involves soil conservation and the maintenance of nutrient circulation, as well as biological support. CS encompasses aesthetics [32]. Equivalent factors were assigned to each ES via the literature and local data, reflecting, for example, greater carbon storage in forests than in grasslands (Table 1). The service values for each land use type were then estimated by multiplying its area by the corresponding ES factor. Finally, these values were aggregated to obtain the total ESV for the Qinghai Lake Basin [33].
Spatial Autocorrelation Analysis
Spatial autocorrelation methods have been applied to evaluate the impact of land use changes on ESV in the Qinghai Lake Basin [34]. Global analysis utilizing Moran’s I index, which ranges from -1 to 1, was conducted to assess spatial dependency across the area, revealing clustering or dispersion patterns of land use types over time [35]. Local spatial autocorrelation analysis was further employed to examine clustering at smaller scales, pinpointing areas where land use changes significantly affected ESV. This dual approach provides insights into the spatial dynamics of land use and its effects on ESV.
where I represents the global spatial autocorrelation index, commonly referred to as Moran’s I, which measures the spatial dependency of ESVs across the study area. Wij is the spatial adjacency weight between locations i and j, indicating the degree of spatial proximity or influence between them [36]. The interpretation of the Moran’s I values is as follows: I>0 indicates positive spatial autocorrelation, indicating that similar values of ESs tend to cluster together spatially. I = 0 indicates no spatial autocorrelation, indicating that the distribution of ESVs is random, with no spatial pattern. I<0 indicates negative spatial autocorrelation, meaning that dissimilar values are spatially dispersed across the region. The larger the I value, the stronger the spatial clustering of ESs, suggesting that areas with high values of ESs are more likely to be geographically close to each other.
Table 1.
Equivalent factors and values of ESV per unit area for various LUCC types.
Hotspot Analysis
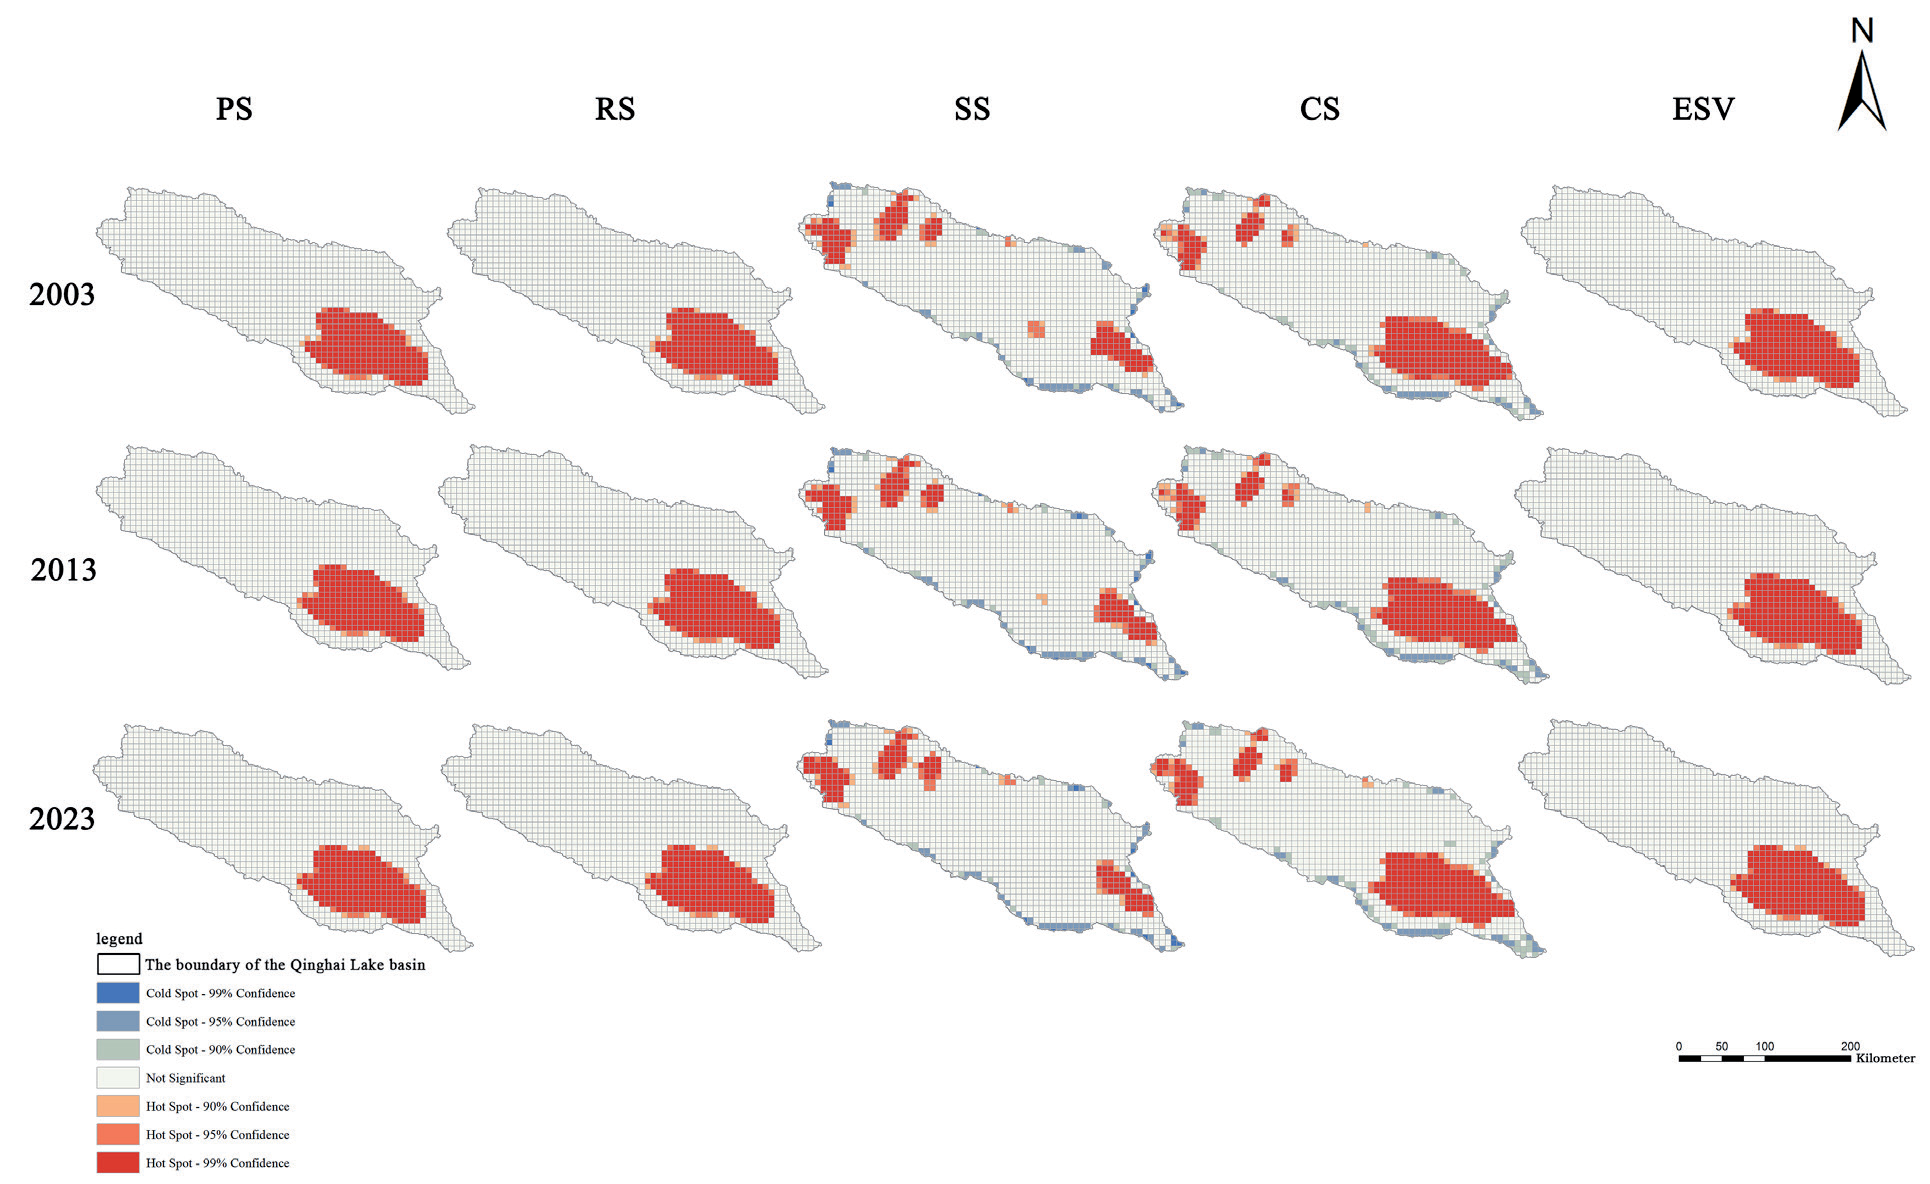
In the hotspot analysis of ESVs in the Qinghai Lake Basin, GIS and spatial statistics were integrated. The basin was classified into wetlands, grasslands, croplands, and construction lands via remote sensing and land use data (2003-2023), and the ESV per pixel was quantified via the equivalent factor method, ensuring data consistency through projection and coordinate system unification [37]. These ESV values were then combined with remote sensing imagery to create raster data, which represent the ESV spatially for each pixel. Clusters within these data were identified via the Getis‒Ord Gi statistic, a spatial statistical method that distinguishes high-value (hotspot) and low-value (coldspot) clusters. This integration method of GIS and spatial statistics revealed the spatial distribution and temporal dynamics of ESV hotspots and coldspots, providing a scientific foundation for ecological protection and land use optimization in the basin [38].
Where xv represents the ESV of grid cell v and where wuv is the spatial weight between grid cells u and v, indicating the spatial relationship or proximity between these two grid cells. t is the total number of grid cells in the analysis.
Sensitivity Analysis
Sensitivity analysis is key to assessing model robustness [39]. It identifies crucial variables, such as land use change, ES conversion coefficients, and climate factors (e.g., temperature, precipitation, and socioeconomic factors) that affect model outputs. For example, in the Qinghai Lake Basin, varying land use transition rates significantly impact ESs [40].
where i represents the early ESV of a land use type in the study area. ESVj refers to the adjusted ESV after land use changes in Qinghai Province. VCik and VCjk are the ESV coefficients for land use type k before and after the adjustment, respectively.
Results and Discussion
Spatiotemporal Analysis of Land Use Change
Between 2003 and 2023, significant land use changes were experienced in the Qinghai Lake Basin, driven by climate change, economic development, and policy shifts. Longitudinal land use data were analyzed via remote sensing and GIS and categorized into cropland, grassland, forestland, water bodies, and construction land (Fig. 4). The study revealed that cropland notably decreased, particularly near the lake, due to urbanization. Grassland and forestland remained relatively stable, but localized human activities led to grassland degradation and forest cover reduction. Construction land increased substantially, especially in urban areas near the lake, with an annual growth rate of 6.5%, which was correlated with regional economic development and population growth. From 2003 to 2023, cropland increased by 48.347 km², forest area decreased by 17.913 km², grassland area decreased by 327.152 km², water area increased by 286.443 km², wetland area increased by 9.541 km², and unused land area increased by 2.003 km² (Table 2).
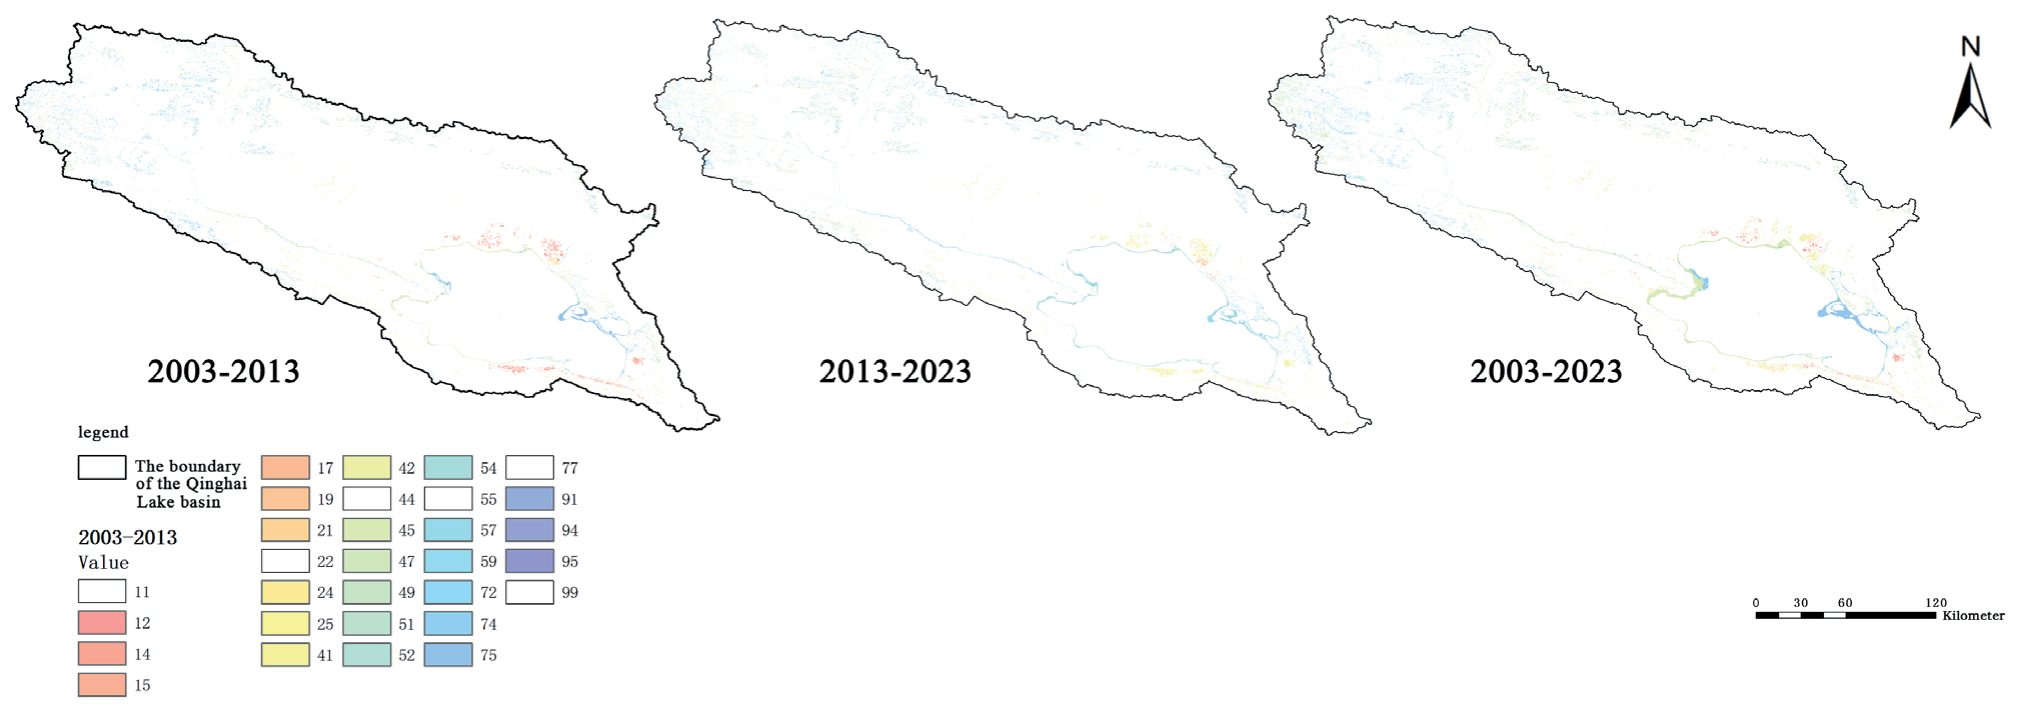
Table 2.
Land use change.
Spatiotemporal Evolution Characteristics of ESs
Land-use changes in the Qinghai Lake Basin have resulted in significant alterations to ESs, including water conservation, soil protection, biodiversity maintenance, carbon storage, and climate regulation. From 2003 to 2023, water conservation services were observed to fluctuate, decreasing from 1 billion RMB to 750 million RMB due to diminished grassland and forest cover, alterations in land use, and changes in climatic conditions. Significant changes were also noted in soil protection services, with an increase in construction land and a decrease in cropland, leading to heightened soil erosion risk and a reduction in economic value from 600 million RMB to 400 million RMB. Biodiversity faced threats as a result of land-use simplification and fragmentation, causing its value to decline from 800 million RMB in 2003 to 500 million RMB in 2023, a consequence of habitat loss and increased ecosystem vulnerability. Climate regulation services, particularly carbon storage, remained relatively stable but experienced a decrease in value from 900 million RMB to 600 million RMB due to the reduction in forested areas (Fig. 5).
From 2003 to 2023, PS increased by 1,223,281.624 million RMB, RS increased by 14,431,816.009 million RMB, and SS increased by 28,858.193 million RMB, with the majority of these increases concentrated in the northwest and southeast regions of the Qinghai Lake Basin. CS increased by 170,336.22 million RMB, primarily in the southeastern region of the Qinghai Lake Basin (Table 3).
Spatial Autocorrelation Analysis
Spatial autocorrelation analysis is crucial for assessing the impact of land use changes on ESV in the Qinghai Lake Basin, providing insights into spatial patterns and interrelations. This study utilized global and local autocorrelation techniques, focusing on Moran’s I index to measure spatial dependence. Moran’s I was computed for land use data from 2003, 2013, and 2023, revealing significant positive spatial autocorrelation in the cropland and construction land distributions. The mean Moran’s I values were 0.45, 0.55, and 0.62 for the respective years, indicating pronounced clustering (Table 4). The increase in Moran’s I over time suggests growing land use clustering, particularly for construction land, which is linked to regional economic growth and urban sprawl. These findings highlight the increasing spatial concentration of land use, challenging ecological balance and long-term ES sustainability in the region.
Hotspot and Coldspot Analysis
Hotspot and coldspot analysis is vital for assessing ES distributions and temporal evolution in the Qinghai Lake Basin, with a focus on identifying high- and low-ESV areas via the Getis‒Ord Gi statistic. Examining ESVs in 2003, 2013, and 2023 revealed significant hotspot shifts. In 2003, high-value areas for water conservation and biodiversity were concentrated in the southwestern grasslands. However, by 2023, urbanization has degraded these regions, reducing service provision and creating coldspots. Coldspot analysis highlighted areas with low ESVs due to grassland degradation and construction land expansion (Fig. 6). Overgrazing and urban sprawl converted specific grassland and forest areas into coldspots. These insights are crucial for guiding ecological protection policies, preserving high-value zones, and restoring low-value areas to maintain ES balance. This informs regional land use planning and sustainable strategy development.
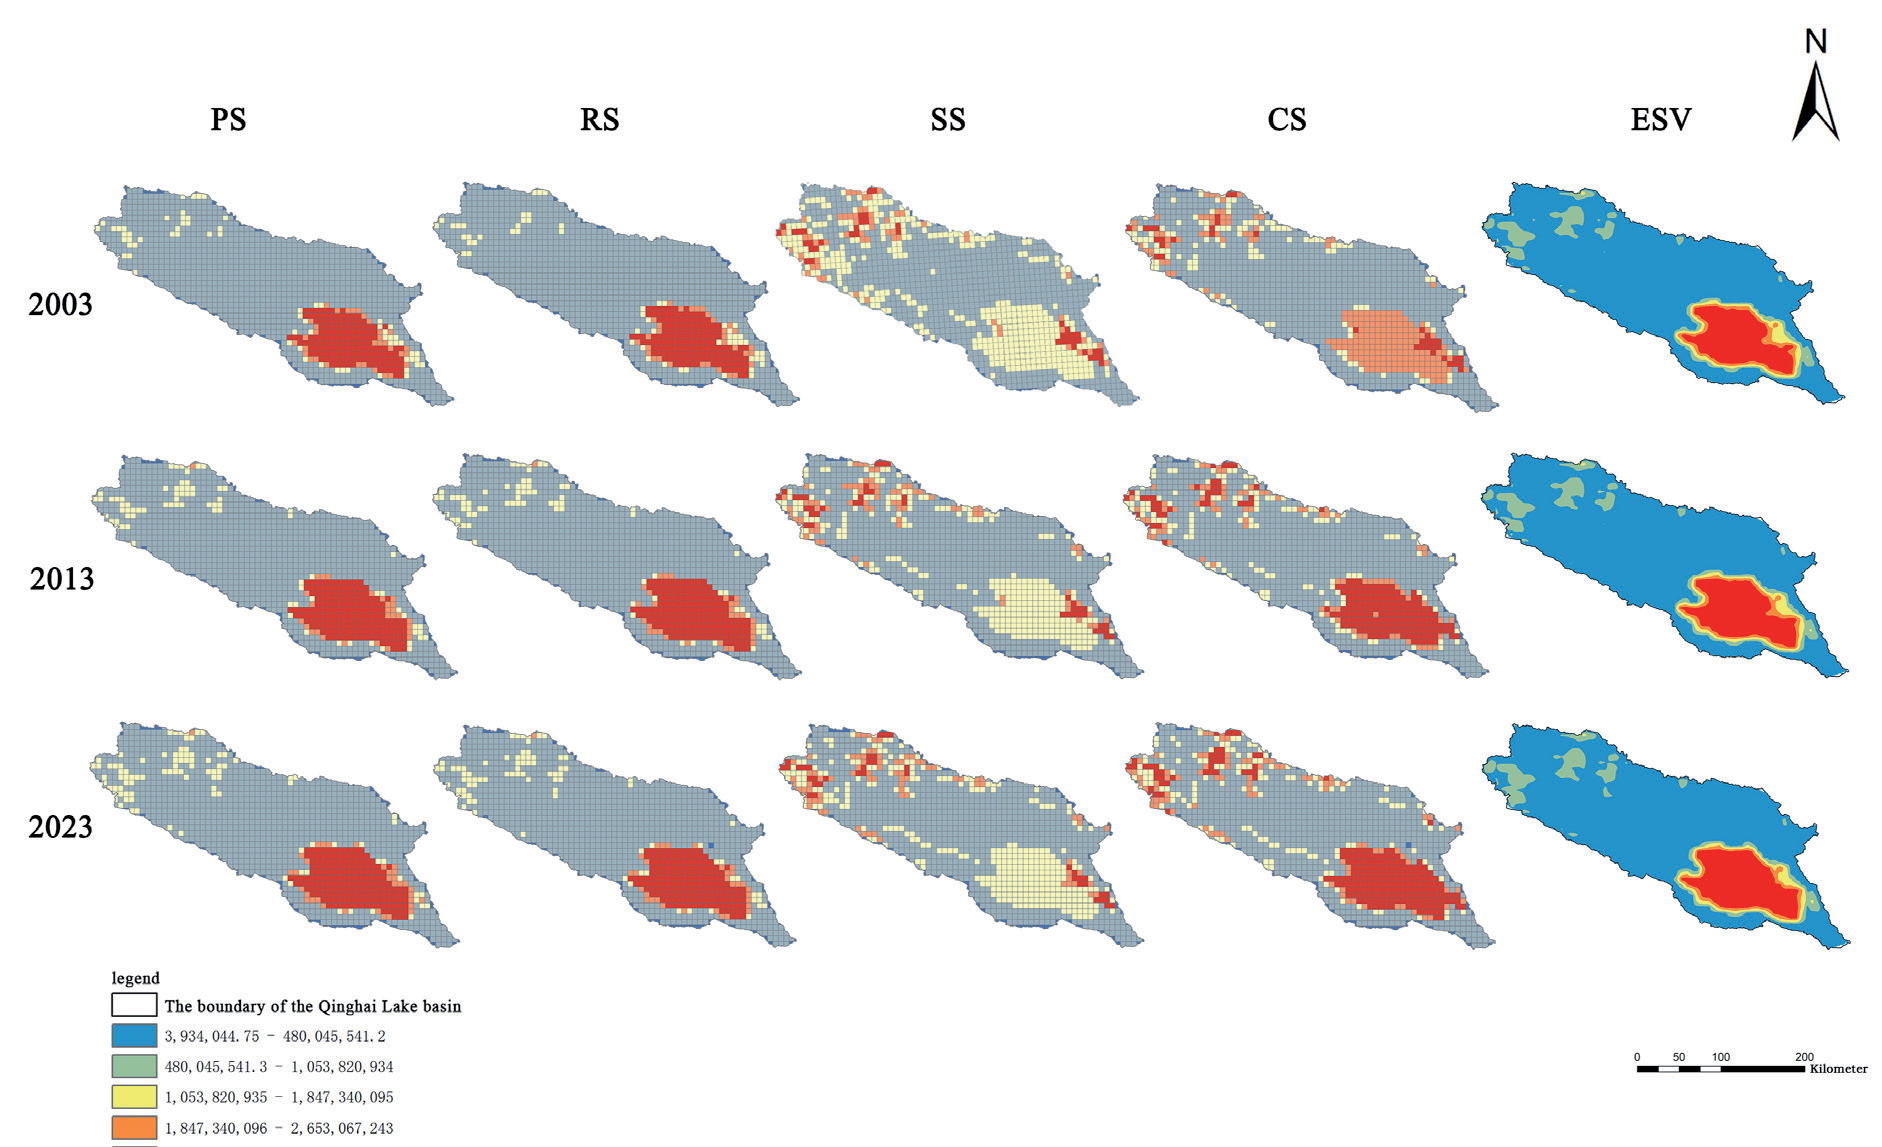
Table 3.
ESV Changes.
| Time | PS | RS | SS | CS |
|---|---|---|---|---|
| 2003 | 29032502.514 | 329017899.301 | 42139035.081 | 11009322.892 |
| 2013 | 29616391.860 | 336448430.459 | 42327687.685 | 11135185.343 |
| 2023 | 30255784.138 | 343449715.310 | 42167893.274 | 11179659.112 |
Table 4.
Moran’s I index values.
Sensitivity Analysis
In the sensitivity analysis, the ESV coefficients for each ecosystem type increased by 50%, and the sensitivity index for the Qinghai Lake Basin was computed. The highest sensitivity index was exhibited by forestland, yet all sensitivity indices were found to be below the threshold of 1, indicating low elasticity. This resulted in enhanced reliability of the estimated ESVs, demonstrating their robustness (Table 5).
Discussion
Impact of Land Use Change on ESV
This study revealed that land use alterations profoundly impact the ESV of the Qinghai Lake Basin. Wetland and grassland decline directly affects water conservation capacity [41]. When reduced, wetlands, which are crucial for water regulation, impair natural purification and destabilize lake and groundwater recharge, exacerbating water scarcity. Grassland degradation increases soil erosion and reduces retention capabilities. Construction land expansion is a primary driver of ESV decline. Tourism and urbanization encroach on wetlands and grasslands, causing land use homogenization and landscape fragmentation. Fragmentation disrupts biodiversity, ecological connections, and habitat provisioning services, intensifying pressures on wildlife in high-altitude ecosystems [42]. Agricultural land expansion also significantly impacts ESs [43]. While cropland enhances food production, inappropriate practices degrade grasslands, deplete soil fertility, and pollute, weakening soil retention and water purification services. Climate change uncertainties exacerbate the impacts of cropland development on high-elevation ecosystems. Wetlands and grasslands regulate the regional climate and mitigate extreme weather [44]. This decline has altered temperature and precipitation patterns, potentially increasing the number of extreme climate events. Local climatic shifts driven by land use changes may further impair ESs, creating a negative feedback loop. Unsustainable land use practices in ecologically fragile regions can result in irreversible ES losses [45]. Integrated and sustainable approaches to land use planning and ecological protection are essential. Future management should balance socioeconomic needs with long-term ES impacts, emphasizing trade-offs among land use types. Future research should focus on multiscenario simulations in land use planning, utilizing remote sensing, GIS technologies, and predictive models for climate change and socioeconomic development [46]. This approach assesses planning strategies and their potential impacts on ESV, identifying optimal strategies to protect and enhance ESV while supporting economic growth.
Spatiotemporal Distribution Characteristics Assessment
The spatiotemporal distribution of ESVs in the Qinghai Lake Basin exhibits considerable variability across different land use types and geographical zones [47]. High-ESV areas, which are concentrated around wetlands, grasslands, and aquatic bodies, play pivotal roles in water conservation, biodiversity preservation, and climate regulation. Wetlands and lakes, as key natural elements, shape regional ESV hotspots by providing vital habitats and water resources and contributing to climate regulation and pollutant purification [48]. However, recent land use changes, including wetland decline, grassland degradation, and construction land expansion, threaten these high-value regions, resulting in decreased ESVs and increased ecological stress. Human activities significantly influence the spatiotemporal patterns of the ESV in a basin. For example, areas with high population density and economic activity, such as tourism zones, urban centers, and agricultural/pastoral regions, have lower ESVs because of the predominance of construction land and cropland, reducing ES functionality. The expansion of construction land has not only led to the loss of high-value ecosystems but also caused landscape fragmentation and pollution, further compromising the surrounding ESs [49]. Intensive agricultural activities contribute to soil degradation and water pollution, further diminishing the ESV. This unbalanced distribution underscores the conflict between land use planning and ecological protection, which poses challenges for basin management.
Identifying high-value regions is crucial for ecological protection, and recognizing their dynamic nature is equally important. Climate change and human activities can alter the extent and location of these areas, while seasonal and interannual variability significantly impacts the spatial distribution of ESVs. For example, wetland area changes during wet and dry seasons influence water conservation and habitat services, causing ESV fluctuations. Long-term trends in lake levels and wetland areas shaped by climate change will redefine ESV spatial patterns [50]. Therefore, protecting high-value regions requires spatiotemporal monitoring and adaptive management. Low-value regions, which are typically found at the basin periphery, in densely constructed areas, and in regions with severe grassland degradation, have limited ES functions because of low vegetation cover and restricted land use diversity. However, ecological restoration and land management can improve these regions. Grassland restoration and revegetation in degraded areas can increase vegetation cover, enhancing soil retention and carbon sequestration. In constructed areas, expanding green spaces and improving drainage can increase ES capacity. The ecological restoration of low-value regions not only enhances the overall ESV but also alleviates the ecological pressure on high-value regions, promoting a more balanced ES distribution.
Understanding the spatial distribution characteristics of ESVs provides insights for predicting the impacts of land use change on ESVs. The basin’s land use pattern suggests center-to-periphery expansion, with construction and cropland encroaching upon high-value ecological areas. If this trend continues, high-value regions will diminish, reducing the overall ESV. Consequently, future land use planning should prioritize the protection and restoration of high-value areas, particularly wetlands and grasslands surrounding the lake, to maintain the ecological balance. Simulating the effects of various land use scenarios on ESVs offers decision-makers scientific support for sustainable basin development. By creating an ecologically prioritized scenario, researchers can evaluate how enhanced ecological protection and restricted construction land expansion would change the spatial distribution of ESVs, providing invaluable insights for effective land use policies that maximize ESVs while sustaining economic growth in the Qinghai Lake Basin [51].
Analysis of the Sensitivity Test Results
The sensitivity tests illuminate the complex, variable nature of estimating ESV in land use change contexts [52]. Variations in conversion rates among land use types significantly affect both the spatial distribution and aggregate ESV, especially given the disparate capacities of different land uses to provide ESs. Factors such as geographical location, climate, and human activity intensity within the same land use type also have nonlinear impacts, causing even minor conversion rate adjustments to result in substantial ESV fluctuations [53]. This is evident in the Qinghai Lake Basin, where wetland and grassland conversion to construction or cropland markedly reduces the ESV. Spatial heterogeneity in land use change further contributes to ESV estimation uncertainty. The Qinghai Lake Basin exemplifies notable temporal and spatial differences in land use changes and ES functions. Compared with changes in desert regions, wetland reduction around lakes has a more profound impact on water conservation and biodiversity. Disregarding spatial heterogeneity during ESV estimation may lead to biased results. Therefore, future studies should refine land use classification and service equivalent factor assignment via high-resolution remote sensing imagery and GIS to capture dynamic land use changes and increase the accuracy of ESV estimates [54].
Policy Recommendations
The assessment of ESV in the Qinghai Lake Basin highlights the need for rational land use and ecological management policies to ensure sustainable development. Significant land use changes, especially declines in wetlands and grasslands due to construction, greatly impact the basin’s ESV. Future policies must focus on conserving high-value ecosystems, optimizing land use, and enhancing ecosystem resilience. Wetlands, lakes, and grasslands are essential for water conservation, biodiversity, and climate regulation. Policies should protect these ecosystems, limit land use conversion, and combat grassland degradation through grazing prohibitions, restoration projects, and ecological compensation. Enhanced wetland monitoring is crucial for maintaining the ecological balance. Land use policies should prioritize ecological sustainability, balance synergies among land use types, and promote eco-friendly techniques such as circular agriculture. Efficient land use should be encouraged through urban planning, avoiding expansion into natural spaces. Land consolidation measures, such as vegetation restoration, should be implemented. Education and public participation are vital; raising awareness and promoting ecotourism and green agriculture can align economic development with ecological protection.
Conclusions
This study analyzed land use changes in the Qinghai Lake Basin (2003-2023), with a focus on impacts on ESV. Significant shifts, driven by economic growth, population rise, policies, and climate change, led to decreases in wetlands and grasslands and increases in construction land and cropland. Wetlands and grasslands provide crucial ESs, and their decline threatens the regional ecological balance and sustainable development. Spatial variability in land use impacts was observed, with negative effects concentrated in wetlands, downstream river zones, and urbanizing regions. Wetland degradation reduces water conservation and flood control, whereas grassland loss increases the risk of soil erosion. Expanding construction and cropland adversely affects biodiversity and hydrological regulation. This research advocates optimizing land use structures, implementing ecological compensation and protection policies, and adopting nature-based solutions such as wetland restoration and grassland rehabilitation projects. By quantifying land use contributions to ESV, decision-makers can be equipped with empirical data to balance ecological protection and economic development. Overall, this research refines the assessment of the impacts of land use change on ESV in the Qinghai Lake Basin, offering methodological and theoretical insights for future studies. It supports ecological protection, land management, and sustainable development, emphasizing integrated management within complex natural and social contexts.

