

Introduction
Water is a crucial global resource but scarce in many parts of the world. It is necessary for human health and socioeconomic development [1-3]. Based on this, groundwater tends to be the most important water resource, especially within semi-arid and arid regions such as Saudi Arabia. For example, in countries like India, which has the highest population globally, groundwater provides more than 80% of the rural drinking water demands [4]. If cautiously managed, groundwater reservoirs can provide sustainable and reliably safe drinking water for future generations [5]. However, this may require establishing considerable policies and laws as well as monitoring and management among all stakeholders [6]. Hence, groundwater quality assessment is necessary to protect human health and sustainability [7]. The assessment and management of groundwater through regular monitoring and testing plays a significant role in implementing appropriate treatment and purification processes that would be required for clean and safe drinking water. However, investigations have shown that groundwater quality is seriously deteriorating due to dynamic environmental conditions and, most importantly, anthropogenic activities [8, 9]. According to the WHO, access to safe and sufficient water must be available to all to achieve water sustainability [10, 11].
Globally, many incidents on the impacts of springs and groundwater pollution have also been reported, with the most common contaminants including heavy metals, fluoride, and nitrogen, among others [12, 13]. This has triggered various research efforts among researchers to assess the dynamics of groundwater quality deterioration and have attained significant results. For example, Fe, Pb, and Cr heavy metal groundwater contamination was reported by Al-Hogaraty et al. (2008) in Ajman City, Northern United Arab Emirates. Similarly, Basashi et al. (2018) reported an exceeding drinking quality permissible limit of Cr, Cu, Mn, Mo, Pb, and V determined using a scatter plot matrix from a groundwater pollution study in Wadi Baysh Basin, western Saudi Arabia. Similarly, Rajmohan et al. (2022) also reported the use of heavy metal pollution index (HPI), contamination index (Cd), health risk assessment (HRA) model, and multivariate statistical analysis to analyze the occurrence of multiple heavy metals, including Co, Cd, Cr, Cu, Mo, Ni, and Pb, along with high salinity (TDS > 1500 mg/l, 77%) in the coastal aquifer of Hada Al-Sham and its vicinities in Saudi Arabia. On the other hand, springs are a natural type of water resource that occurs due to the flowing of groundwater to the earth’s surface induced by high water pressure. This sometimes happens when groundwater is recharged due to rainwater, which consequently refills the groundwater aquifer and induces additional stress on the already existing water pressure [14]. Although spring water is essential as a natural resource, springs are threatened and continuously face decline due to various factors, including land use changes leading to environmental degradation, climate variability, etc. [15].
Furthermore, the physicochemical conditions of natural spring waters are usually affected by the variable nature of their location. Spring waters located around areas with high agricultural activities have higher concentrations of NO3− than areas without agricultural activities [16]. Various combinations of physiochemical and microbiological parameters have been used to estimate drinking water quality through traditional methods, such as the tests for turbidity, Total Dissolved Solids (TDS), Total Suspended Solids (TSS), pH, and E. coli [17, 18]. Therefore, since the quality of water is affected by several parameters that could be biological, chemical, and physical in nature, there is no single parameter that completely defines water quality. Hence, the Water Quality Index (WQI) was established to measure water quality [19]. Different quality indices are used to evaluate the degree of water pollution by converting the concentrations of the various water parameters according to their quality and significance [20]. Meanwhile, there are various conventional water quality evaluation methods, such as fuzzy logic [21], factor analysis [22], set pair analysis [23], hierarchical cluster analysis [24], and principal component analysis [25]. However, these methods require too many factors and assessments to successfully derive the water quality index. According to Chidiac et al. (2023), the water quality index is now extensively used to evaluate the overall surface and groundwater water quality due to its simplicity and effectiveness. It simply derives the overall water quality based on physicochemical and biological parameters aggregated into a single value from 0 to 100. Moreover, it involves only four basic processes, including selecting parameters, transforming the data into a common scale, providing the weights, and finally, aggregating the sub-index [26-28].
There are different innovations in the use of water quality indices developed by various researchers, such as SRDD [29], OWQI [30], NSFWQI [31], Smith’s index [32], and CCME [33]. However, these studies have shown incredible forms of WQI but still face some critical drawbacks for their effective application. Evaluating the reliability of groundwater quality indices is essential to ensure the accurate assessment of water resources. Data-driven models, such as artificial neural networks (ANNs) and support vector machines (SVMs), have proven effective in validating and improving indices such as the entropy-weighted water quality index (EWQI) [34].
The Entropy Weight Index (EWI) is an effective evaluation method for analyzing hydrogeochemical, physical, and biological parameters. Hence, combining the EWI with WQI would be a perfect match to provide reliable and reasonable water quality assessment results [35-37]. Alfaleh et al. (2023) [36] have studied the groundwater quality from Ha’il, Saudi Arabia, according to World Health Organization (WHO) standards using the entropy-weighted water quality index (EWQI), and reported a more accurate result. Similarly, Su et al. (2018) [37] assessed the groundwater quality of Shaanxi Province, Northwest China, using the EWQI and reported the health risk of nitrogen pollution due to mining activities. The study reported by Tegegne et al. (2023) [5] on the evaluation of groundwater quality for domestic and agricultural use in the Gunabay watershed of northwest Ethiopia also utilized EWQI and SAR as evaluation indices. On the other hand, high sodium and magnesium ion concentrations in the soil lower the infiltration rate and hydraulic conductivity, decreasing the amount of water reaching plant crops [38, 39]. Hence, the excess amount of SAR from groundwater quality is undesirable for irrigation. To address the research gap, this study will be the first of its kind to assess Yanbu Annakhal village’s groundwater quality distribution with a focus on evaluating its suitability for various potable and non-potable uses [5]. Samples were analyzed using various physicochemical parameters to distribute the spring water quality in the study area. The outcome of this study is expected to help researchers, decision-makers, planners, and policymakers develop an advanced approach to ensure the supply of pure water and effective groundwater management in Saudi Arabia.
Materials and Methods
Study Area
Yanbu Al Nakhal, located in the Medina region of western Saudi Arabia, is of great historical and geographical significance due to its strategic location along ancient trade routes and natural freshwater springs. It is situated at approximately 24°19′32″N latitude and 38°25′30″E longitude; the elevation is between 500 and 1814 m above sea level. Located near the Red Sea, Yanbu Al Nakhal has historically been a vital stopover for merchants, pilgrims, and travelers moving between the Levant, Egypt, and the Arabian Peninsula. The city’s oasis-like environment, created by its abundant springs, has supported human settlement and agricultural practices, particularly the cultivation of date palms.
Yanbu Al Nakhal’s water springs are one of the most prominent natural features of the region. For centuries, these freshwater springs have provided essential resources for local agriculture, making the city an agricultural center, particularly for date cultivation. The springs originate from natural aquifers in the surrounding mountains and valleys, forming streams and ponds that irrigate the fertile lands. Historically, the springs not only supported agriculture but were also a vital water source for travelers and pilgrims on their way to the holy cities of Mecca and Medina. The springs transformed Yanbu al-Nakhal into a green oasis in an otherwise barren area, making it a major settlement for centuries.
Over the past 50 years, the springs of Yanbu al Nakhal have faced complete depletion due to a combination of over-extraction, rapid urbanization, and prolonged droughts [40]. With high population growth and agricultural demand, unsustainable water management practices have placed significant pressure on the region’s natural aquifers, nearly depleting them. However, recent environmental changes have led to a gradual revival of these springs. A major factor has been increased regional rainfall, contributing to the natural replenishment of groundwater sources. Additionally, improved conservation efforts, such as implementing modern irrigation techniques and stricter regulations on water extraction, have played a critical role in restoring the springs. Together, these factors have begun to reverse the decline of this essential resource, offering hope for a sustainable future for Yanbu al Nakhal’s water system.
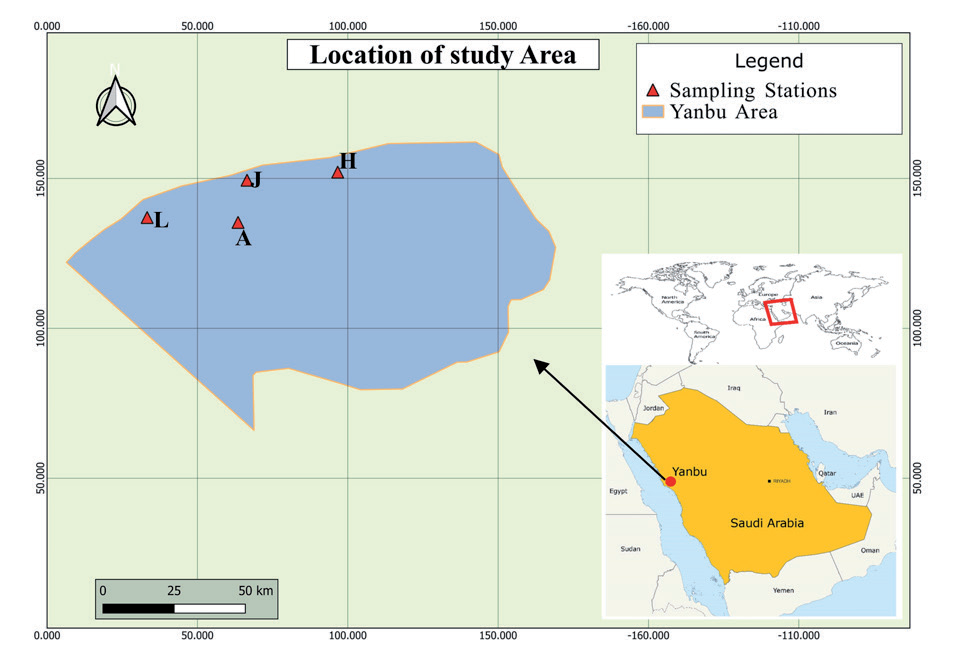
Water samples were collected from four springs, Ain Ajlan (A), Ain Ali Al-Harbiyah (H), Ain Al-Jabriyah, and Ain Al-Algamiyah (L), as shown in Fig. 1.
Data Collection and Analysis
Water samples from the water springs of Yanbu al Nakhal were collected in October 2023 via a standard water sample collection procedure. Specialized laboratory water sample collection bottles were used. Samples were collected from four different points labeled A, H, J, and L. Sample bottles were rinsed with deionized water thoroughly before use, and all collected samples were kept at 4ºC until use.
Fig. 1.
Study area, Ain Ajlan (A), Ain Ali Al-Harbiyah (H), Ain Al-Jabriyah, and Ain Al-Algamiyah (L), Yanbu Annakhal, Saudi Arabia.
The physicochemical parameters of the collected groundwater samples were analyzed using laboratory standard methods. The parameters analyzed include pH, F−,Cl−, Br−, NO3−, PO43−, SO42−, Na+, K+, Mg2+, Ca2+, and TDS (mg/L).
The collected samples were analyzed following standard methods described by the American Public Health Association [41]. TDS and pH were measured in situ using a portable instrument (HANNA, HI98194). Cations and anions were analyzed in the laboratory using an ion chromotrope instrument (Palo Alto, CA, USA, model: 720 ICP-OES Axial).
Water Quality Standards
To assess the spring water quality for both drinking and irrigation purposes, the laboratory-analyzed water quality parameters of the samples were compared with the water quality standards available from WHO and the Kingdom of Saudi Arabia (KSA).
Analysis of Indices
This study applied EWQI to evaluate the spring water quality in Yanbu al Nakhal for drinking purposes. Meanwhile, as groundwater quality for irrigation is often determined by its sodium and sometimes magnesium ion concentration, the sodium adsorption ratio (SAR) and the magnesium absorption ratios (MAR) matrices were used to evaluate the percentage of sodium and magnesium ions, respectively.
Entropy Weighted Water Quality Index (EWQI)
The EWQI algorithm process of aggregating all the groundwater physicochemical parameters to reflect the water quality index involves a series of steps, as reported in various literature [7, 26, 42-44]. However, the mathematical expressions for calculating the EWQI can be summarized in five basic steps, where m represents the water samples analyzed (i = 1, 2, 3 …, m) for a certain number of water quality parameters n (j = 1, 2, 3 …, n) [45, 46].
Step 1: The first step involves the determination of the eigenvalue of matrix “X” calculated by the given Equation (1):
Step 2: The second step involves standardizing the initial process using Equation (2) in order to remove the influences of magnitude and dimensions. Accordingly, after the standardization, the matrix value “Y” can also be obtained using the relation given in Equation (3).
Where the values xij (min) and xij (max) are the minimum and maximum values of the physicochemical parameters of the groundwater from the same sample. Meanwhile, Xij represents the initial matrix value of the process.
Step 3: The third step of the process involves the computation of the entropy (ej) and the entropy weight (wj) using the relations represented in Equations (4) and (5), respectively.
where Pij is given by the relation in Equation (4b)
Step 4: The quality rating is calculated in step four using the Equation of relation given in (6).
Where the values for cj and sj represent the concentration of a parameter and its permissible limit from the national water quality standard in mg/l, in this study, the WHO water quality standards were adopted along with the Saudi Arabian standard (Table 1) since most WHO limits are the same as the local limits from the Saudi standard.
It is important to note that based on the above equation, if the parameter cj is not detected, then the value of qj = 0. This also means that the parameter is equal to its allowable value, and hence, the qj for this parameter will be 100.
Finally, EWQI is evaluated using the relation in Equation (7).
Finally, the overall groundwater quality of the samples from the study area was classified according to the EWQI groundwater quality standard, ranging from <25 (extremely excellent quality) to >150 (extremely poor quality). Thus, EWQI groundwater quality classification and ranks are presented in Table 2 [5, 7, 47, 48].
Table 1.
Drinking water quality standard guidelines.
Sodium and Magnesium Adsorption Ratios (SAR and MAR)
There are various indices, such as potential salinity [49], permeability index [50], and exchangeable sodium percentage [51]. The Kelley index determines the suitability of groundwater quality for irrigation purposes, as well as the sodium adsorption ratio (SAR) and magnesium adsorption ratio (MAR) indices. First developed by Richards (1954), the use of SAR and MAR to analyze water quality for irrigation purposes is reported as a recommended and accurate method by various related organizations and agencies [19, 52].
Sarah (2004) was reported as the first to propose the concept of SAR based on the relation represented in Equation (8). Meanwhile, the magnesium adsorption ratio (MAR) is calculated based on the relation in Equation (9). The classification of groundwater quality based on sodium hazard, as proposed by Richards (1954), is given in Table 3. Based on this classification, a high SAR value of (>18 epm) infers a risk of sodium (alkali) substituting the available calcium and magnesium ions in the soil through the process of cation exchange [53-55].
The Ministry of Environment, Water, and Agriculture (MEWA), under the supervision of the Saudi Arabian Standards Organization (SASO), is responsible for the Saudi water quality standards based on the WHO guidelines [56]. However, there is no minimum WHO guideline set for TDS as there is no proven evidence on the effects of consuming low TDS water, but MEWA has set 100 mg/l, which is the target from the Saudi Water Authority (SWA), as a guideline for drinking water quality [56, 57]. Meanwhile, MEWA has considered 1000 mg/L as the maximum TDS permissible limit, as corrosive effects of chloride and sulfate concentrations may create significant problems for steel transmission systems [58, 59]. Some of the established water quality standard guidelines from WHO and KSA are presented in Table 1 [5, 60-62].
Results and Discussion
Physicochemical Parameters
The statistical results for the analysis of the sixteen groups of groundwater samples from four different points (labeled as A, J, H, and L) of the study area are presented in Table 4. The concentrations of the physicochemical parameters pH, TDS, F−, Cl−, Br−, NO3−, PO43−, SO42−, Na+, K+, Mg2+, and Ca2+ are in the range of 7.83-8.23, 820-1113, 1.506-1.541, 303.29-518.68, 1.937-3.228, 68.36-79.179, 0.002-0.04, 423.68-578.31, 200.81-292.89, 13.22-8.027, 39.083-54.324, and 155.65-228.95 mg/L, with an average mean of 8.03, 976, 1.524, 410.985, 2.583, 73.77, 0.021, 500.99, 246.85, 10.675, 46.704, and 192.30 mg/L, respectively. Based on the average concentration, Cl− and Na+ were the most abundant parameters, exceeding the WHO permissible limits for drinking water quality, followed by NO3− and Br− ions. All the collected samples from the four collection points (A, J, H, and L) exceeded the permissible limits for Br−, NO3−, and Na+ concentrations. Moreover, the groundwater TDS of all samples also exceeded the permissible limit of 700 mg/L with a mean average of 976 mg/L. Groundwater pH is an important hydrogeological parameter that indicates its suitability for drinking. According to the WHO drinking water quality standard, a pH of 6.5 to 8.5 is considered safe for potable use. The pH values of the groundwater samples from the study area ranged from 7.83 to 8.23 (Table 4). None of the groundwater samples from the four sampling points show a pH value below or more than the permissible limits. This indicates the absence of possible water pollution containing acidic or basic concentrations within the study area.
Table 3.
Classification of water quality based on SAR and MAR for irrigation purposes.
The findings of this study align with global concerns regarding groundwater contamination and its implications for drinking and irrigation. For instance, Tegegne et al. (2023) utilized EWQI and SAR indices to evaluate groundwater quality in Ethiopia’s Gunabay watershed and reported medium to poor quality due to agricultural runoff and geogenic factors [5]. Similarly, Rajmohan et al. (2022) employed multivariate statistical analysis to assess heavy metal contamination in the Hada Al-Sham region of Saudi Arabia, highlighting the significant role of salinity and anthropogenic activities [63]. These parallels underscore the global applicability of the EWQI and SAR indices in assessing groundwater quality and their potential in regions such as Yanbu Annakhal, where agricultural practices and natural geochemical factors contribute to elevated contaminant levels. Integrating these indices into the current study provides a robust framework for identifying key contaminants and informing mitigation strategies.
Moreover, this study’s focus on Yanbu Annakhal’s spring water addresses an essential knowledge gap, as research on groundwater quality assessment in this region remains limited. Previous studies, such as those by Pradipta et al. (2024) and El Yousfi et al. (2023), highlight the significance of using the EWQI for evaluating groundwater contamination. Pradipta et al. (2024) utilized multiple datasets to assess groundwater risks in the Arabian Basin of Saudi Arabia, demonstrating the applicability of EWQI in understanding contamination dynamics in arid environments [64]. Similarly, El Yousfi et al. (2023) applied the EWQI to predict and assess groundwater quality in the Ghiss-Nekkor Basin of northeastern Morocco, underscoring its effectiveness in identifying pollution levels in semi-arid regions [65]. These studies reinforce the global relevance of the EWQI as a robust tool for groundwater quality management, providing a strong foundation for its application in the Yanbu Annakhal.
Through the application of these methodologies, the present study not only validates their effectiveness in a new context but also highlights the unique challenges posed by high concentrations of chloride, nitrate, and bromide in Yanbu Annakhal. This research contributes to a growing body of literature emphasizing the need for targeted interventions and advanced monitoring techniques to ensure groundwater sustainability in similar arid environments.
Total Coliform
Total coliform is an important water quality parameter indicating the biological contamination of a water sample, where the acceptable WHO standard requires a total coliform of zero [66, 67]. Therefore, the bacterial count indicating the level of total coliform from groundwater was also evaluated based on their MPN (most probable number), a known statistical analysis used to evaluate the viable numbers of bacteria in a sample [68]. The total coliform count was detected in all four sample stations containing a total of 16 samples, indicating 100% of the total water samples, as summarized in Table 5b). Meanwhile, the MPN description for the majority of the water samples, except the average of samples collected at station H, was highly unsatisfactory, with MPN values of 315, 107, and 93 for stations A, J, and L, respectively. The MPN value of samples from station H can be ranked as suspicious and doubtful for potable and irrigational use due to the mean average MPN value of 7, as displayed in the data from Table 5b). Hence, it can be concluded that the total coliform level detected from the springs of the study area highly exceeds the permissible limit for drinking and irrigation purposes. A probable cause for increased total coliform from this region can be cross-connections with contaminated water sources from animals, human waste, and seasonal openings due to rainfall and agricultural runoff [69]. Meanwhile, a negligible strain of bacterial coliforms can likely cause illness up to serious health complications [70, 71]. However, the groundwater quality still meets the permissible limit for total coliform set by the WHO. As indicated earlier in Table 1, the WHO permissible limit for total coliform does not exceed 500-1500 CFU/mL, a unit equivalent to the MPN value per 100 mL [72]. It has been reported that E. coli contaminated manures and waters used for irrigation and contaminated the field crops, as they can survive for long periods in manure and water [73].
Table 4.
Physicochemical analysis of the collected water samples.
EWQI Assessment for Drinking Water Quality
As presented in Table 2, generally, when EWQI values of water samples are >100, such water is unfit for drinking purposes [74, 75]. To obtain a better understanding of the quality assessment, the EWQI values calculated for the study are presented in Table 6. The evaluated EWQI values ranged from 88.629 to 118.351 (Table 6), averaging 96.76. These results indicate that the groundwater quality of samples collected from Yanbu Annakhal Village, Saudi Arabia, can be considered medium to poor quality (ranking from III-IV), which is not recommended for drinking purposes unless with prior application of appropriate water treatment. The EWQI values indicate that three of the four (75%) groundwater collection points were of medium quality. Groundwater collected at sample points A, J, and H indicated medium quality with an EQWI of 89.280, 88.629, and 90.767, respectively. Meanwhile, the EQWI from station L indicates a poor-quality standard with an EQWI value of 118.351. This interpretation also indicates a groundwater quality ranking of III and IV for A, J, H, and L, respectively. Hence, based on the obtained EQWI, none of the samples can be graded as good (ranking II) or excellent (ranking I). The high EQWI values ranking the medium and poor quality of the groundwater from the study might be due to the high-level concentrations of some chemical ions (particularly Cl−, Br−, NO3−, and Na+ ions) exceeding the permissible limits [76]. High-level bromide and nitrate in groundwater indicate the possible impacts of agricultural activities and seawater intrusion [77]. Bromide assessment is crucial for groundwater quality assessment and has been reported as a tracer to identify possible intrusion of seawater into coastal aquifers. This is because, naturally, groundwater bromide levels lie below 0.1 mg/L unless contaminated due to various factors, including oil field brine and seawater intrusion [78, 79]. On the other hand, a high nitrate concentration indicates the occurrence of organic matter pollution, possibly due to manure and synthetic fertilizer application [80, 81]. General industrial waste materials, fertilizers, and animal husbandries all contain nitrogen compounds that can be soluble in water streams. Continuous agricultural cultivation may potentially lead to high nitrate concentrations in groundwater. Similarly, Menció and his co-workers (2016) researched the hydrochemistry and qualities of Catalonia groundwater samples from Northeastern Spain and observed high nitrate concentrations and positive linear relationships with some ions, indicating the magnitude of the fertilization [82]. Additionally, Rahman et al. (2018) observed a similar scenario in their study investigating nitrate concentration in the groundwater from the central coastal region of Bangladesh. They concluded that nitrate concentration can be elevated from the ground due to the huge amount of nitrate released every year from agricultural and other anthropogenic sources [83]. An increasing number of studies have reported that the potential health implications due to high nitrate intake include increased heart rate, abdominal pains, headaches, and nausea [84]. The average mean nitrate concentration from the study area is 73.8 mg/L, while the permissible limit for nitrate in drinking water, according to the WHO, is ≤50 mg/L. Hence, evaluating the possible contamination source for these ions in the groundwater will be essential to prevent their health implications.
Table 6.
EWQI assessment of the groundwater from the study area.
| Sample point | EWQI | Ranking | Water quality |
|---|---|---|---|
| A | 89.280 | III | Medium |
| J | 88.629 | III | Medium |
| H | 90.767 | III | Medium |
| L | 118.351 | IV | Poor |
However, it has been proven that one of the greatest importance of chlorination in water is the effective disinfection of microbial contamination due to bacteria and viruses [85-87]. On the other hand, it has been referenced as a trace element that may have either adverse or beneficial effects on humans based on its concentration level from drinking [88]. Possible health implications from chloride salt pollution may include direct effects on human body systems, especially respiratory and cardiovascular systems [89, 90]. The mean average chloride concentration in the study area is about 410.1 mg/L, while the WHO permissible limit is just ≤250 mg/L. Although chloride is a naturally occurring form of ion salt found in both fresh and salt water, its high-level concentration can be due to geogenic and anthropogenic sources. Geogenic sources may include geological formation of the study area, weathering and deposition of salts, etc. [91, 92]. The anthropogenic activities include the infiltration of salty ocean water, de-icing of roads from snow-bearing areas, and wastewater disposal [93]. These usually result from a dissolved form of salts, especially sodium and magnesium chlorides [94].
Correlation Analysis of Physicochemical Parameters
Correlation analysis, such as the Pearson correlation test, is an important statistical tool commonly used to show the degree of linear association between certain variables. Hence, it can be used to indicate the level of relationship between the physicochemical parameters and the quality of groundwater [17, 95]. A range between 1 and -1 interprets the degree of closeness of the chosen variables. The closer the correlation coefficient (r) is to a value of 1, the closer the linear association of the two variables and vice versa [96]. The Pearson correlation analysis of the major ions studied from the study area is displayed in Table 7. Based on the analysis, there is a significant positive interrelation between TDS and the concentration of major ions, particularly F−, Cl−, Br−, NO3−, Na+, SO42- K+, Mg2+, and Ca2+ ions. This suggests that the high-level concentrations of these ions significantly contribute to the spatial distribution of TDS. The correlation coefficient shows TDS is positively correlated with Cl−, Na+, K+, Mg2+, SO42−, and Ca2+ ions, with a correlation coefficient of 0.996, 0.996, 0.988, 0.989, 0.988, and 0.957, respectively, at confidence levels of 0.01. Furthermore, a strong interrelation also exists between Mg2+ and SO42− ion concentrations, with a correlation coefficient of 1. In the meantime, these ions constitute the component of major ground mineral evaporates such as mirabilite (Na2SO4), halite (NaCl), and gypsum [97]. Hence, their subsequent dissolution may be the reason for the high TDS level and salinity of the groundwater in the study area.
Groundwater Quality Assessment for Irrigation
Assessing groundwater quality for irrigation purposes is another essential procedure that determines the suitability of groundwater for agricultural use. This is because the application of groundwater quality assessment may attempt to minimize possible negative impacts on the irrigation plants and the soil at large. For example, soil content is affected by high sodium concentration, which can eventually lead to low plant productivity. Thus, sodium and magnesium absorption ratios were regarded as a common approach to assess the quality of groundwater suitability for irrigation purposes [98]. The results of the calculated SAR and MAR values for the study area are presented in Table 8.
The analysis found that all the samples from the four stations indicated poor quality based on their SAR value. Their individual SAR values evaluated were 20.392, 20.195, 19.497, and 24.610 epm for the A, J, H, and L stations, respectively. This result shows the unsuitability of the groundwater quality for irrigational purposes. On the other hand, the MAR evaluation result also shows 20.270, 19.169, 18.987, and 19.177 epm for the A, J, H, and L stations, respectively. Here, all the samples indicate a permissible limit for irrigation based on their individual and mean value of <25 epm. Therefore, this study found that the groundwater quality of Yanbu Annakhal collected at stations A, J, and H was of medium quality for both drinking purposes with reference to their EWQI assessment. Meanwhile, groundwater from station L is of poor quality and unsuitable for drinking purposes due to its high EWQI. The general quality assessment based on the SAR and MAR evaluation shows that the groundwater from the study area is unsuitable for irrigation due to its high concentration of sodium ions. High sodium concentration and potential salinity hazards may restrict proper plant growth because of reduced soil permeability and water circulation [99-101].
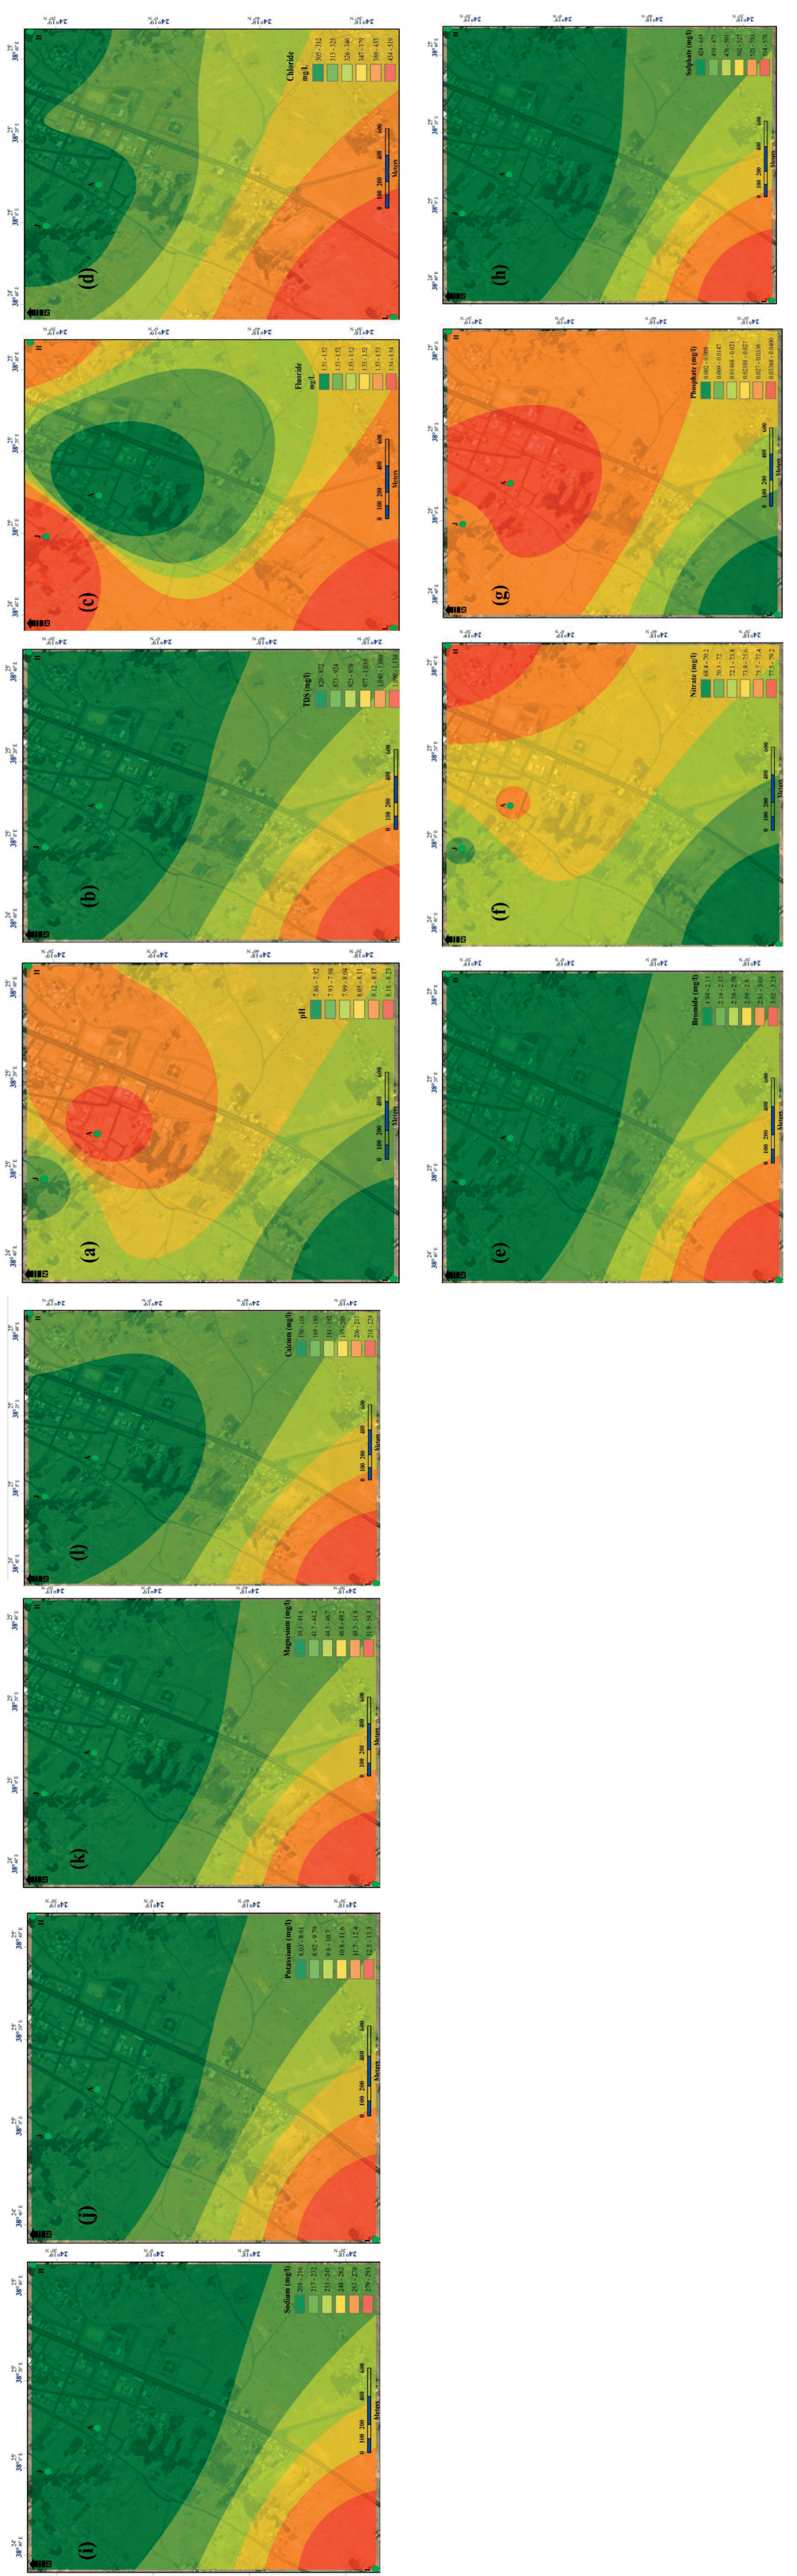
Spatial Analysis of Groundwater Physicochemical Parameters
Fig. 2(a-i) present the spatial contour map distributions of the physicochemical parameters (pH, TDS, F−, Cl−, Br−, NO3−, PO43−, SO42−, Na+, K+, Mg2+, and Ca2+) based on their concentrations from the study area. The proof of contour maps shown in these figures shows an excellent relationship between the observed and estimated data according to the correlation coefficient (R), which ranged from 0.88 to 0.99 from the Pearson correlation analysis. The pH values tend to look spatially heterogeneous and increase towards the northern part, while most other parameters increasing towards the western part of the region indicate pinker to reddish contour coloration. Station J in the top north and L in the northeast have indicated excellent pH (neutral) and alkaline water quality at stations A and H (pH values ranging from 8.12 to 8.23). The southwestern portion of Yanbu Annakhal is typically dense with a high concentration of F−, Cl−, Br−, NO3−, PO43−, SO42−, Na+, K+, Mg2+, and Ca2+. In contrast, NO3− and PO43− have a different geographical distribution pattern where low concentrations of the NO3− and PO43− have been observed towards this region, indicating light to dark greenish colorations. In fact, a greater portion of the study area, indicating stations A, H, and J, have shown greener coloration for most of the parameters, indicating their low concentrations except for F−, NO3−, and PO43−. Hence, it is obvious that these areas might have groundwater contamination on the concentration of these parameters due to geochemical properties or anthropogenic activities. Furthermore, the decrease in the concentration of these ions demonstrates that the groundwater stream possibly flows towards the west. In general, poor groundwater quality is emerging in station L upstream of Yanbu Annakhal Springs to the west in the study area due to its high concentrations of the physicochemical parameters. Long-term consumption of contaminated groundwater containing high concentrations of physicochemical water parameters beyond acceptable might impact human health, leading to various tissue and organ disorders. Therefore, appropriate assessment and pre-treatment of polluted groundwater are necessary before residents use it for drinking and/or irrigation purposes.
Limitations of the Study
Due to funding limitations and access to advanced laboratory facilities, the study has not included research on assessing trace elements, particularly heavy metals, which have a significant public health impact. Similarly, no assessment study on the boron concentration for irrigational purposes has been reported. Nevertheless, the most significant WHO physicochemical parameters required for assessing groundwater quality for drinking and irrigation have been appropriately considered under standard guidelines. Further research may focus on assessing the potential trace elements from the groundwater of the study area to determine its complete suitability for both human drinking and agricultural use.
Table 7.
Pearson correlation coefficients of the groundwater physicochemical parameters in the study area.
Fig. 2.
Spatial contour map distribution of physicochemical parameters of the study area. a) pH, b) TDS (mg/L), c) Fluoride (F−), d) Chloride (Cl−), e) Bromide (Br−), f) Nitrate (NO3−), g) Phosphate (PO43−), h) Sulfate (SO42−), i) Sodium (Na+), j) Potassium (K+), k) Magnesium (Mg2+), l) Calcium (Ca2+).
Conclusions
Yanbu Annakhal’s springs’ water quality was evaluated for drinking and irrigation purposes. EWQI, SAR, and MAR indices were used in this study. EWQI revealed medium quality in three locations (A, J, and H) and poor quality at the fourth location, L. Most importantly, the water quality is graded “unsatisfactory” based on the level of its total coliform. The use of microbially polluted water, especially for drinking purposes, could certainly pose a threat to the public’s human health. Hence, there is an urgent need to investigate and establish a proper treatment system for the groundwater in Yanbu Annakhal before public use.
Based on SAR and MAR evaluations, the overall quality assessment indicates that the groundwater in the study area is unsuitable for irrigation due to its elevated sodium ion concentration. It was also found that the concentrations of physicochemical parameters such as Cl−, Br−, Na+, and NO3− were elevated, exceeding the water quality standards set by WHO and KSA. Possible causes for the contamination and high increase in physicochemical parameters of the groundwater were also evaluated. Geologic formation of the study area and population increase, which in turn gave rise to anthropogenic activities such as farming and livestock grazing, were identified as possible causes for the contamination.
The study has also shown that using the EWQI, SAR, and MAR is quite enough to determine the groundwater quality of a given geographic location by weighing its value of water quality physicochemical parameters. Hence, the sensitivity of the EWQI method is far better than that of conventional methods, which require a large variety of parameters. Hence, utilizing this can help decision-makers in the water sector to quickly and accurately assess the groundwater quality for public interest. Accordingly, the outcome of this study may be useful for other researchers. The results of this research could apply to similar situations to conduct similar groundwater quality assessments elsewhere for scientific publication.

