

Introduction
Trypanosoma evansi (T. evansi), a haemoprotozoan parasite, is the causative agent of surra or trypanosomiasis in tropical and subtropical regions and affects a wide range of domestic and wild animals, including cattle, camels, horses, and various wildlife species [1-3]. T. evansi is a serious and potentially fatal disease causing substantial economic losses in animal production due to decreased productivity, and loss of weight. Furthermore, T. evansi has been linked to failure in vaccination, which can substantially impact global trade in live animals and their products, in addition to the widespread utilization of trypanocides [4-6].
Globally, it has been reported in Africa, Asia, Europe, and South America that the susceptibility to T. evansi infection differs among host species, and the prevalence varies geographically [5]. In Asia, T. evansi is prevalent in the Arabian Peninsula, including Saudi Arabia, the United Arab Emirates, Jordan, Lebanon, Syria, Iraq, and Pakistan [7-9].
Diagnosis of T. evansi can be challenging due to the intermittent presence of the parasite in the bloodstream and low parasitemia due to early or chronic infections [10, 11]. Several diagnostic methods can be used, including microscopic examination of blood smears, serological tests, and PCR amplification of parasitic DNA [12]. Although the blood smear examination and serological assay have been used for years in the standard diagnosis of T. evansi, both assays presented have low sensitivity to detect and differentiate between the various Trypanosoma species in animals. Therefore, different molecular assays have been developed to overcome the limitations of parasitological and serological methods [12, 13] and improve the diagnosis of the disease in both early and chronic infections [14, 15]. Moreover, it was found that PCR showed high sensitivity and specificity, being able to detect T. evansi at very low levels, ranging from 1 to 10 trypanosomes per one milliliter of blood [16].
Further, T. evansi can be amplified and sequenced using several primer sequences targeting different regions or genes, including kinetoplast DNA, the internal transcribed spacer area, ribosomal DNA, and variable surface glycoprotein (VSG) genes with varying degrees of sensitivity and specificity [10, 17-19]. According to [18, 20], the RoTat 1.2VSG sequence is distinct and specific for the identification and characterization of T. evansi.
In Saudi Arabia, T. evansi infection is endemic in camels and recently the parasite has also been reported in horses, either microscopically or genetically [7, 21- 26]. A 2018 study using PCR and blood smear for detection of T. evansi in 4.3% and 5.6% of blood samples from stray dogs by PCR and blood smear, respectively [27]. A 2009 study examining blood samples from camels, cattle, sheep, and goats found T. evansi infection in camels, but this study did not detect T. evansi in cattle, sheep, and goats by microscopy depending on the region [22]. In cattle, the high seroprevalence of T. evansi was reported from India and Egypt [2, 28] and a high molecular prevalence of T. evansi in blood samples obtained from Egyptian cattle has been reported [10]. Therefore, these studies conducted in Saudi Arabia and other countries indicate that this parasite may exist in cattle.
Additionally, the livestock sector in Saudi Arabia has a positive long-run response to Agricultural Growth Domestic Product, where it might be considered as the leading subsector in the economy [29]. Furthermore, Saudi Arabia leads the livestock sector in the Gulf Cooperation Council (GCC) region, particularly in the production of animal products. Therefore, cattle are essential for food production and economic stability in Saudi Arabia [30]. There are no published data on T. evansi for cattle in Saudi Arabia. Therefore, the current study aimed to use blood smear examination and PCR to determine the prevalence of T. evansi in naturally infected cattle from Makkah city, and to genetically characterize T. evansi isolates utilizing the RoTat 1.2 VSG gene.
Methods
Study Area and Sampling
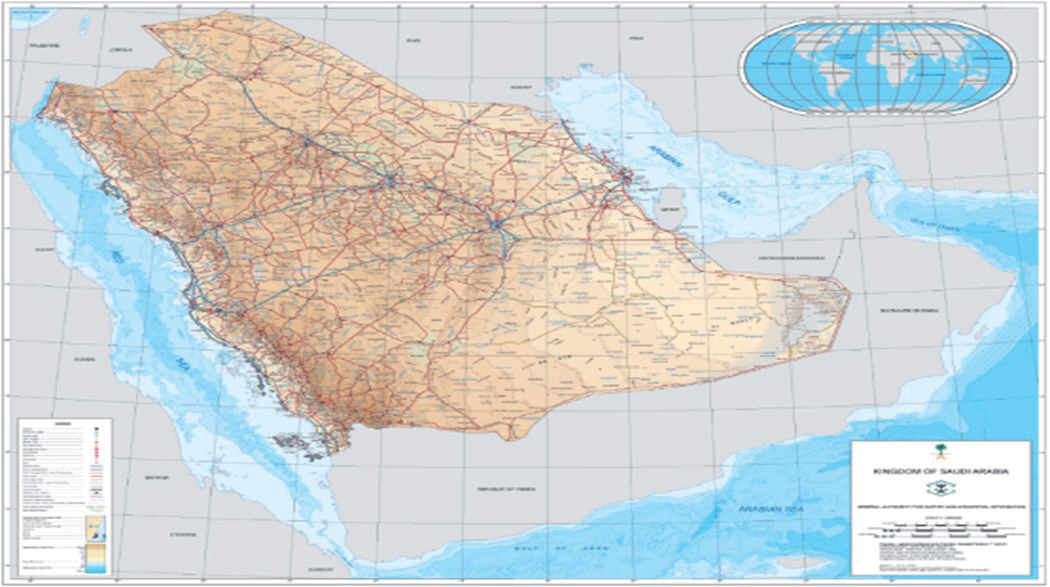
The study was performed at the AlKai’ah slaughtering house, one of the hajj abattoirs, which was chosen because it processes all kinds of animals, in Makkah City (21.4241°N, 39.8173°E) in Saudi Arabia (Fig. 1). According to the Koppen-Geiger climate classification, the climate is a hot desert type. During the year 2023, 150 blood samples were randomly collected from cattle submitted for slaughter. Blood samples were collected from the jugular vein and transferred into EDTA tubes (BD Vacutainer® Tube, Gribbles Pathology, VIC, Australia). The samples were then sent in a cool container to the Parasitology Laboratory of the Biological Department, College of Science, University of Jeddah, for microscopic examination. A thin blood smear was used to confirm the presence of T. evansi. In brief, a drop of EDTA blood was placed and spread on a clean slide. The smear was dried, followed by fixation with absolute methanol for 3 minutes. Afterward, excess methanol was removed, and the thin smear was stained by Giemsa stain diluted at a ratio of 1:20 for 20 minutes. Finally, the blood film was examined under magnifications of 100× (using oil immersion microscopy) to detect trypomastigotes [31]
DNA Extraction
Total genomic DNA (gDNA) was extracted from 150 blood samples (200 μl) using the DNeasy Blood and Tissue Kit (Qiagen, Hilden, Germany), following the protocol described by the manufacturer, and the gDNA was stored at − 20ºC until PCR testing.
PCR
PCR was performed on all gDNA extracts for the detection of partial fragment (488 bp) of T. evansi type A using the RoTat 1.2 VSG primer pairs: forward primer: 5’-GCCACCACGGCGAAAGAC-3’; reverse primer: 5’-TAATCAGTGTGGTGTGC-3’ [32]. PCR reaction was performed in a 25μL reaction volume containing 12.5 µL of 2X GoTaq® Green Master Mix (Promega, USA), 1 µL (0.5 µM) of each primer, and 2 µL of DNA extract and 8.5 µL of ddH2O. The PCR protocol was one cycle for 3 min at 94ºC, 30 cycles (94ºC for 60 s, 58ºC for 60 s, and 72ºC for 60 s), and one cycle at 72ºC for 5 minutes. Negative (no DNA template) control was included. The PCR result that was amplified was placed on a 1.5% agarose gel, stained with 0.5 μg/ml of ethidium bromide, and examined using a gel documentation system (Biospectrum UVP, UK).
Sequence Analysis and Phylogenetic Analysis
Twelve positive RoTat 1.2VSG PCR samples were chosen based on the density of the band and PCR products were purified by QIAquick PCR Purification Kit (Qiagen, Germany). Sanger sequencing of purified DNA was performed in an automated DNA sequencer (ABI 3730XL, Solgent Co. Ltd., South Korea). The sequences were read and edited manually using DNA BaserV3 software (Heracle BioSoft S.R.L./ Romania) to fix any potential calling errors. The Basic Local Alignment Search Tool (BLAST) (http://www.ncbi.nlm.nih.gov/ BLAST) was used to search for sequence similarity. The RoTat 1.2VSG sequences were aligned using Clustal W in MEGA X software (www.megasoftware.net) with sequences available in the GenBank database. For phylogenetic tree construction, the Neighbor-Joining (NJ) method was used in MEGA X with 1000 thorough bootstrap replicates. The evolutionary distances are expressed in base substitutions per site and were calculated using the Maximum Composite Likelihood technique. There were 19 nucleotide sequences in this investigation. All gaps and missing data were removed (complete deletion option). Of the 12 partial sequences, two were identified in the study and have been deposited in GenBank under the accession number PP105580 and PP105581.
Statistical Analysis
The kappa agreement test between blood smear and PCR was calculated using online statistical tools (http://vassarstats.net). The assessment of the sensitivity and specificity of blood smear compared to PCR as a reference test were calculated using MedCalc Software Ltd. (https://www.medcalc.org/calc; Version 20.115).
Results
PCR and Microscopic Analysis of Stained Blood Smears
According to microscopic analysis of stained blood smears, the overall prevalence of T. evansi among 150 cattle was 20.7% (31/150) and reached 25.3% (38/150) by PCR targeting RoTat 1.2VSG. Furthermore, the 31 blood smear-positive samples were also PCR positive. Based on the positive and negative results, the Kappa agreement between the two tests (blood smear and PCR) showed very substantial agreement (0.71; 95% CI = 0.63-0.88) (Table 1). In addition to the kappa results, the blood smear showed 91.33% accuracy, 73.68% sensitivity, and 97.32% specificity in detecting Brucella antibodies in cattle compared to the results of PCR as a reference test (Table 2).
Phylogenetic Analysis of RoTat 1.2VSG Gene of T. Evansi
Sequences (PP105580, PP105581) were searched in the GenBank database that confirmed the PCR amplicons’ identity as T. evansi with an identity of 99% (3 nt substitution). The BLAST search revealed that the closest hit for all Trypanosoma sequences was T. evansi with 97.5-100% nucleotide identity and the genetic divergence ranged from 0.01 to 1.97 (Fig. 2).
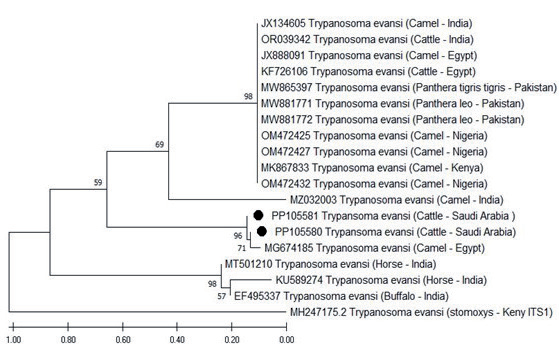
Phylogenetic analysis (Fig. 3) of the partial amplified RoTat 1.2VSG gene of T. evansi revealed a clustering of our isolates with groups with similar sequences previously identified in camels, cattle, Panthera lea, and Panthera tigris tigris from Egypt, India, Pakistan, Kenya, and Nigeria with 59% nodal support. The sequences presented in this study are closely related to T. evansi isolate found in Egyptian camels (Accession number: MG674185) with 96% nodal support. They also showed a little genetic divergence of 1.84-1.97 from the RoTat 1.2VSG gene of the T. evansi found in horses (Accession number: KU589274-MT501210, India) and buffalo (Accession number: EF495337, India) (Fig. 2). The resulting pattern supports the soundness of RoTat 1.2VSG analysis as a particular marker of T. evansi type A and identifies minor changes between closely associated sequences. A partial sequence from the ITS1 region of T. evansi (Accession number MH247175.2) was included as an outgroup for phylogenetic analysis (Fig. 3).
Table 1.
Kappa value, standard error, and 95% confidence interval for the test agreement (Blood smear vs. PCR) for T. evansi diagnosis in 150 cattle.
| Variable | PCR | Total | K-value | Standard Error | 0.95% Confidence Interval | ||
|---|---|---|---|---|---|---|---|
| Blood smear | Positive | Negative | 0.71 | 0.065 | 0.63-0.88 | ||
| Positive | 28 | 3 | 31 | ||||
| Negative | 10 | 109 | 119 | ||||
| Total | 38 | 112 | 150 | ||||
Table 2.
Estimated sensitivity and specificity of blood smear compared to PCR results.
Discussion
Molecular biology facilitates epidemiological surveys of infectious diseases, particularly trypanosomiasis in domestic animals; nonetheless, T. evansi in livestock has received little attention until recently. During the previous period, Saudi Arabia’s cattle industry experienced significant expansion to fulfill the rising demand for its meat.
In our study, the prevalence of T. evansi infection in cattle was 20.7% using blood smear examination, which is higher than the 2.75% reported in cattle and buffaloes from India by conventional parasitological methods [15] and 1% in cattle from Indonesia [33] but lower than the 42.2% found in Egyptian cattle by ELISA [28]. The PCR revealed a higher infection rate (25.3%) in cattle, which is lower than the 30.4% found in Egyptian cattle by PCR [10] and higher than the infection rate (3%) reported in Indonesia [33]. Several factors explain the difference in the detection rate of T. evansi infection by blood smear screening and PCR. Among these factors is the low sensitivity of the blood smear, with a detection limit of 105 trypanosomes/ml [5, 34]. During the chronic phase or the presence of the parasite in low quantities, PCR showed the ability to detect 1-20 parasites/ml of blood [35, 36] in studies that supported our results.
Fig. 2.
Divergence between partial RoTat 1.2VSG T. evansi sequences (Accession number: PP105580 - PP105581) and available reference T. evansi nt sequences of RoTat 1.2VSG gene. The number of base substitutions for each site between sequences is shown.
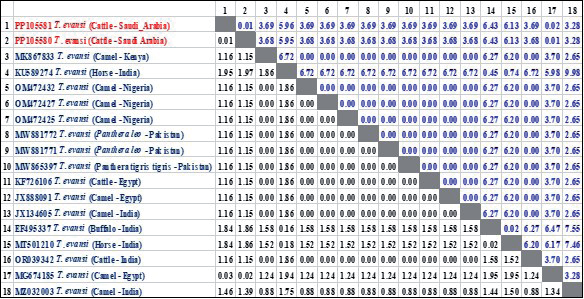
Fig. 3.
Phylogenetic tree based on partial RoTat 1.2VSG gene nt sequences from T. evansi isolates from cattle in Saudi Arabia and nt sequences worldwide, available in GenBank. The evolutionary history was inferred using the Neighbor-Joining method. Two sequences of T. evansi obtained in the present study are represented by a black circle.
The sensitivity of blood smear (73.68%) was close to the 76% observed in Egypt [37] and higher than the 27.02% recorded in India [38]. However, the specificity of the blood smear (97.32%) was lower than the 100% reported in Egypt [37]. Although PCR increased T. evansi detection in blood samples that tested negative by blood smear, we found substantial agreement (κ = 0.71, 95% CI = 0.63-0.88) between blood smear and PCR results. A previous study in Egypt found almost perfect kappa agreement (κ = 0.83) between the results of a blood smear, CATT, and PCR tests [37]. Another study in Pakistan reported poor agreement between blood smears and PCR [19]. This variation is due to changes in the number of samples, location, farm management, and animal conditions.
This study tried to genetically characterize the prevalence of T. evansi in cattle in Saudi Arabia. Thirty-eight of the 150 cattle sampled in this study were positive for T. evansi by RoTat 1.2VSG PCR. Previously in Saudi Arabia, T. evansi infection has been reported in camels, horses, and dogs either microscopically or genetically [7, 21-26]; nevertheless, we could not find any sequences of T. evansi targeting RoTat 1.2VSG gene indexed in GenBank. Moreover, no published data on T. evansi are available for cattle in Saudi Arabia. Therefore, this is the first study reporting the parasite in Saudi Arabia microscopically and molecularly using the RoTat 1.2 VSG gene. Our findings are supported by a previous study from Egypt, where the presence of the T. evansi parasite was first reported in cattle raised alongside camels [10] and infection was confirmed by PCR targeting the ITS and RoTat 1.2 VSG genes and Sanger sequencing of the VSG gene.
Analysis of nucleotide sequence pairwise alignment of RoTat 1.2VSG from T. evansi (n = 2) revealed a high degree of identity (>99%) in between and ranged 97.9-100% with those retrieved from the GenBank. This pattern indicated that the RoTat 1.2VSG gene was useful and informative for the genetic characterization of T. evansi isolates and to distinguish it from other members of the Trypanozoon subgenus [32, 39]. Recently, [40] reported a non-RoTat 1.2 T. evansi in Kenya and classified it as T. evansi type B. The findings presented here revealed that the T. evansi isolates found in cattle have the RoTat 1.2 VSG encoding gene. Although the RoTat 1.2VSG region is substantially conserved across T. evansi strains [20], two T. evansi sequences have been created with little variation, most likely due to the influence of geography, host, chronic disease, and treatment [39, 41].
Phylogenetic analyses of the partial RoTat 1.2VSG gene (Fig. 3) showed that the two obtained T. evansi sequences were clustered into one clade and revealed intraspecies genetic difference in at least two groups within one host (cattle) and were clustered close to the T. evansi sequence (Accession number MG674158) isolated from camels in Egypt sequences. Previously, the genetic diversity of T. evansi isolated from camels and cattle has been reported using the RoTat 1.2VSG gene [10, 38]. Further, the genetic diversity of T. evansi isolated from camels using the ITS-1 and ESAG6 genes has also been reported [42, 43].
Conclusions
The results of this study showed that T. evansi is circulating in cattle from Makkah for the first time. Two sequences were identified, based on RoTat 1.2VSG, with little genetic difference. The correlation between blood smear results and PCR results confirmed the estimate made by blood smear examination. For continuous screening, PCR testing is the preferred and recommended diagnostic method. However, it is necessary to genetically characterize the circulating T. evansi species.

