

Introduction
The increase in global population, the difficult international situation, and the intensification of climatic impacts have led to a reduction in food production in the world’s major food-producing countries. This means that global food reserves are threatened to diminish. Food security has become an international issue. It requires global cooperation. As an essential ecological resource, cropland is the ecosystem with the highest degree of human dependence. It is rich in ecosystem functions and provides ecosystem services to humans [1, 2]. Its ecological security also profoundly affects the quality of the regional ecological system, socio-economic growth, and other aspects. Recently, governments worldwide have been proactively advancing environmental protection and green development to protect fragile ecosystems [3]. Against this background, many countries have addressed the loss of cropland through environmental regulation. Environmental regulation is an important part of social regulation. That is to say, the government regulates production and business activities through administrative orders, administrative penalties, and other means to bring about sustainable development of the economy and the environment [4].
China bears the burden of food production as one of the world’s breadbaskets. However, for a long time, the rough development of China’s urbanization has resulted in various degrees of destruction of the ecological environment, including the massive consumption of land resources [5]. The whole party and society have also been highly concerned about food security in the new era. General Secretary Xi Jinping has emphasized that food production is the most important thing in the country, and cropland is the lifeblood of food production. The task of protecting cropland has not been eased but has become more arduous. On National Land Day 2023, China’s Minister of Natural Resources mentioned that China’s per capita cropland area was only 1.37 acre, which was only 1/3 of the world’s average. China’s cropland resources are continuing to face heavy stress [6]. On the one hand, there is an imbalance between economic pursuits and cropland protection [7]. On the other hand, cropland quality has declined markedly due to pollution and soil erosion [8]. In addition, there is the problem of non-food utilization of cropland [9].
To this end, China has developed a more comprehensive mechanism to protect cropland and has already achieved certain results, especially the policy of occupying and rebalancing cropland [10]. Due to the lack of effective economic incentives and the over-reliance of local governments on land finance, the policy has been implemented with implementation deviations such as taking up more than enough to make up for less [11]. This requires an ecological compensation mechanism to regulate the provision and consumption of cropland. In addition, cropland ecosystem services are characterized as transboundary, i.e., they have spillover effects. The services provided by cropland ecosystems will be reduced in the absence of adequate compensation. Therefore, regions need to first assess the extent of ecological overload of cropland [12]. This indicator compares the ability of cropland to meet the supply of human consumption for subsistence with human consumption needs. If the value is positive, it is ecologically sound; if it is negative, the cropland does not provide enough ecosystem services to meet human needs. In this case, there is a need for cross-regional mobility of cropland. This indicator digitizes the level of utilization of regional cropland ecology. On this basis, ecological value compensation will be provided for cropland. That is, compensation is provided by the beneficiaries of ecosystem services, from cropland to those who are damaged [13]. This requires calculating the criteria and order of payment for ecological value compensation [14]. In conclusion, the ecological value compensation not only stimulates the localities to actively participate in cropland protection but also effectively alleviates the contradiction between cropland protection and economic development. Because eco-compensation is now recognized as a reliable solution to economic and environmental conflicts, it can create a positive cycle in complex social systems [15, 16]. Accordingly, it is of practical value for this study to take the ecological value compensation of cropland in China as the research theme.
China’s main grain-producing and marketing area, Jiangsu Province, also has a pivotal position in the national grain supply. As early as 2009, the “China-EU Policy Dialogue Support” program set up a pilot project on economic compensation for cropland protection in Suzhou, taking the lead in establishing an economic compensation mechanism for cropland protection. In addition, Jiangsu Province is not only a large agricultural province but also a large economic province. It has suffered a significant loss of its high-quality cropland during the process of urban and industrial development. In order to cope with the problem, Jiangsu Province is also an early province in China that established a compensation system for cropland protection and has been continuously promoting the incentive mechanism for compensation for cropland protection in recent years. Considering the contribution made by Jiangsu Province’s food production and economic development in the whole country and even globally, this study takes Jiangsu Province as an example to empirically analyze the ecological value compensation of cropland, which has a certain representative significance. It also better reflects the conflict between cropland protection and economic development. This study explores the supply and demand of cropland ecosystem services and their ecological status in Jiangsu Province. Eventually, it can contribute to the construction of the ecological value compensation path of cropland in Jiangsu Province to provide new ideas. It can also offer references for the optimization of the cropland ecological compensation mechanism. Moreover, it can provide direct insights into managing cropland ecosystems both nationwide and worldwide.
Ecosystem services have value. The value of ecosystem services is a monetized valuation of ecosystems, which can reflect the well-being that natural capital brings to humans [17]. Therefore, scholars of ecological economics often refer to “ecological compensation” as “payment for ecosystem services”. Nowadays, developed countries or regions regard ecological compensation as boosting the development of green agriculture, and it is evident that ecological compensation for cropland is of vital significance [18, 19]. This means that the relationship between the value of ecosystem services and the amount of ecological indemnity is very close, so it can be said that the value of ecosystem services is a prerequisite for measuring the demand for ecological compensation. Costanza et al. first proposed the theory and method of quantifying the value of ecosystem services [20]. Subsequently, scholars measured the value of ecosystem services through the conditional value approach, the selection experiment approach, the opportunity cost approach, the equivalent factor approach, etc., to derive the ecological indemnity standard.
The conditional value approach is a direct investigation [21]. This approach targets ecological products or services for which there is no market transaction or actual market price. It values them through artificial market circumstances, i.e., the price people are willing to pay and accept [22]. However, the validity and reliability of this method have been widely criticized by scholars. The choice experiment approach is based on the theory of uniform maximization. It creates a uniform model of choice, i.e., a virtual marketplace, and provides the interviewees with a series of choice sets at different levels to choose their preferences. Ultimately, the economic worth of the ecological product or service is captured through their preferences [23]. Both of these methods involve the subjective will of the interviewee and, therefore, lack objectivity and cannot be operationalized on a wide range of scales. The opportunity cost approach estimates the value of an ecosystem service by maximizing the opportunity cost of protecting that service, i.e., the maximum benefit of the alternative use forgone [24]. The methodology does not take into account the ecological effects while measuring the losses to ecological protection; the resulting standard of compensation is on the low side. The equivalence factor approach was revised by Xie et al. based on Costanza’s [20] study to revise the ecosystem equivalence factors for different functions and to propose an ecosystem service valuation method applicable to China [25]. The methodology results in an objective and user-friendly scale of equivalence factors that have been extensively applied to assess the value of ecosystem services at different territorial ranges [26]. This method is a non-dynamic assessment method and has not been able to be updated with the spatial and temporal heterogeneity of ecosystems.
In addition, Zhou et al. [27] have found that the quantity of ecological indemnity calculated based on the value of ecosystem services alone is on the large side and not implementable. Thus, the value of ecosystem services is not equivalent to ecological compensation standards, and people’s consumption of ecosystems should also be included in the measurement [28]. That is, the ecological footprint and ecological carrying capacity also need to be combined to measure the ecological compensation standard. Rees [29] first introduced the idea of an ecological footprint, representing the demand for natural resources for human consumption by measuring the ecologically productive land needed to satisfy regional population development. Wackernagel [30] further developed the idea of ecological carrying capacity and evaluated the ecological surplus and deficit situation by comparing the ecological footprint and ecological carrying capacity. Specifically, the benefits of the resource environment required for human development, i.e., the ecological footprint, and the benefits derived from the natural resource environment, i.e., the ecological carrying capacity, can be converted into a comparable cropland area. This comparison can be used to assess whether human development influences ecological security [31]. Therefore, linking these concepts to measure ecological indemnity standards is feasible and reasonable.
Materials and Methods
Approximate Situation in the Study Area
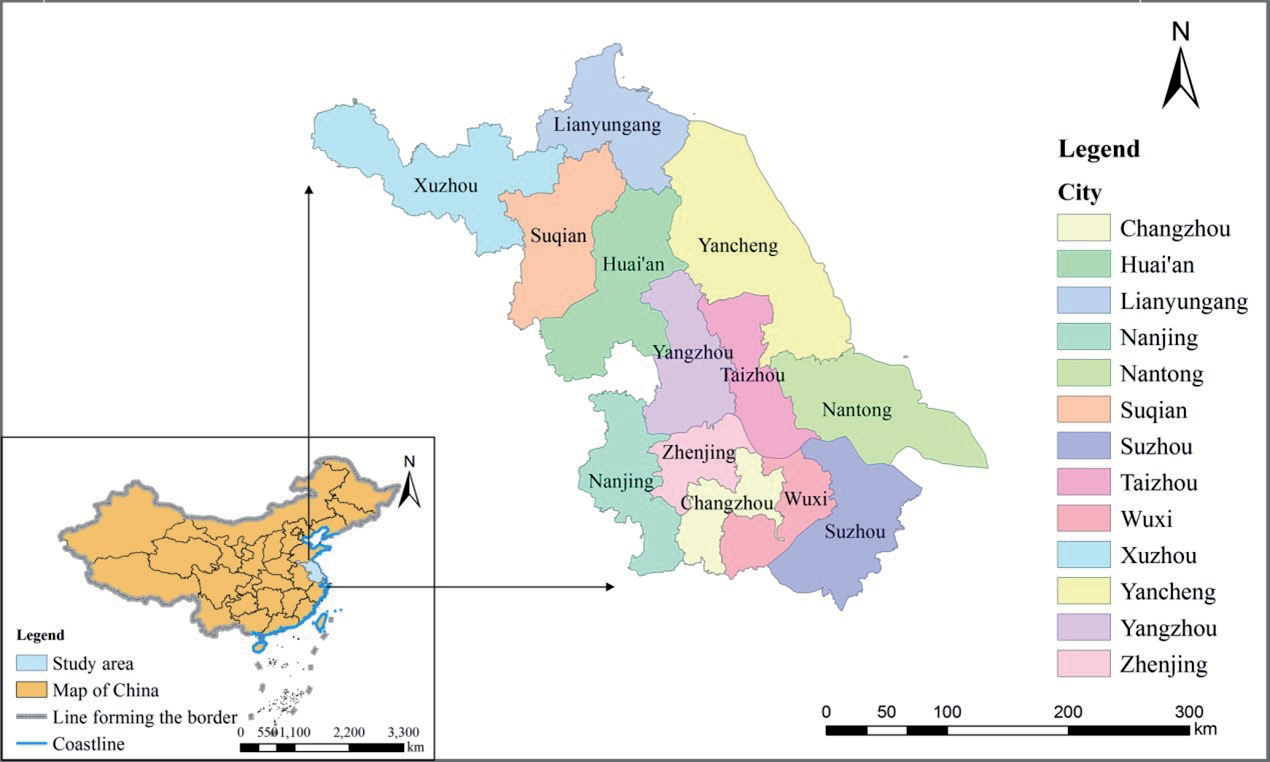
Jiangsu Province is situated in the Yangtze River Delta Plain and is one of the leading provinces in the Yangtze River Economic Belt. This Province includes Nanjing, Suzhou, Wuxi, Changzhou, and Zhenjiang in the southern part of Jiangsu, Yangzhou, Taizhou, and Nantong in the central part of Jiangsu, and Xuzhou, Huai’an, Yancheng, Lianyungang, and Suqian in the northern part of Jiangsu. A map of the administrative divisions of Jiangsu Province is shown in Fig. 1. All 13 of these cities are among the top 100 cities in the country, and eight of them have already met the standards of developed countries. In addition, Jiangsu Province has relatively superior natural conditions for cropland utilization. It relies on the two major basins of the Yangtze and Huaihe rivers, so it is rich in water resources. The province’s terrain is flat and is situated in the transition area from subtropical to warm temperate zone, with a mild climate and four distinct seasons. These conditions have caused it to become an essential agricultural region of the country. The total area of Jiangsu Province is 107200 km2, of which 4100465 hm2 is cropland. By the end of 2022, the resident population of Jiangsu Province was 85.15 million people, accounting for 6.03% of the national population, with a population density of 795 people/km2. These data are growing yearly, and the pressure of population carrying is heavy. The province’s GDP is 122875. 6×10⁸ yuan, and residents’ per capita disposable income is 49861.7 yuan.
Model Construction Ideas
The ecosystem service value compensation of cropland is to make the area with more ecological consumption of cropland pay compensation and make the area with less consumption get compensation in the form of money. It makes the ecological benefit output and beneficiary areas realize the ecological benefit complementarity. The ecological footprint modeling method needs to analyze whether the ecosystem service value of cropland can satisfy its consumption of cropland ecology. That is, the ecological footprint is compared with the ecological carrying capacity to determine whether the ecological consumption of cropland is overloaded. Suppose there is a surplus in ecological consumption. In that case, it indicates that the value of ecosystem service in the cropland ecosystem of the region can be exported outward, and ecological compensation should be received. If there is a deficit, it indicates that the value of ecosystem service in the region cannot meet ecological consumption, and ecological compensation should be paid. At the same time, the flow of ecosystem service values between regions is matched based on the ecological overload index. Determining the compensation coefficient according to the regional socio-economic development level is also necessary. Finally, a comprehensive compensation model is built based on the above.
Model for Measuring the Ecosystem Service Value of Cropland
This paper draws on the findings of Xie et al. [25] on quantifying the value of ecosystem services. It uses the parametric cross-referencing method to select the equivalent factor and its value to measure the value of the equivalent factor of cropland ecosystems in each city of Jiangsu province. The specific model is as follows:
In Equation (1), Ea denotes the unit equivalent factor value, yuan/hm2; n denotes the total number of cereals; based on actual cultivation and data availability, wheat, rice, and soybean were selected for this study, thus n = 3; i indicates a particular cereal; mi denotes the planting area of the i-th cereal, hm2; pi denotes the national average price of the i-th cereal, yuan/kg; qi denotes the production of cereal i, kg/hm2; M denotes the overall area sown to n cereals, hm2; and 1/7 refers to the economic value of a natural ecosystem in the absence of human involvement as 1/7th of the economic value of the unit area of food production services that cropland can provide [32].
The formula calculates the total ecosystem service value of regional cropland:
In Equation (2), Ae denotes the total ecosystem service value of regional cropland, 108 yuan; Ea denotes the unit equivalent factor value, yuan/hm2; and S stands for the overall cropland area in the region, hm2. Concerning the value of ecological services per unit area of China’s farmland ecosystems, as introduced by Xie et al. [25], the total ecological value per unit area of cropland ecosystems is 6.91. Considering that food production is expressed in the form of economic value, the total unmeasured value of cropland ecosystems is 5.91.
Cropland Ecological Carrying Capacity Measurement Model
The ecological carrying capacity of cropland is the summation of the cropland used for production occupied by a region. This indicator reflects the extent to which the cropland ecosystem is supplied and secure for human activities. The specific model is as follows:
In Equation (3), EC denotes the regional ecological carrying capacity of total cropland, hm2; N stands for the overall population in the area; a stands for the productive land area of cropland on a per capita basis, hm2; r denotes the regional cropland equilibrium factor; and y stands for the regional cropland yield factor. Most of the studies chose the results of Wackernagel et al.’s [30] measurements, i.e., a cropland equilibrium factor of 2.17 and a yield factor of 1.66. However, these values reflect the situation at the global level and are not pertinent to the production capacity of cropland in different provinces of China. Therefore, this paper refers to the measurements of the ecological footprint equilibrium factor and the yield factor of various regions of China proposed by Liu et al. [33, 34], that is, the ecological footprint equilibrium factor of 1.64 and the yield factor of 1.29 for Jiangsu province. The 0.88 is based on the recommendation of the World Commission on Environment and Development report that 12% of the region’s biologically productive land area for human use should be deducted to maintain biodiversity.
Cropland Ecological Footprint Measurement Models
The ecological footprint of arable land is the space of arable land that can provide resources and be consumed on the biologically productive arable land in the area [35]. This indicator may also reveal the extent of human utilization of cropland [36]. The measurement model is:
In Equations (4) and (5), EF1 denotes the ecological footprint of regional cropland, hm2; N stands for the overall population in the area; ef denotes the ecological footprint of regional cropland on a per capita basis, hm2/ person; and i denotes a specific consumable project in the region. Cropland is mainly cultivated for food crops and cash crops. The former includes cereal crops, potato crops, and legumes. The latter comprises fibers, oilseeds, sugar crops, tobacco, vegetables, melons, and fruits. Comprehensively, the actual agricultural production situation in Jiangsu Province, according to the availability of data, this paper selects seven crops as consumption items: rice, wheat, soybeans, potatoes, oil crops, vegetables, and melons and fruits. Next, r denotes the cropland equalization factor, which has a value of 1.64; Ai denotes the per capita area of biologically productive cropland converted for the i-th consumable project., hm2; Ci denotes the regional per capita expenditure on the i-th consumable project, kg/person; and Pi denotes the nationwide average production capacity of the i-th consumable project, kg/hm2.
Data on per capita consumption for each consumption item could not be calculated due to the difficulty in accessing data on import and export volumes for municipalities in the province. This study substitutes production for consumption. There is still some discrepancy between consumption and production, so this paper refers to Liu et al. [37] to introduce the correction coefficient of food consumption. The specific model is as follows:
In Equations (6), (7), and (8), βi denotes the regional food consumption correction coefficient; Fi denotes the regional food supply, i.e., production, kg; Di denotes the regional food demand, kg; C denotes per capita food possession, kg; γ denotes the food self-sufficiency rate; N stands for the overall population in the area; and EF stands for the total ecological footprint of regional cropland, hm2. The State Administration of Grain and Material Reserves released that by 2022, China’s per capita food possession was 480 kg, and the self-sufficiency rate of rations reached 100%, so C is 480 and γ is 100%.
Cropland Ecological Overload Index Measurement Model
The equitable use of cropland is crucial for the balanced development of different regions [38]. This requires measuring the level of ecological utilization of cropland systems in different regions. Therefore, the regional cropland ecological overload index model is introduced in this study. This indicator is the amount of the ecological carrying capacity minus the ecological footprint as a proportion of the ecological carrying capacity. The measurement model is:
In Equation (9), I represents the ecological overload index of regional cropland; EC represents the total ecological carrying capacity of cropland within the area, hm2; and EF represents the total ecological footprint of cropland in the region, hm2. If I = 0, it implies that the ecological utilization of cropland in this area is good. That is, the value of ecological services of cropland is just enough to satisfy the use of the region, and it is in a state of equilibrium. If I > 0, it implies that the region has an ecological surplus of cropland. The larger I is, the greater the surplus and the greater the ecosystem service value it can provide. On the contrary, if I < 0, it implies that the region is overloaded in terms of ecological use. The smaller I is, the greater the degree of overload and the greater the value of ecological services that need to be transferred from other regions.
Cropland Ecological Value Compensation Coefficient Measurement Model
The continuous development of the social economy increases people’s living standards. At the same time, people are deepening their understanding of the value of cropland ecosystem services and increasing their ability to pay for them. This level of awareness and ability to pay can be measured by an S-shaped Peel growth curve [39]. The quantification of this involves the level of economic advancement and the standard of living of the population, which can be measured by Engel’s coefficient. The measurement model is:
In Equations (10) and (11), t denotes the ecological value compensation coefficient of cropland in different time periods, and 0 < t < 1; e stands for the base number of the natural logarithm; En denotes the regional composite Engel’s factor; Eb denotes the urban Engel’s factor; Ec denotes the countryside Engel’s factor, with 0 < En, Eb, and Ec < 1; and δ denotes the level of urbanization. The smaller En is, the faster the economic and social progress of the area, and the larger t will be, indicating that residents are also more willing to make eco-compensation payments.
Comprehensive Measurement Model of Ecological Value Compensation for Cropland
Scientific and reasonable compensation standards for the ecological value of cropland should be in accordance with a profound understanding of the ecological benefits of regional cropland. Meanwhile, it also takes into account aspects like resource development and utilization in the compensation area and the actual compensation capacity. Therefore, the paper combines the regional cropland ecosystem service value, cropland ecological carrying capacity, cropland ecological footprint, the cropland ecological value compensation coefficient, and the regional economic development level to construct a comprehensive measurement model of regional cropland ecological value compensation [14]. The specific model is as follows:
In Equation (12), Aec denotes the overall amount of ecological value indemnity that is paid or received by the area for cropland, 108 yuan/year; Ae denotes the total ecosystem service value of regional cropland, 108 yuan/ year; EC denotes the ecological carrying capacity of the region’s total cropland, hm2; EF denotes the overall ecological footprint of the cropland in the region, hm2; t denotes the coefficient of ecological value compensation for cropland, and 0 < t < 1.
Data Sources
The data on grain crop yields, sown area, total cultivated area, total population, and production of each consumption item in each city of Jiangsu Province were obtained from the statistical yearbooks published by each city in 2023.
Data on the average price of each food crop and the national average production capacity of each consumption item were obtained from the China Rural Statistics Yearbook 2023.
Data on each municipality’s urbanization rate and Engel’s coefficient were derived from the Statistical Bulletin of National Economic and Social Development published by each municipality in 2023.
Results and Discussion
Measurement Results and Analysis of the Ecosystem Service Value of Cropland
Agroecosystems are one of the major landscapes worldwide and offer a number of vital ecosystem services to humans [40]. Ecosystem services are the types of benefits that humans derive from ecosystems. The economic value of cropland can be demonstrated in a market economy. However, the value of ecosystem services provided by cropland is often not monetized, leading to undervaluation. Referring to the above measurement model, the total ecosystem service value of cropland in Jiangsu Province in 2022 was 723.09×10⁸ yuan, and the ecosystem service value of cropland in each city is shown in Table 1. Among them, the value of ecosystem services of cropland that can be provided by the five cities in Southern Jiangsu Province was 97.04×10⁸ yuan, accounting for 13.42% of the total in the province. The value of ecosystem services of cropland that can be provided by the three city areas in central Jiangsu Province was 167.47×10⁸ yuan, accounting for 23.16% of the province’s total. The value of ecosystem services of cropland that can be provided by the five cities in the northern part of Jiangsu Province was 458.57×10⁸ yuan, accounting for 63.42% of the province’s total. In general, the ecosystem service value of cropland in Jiangsu Province showed a trend of more in the north and less in the south.
Table 1.
Ecological service value of cropland in cities of Jiangsu Province in 2022.
Measurement Results and Analysis of the Ecological Overload Index of Cropland
Comparing the ecological carrying capacity and ecological footprint of cropland can not only present the ecological status of regional cropland but also provide a reference for the ecological rationality assessment of cropland consumption and cropland compensation decision-making. Overall, the distribution pattern of ecological consumption of cropland in Jiangsu Province in 2022 was the most in southern Jiangsu, the second in central Jiangsu, and the least in northern Jiangsu. Specifically, cropland in all five cities in southern Jiangsu Province is in ecological deficit, with ecological carrying capacity < ecological footprint. The southern Jiangsu region has been a place of merchants and traders since ancient times and is still the most economically developed region in Jiangsu Province. Its course of promoting economic progress has taken up a large amount of cropland; simultaneously, many workers have also entered the southern part of Jiangsu Province. This has led to the ecological consumption level exceeding the ecological carrying capacity. The most serious overload was in Suzhou, where the ecological overload index of cropland reached -1.61. The cropland in the three cities in the central Jiangsu region and the five cities in the north Jiangsu region is in ecological surplus, and the ecological overload index ranged from 0.3 to 0.7.
As shown in Table 2, the ecological carrying capacity of arable land in Jiangsu Province were the largest in the north of Jiangsu Province as a whole, the second largest in the center of Jiangsu Province, and the smallest in the south of Jiangsu Province. On the contrary, the ecological footprint of arable land and the correction coefficient of food consumption was the largest in the south of Jiangsu Province as a whole, the second largest in central Jiangsu Province, and the smallest in the north of Jiangsu Province. The above data illustrated the “spatial anomaly” phenomenon between the ecological carrying capacity and ecological footprint of arable land in Jiangsu Province. In accordance with the methodology for determining regional ecological deficits or surpluses, the utilization of cropland resources in the five cities in southern Jiangsu Province in 2022 exceeded their ecological carrying capacity, manifesting an ecological deficit and requiring payment of ecological indemnity. The utilization of cropland resources in central and northern Jiangsu cities was within their carrying capacity, which was manifested as ecological surplus and ought to be received as ecological indemnity. Consequently, the effective use of environmental resources needs to be strategically placed in order to realize the mutual reinforcement of green development and affluent development [41, 42].
Table 2.
Ecological overload index of cropland in cities of Jiangsu Province in 2022.
Measurement Results and Analysis of Ecological Value Compensation for Cropland
The ecosystem service value of cropland in Jiangsu Province in 2022 could meet its ecological consumption in general, which was shown as surplus output. As shown in Table 3, Jiangsu Province as a whole could obtain a cropland ecological compensation fee of 138.68×10⁸ yuan in 2022. Among them, the southern part of Jiangsu Province needed to pay 67×108 yuan, and the city that paid the most was Suzhou, which needed to pay 26.42×10⁸ yuan, accounting for 39.4% of the total payment in southern Jiangsu. Central Jiangsu could obtain 33.36×10⁸ yuan of ecological compensation for cropland, accounting for 16.22% of the total obtained compensation cost in central Jiangsu and north Jiangsu, of which the city with the least obtained compensation cost was Yangzhou with 9.16×10⁸ yuan. The northern part of Jiangsu Province was able to obtain ecological compensation of 172.32×10⁸ yuan, which made up 83.78% of the overall indemnity fees obtained in central and northern Jiangsu Province, of which the city with the most compensation costs was Yancheng, amounting to 64.23×10⁸ yuan, which made up 37.27% of the indemnity fees obtained in the northern part of Suzhou.
Discussion
This study measures the ecological value compensation of cropland based on the current state of economic development. The results are not detached from the actual situation in each city. Regarding the study of ecological value reparation for cropland in Jiangsu Province, Zhang et al. [43] studied the topic with the help of data from 2011. The results of their study are compared with the results of the present study, and the following conclusions are drawn. The first is the ecosystem service value of cropland, measured by the same model. The former produced a result of 686.40×10⁸ yuan, while the present study produced a result of 723.09×10⁸ yuan. The former selected more food crops than this study in its measurement. The results obtained from this study were still higher than those. It can be seen that Jiangsu Province has made some achievements in the ecological protection of cropland during this decade. The second is the ecological overload index of cropland. They were measured using different equilibrium factors and yield factors, and there were some differences in the measurement model. Overall, the results of the former study were the same as those of this study, both of which showed that cropland ecology in the economically developed region of southern Jiangsu was in deficit, while that of central and northern Jiangsu was in surplus. These results fully reflect the contradiction between cropland protection and economic development. Finally, the amount of ecological compensation for cropland, which was the two parts of the measurement model, was also inconsistent. A comparison of the whole reveals a large difference between the former’s final measurement of 16.99×10⁸ yuan and the latter’s measurement of 138.68×10⁸ yuan. This also proves that the ecological situation of cropland in Jiangsu Province has improved considerably during this decade. This is because Jiangsu Province has gradually introduced relevant policies and documents to put the protection of cropland on a legalized track, such as the regulations on land management in Jiangsu Province, the implementing comments on further enhancing the protection of cropland and improving the balance between occupation and compensation, and the measures for assessing the responsibility of cropland protection in municipal governments of the districts in Jiangsu Province. Implementing these policy documents has yielded corresponding policy effects and has gradually created synergies in cropland protection.
Table 3.
The amount of ecological compensation for cropland in cities of Jiangsu Province in 2022.
Conclusions
Regarding the ecosystem service value of cropland, in 2022, Jiangsu Province as a whole reached 723.09×10⁸ yuan. Among them, the ecosystem service value of cropland in the five cities in southern Jiangsu Province totaled 97.04×10⁸ yuan. The three cities in central Jiangsu had a total cropland ecosystem service value of 167.47×10⁸ yuan. The five cities in northern Jiangsu had the highest ecosystem service value of cropland, with 458.57×10⁸ yuan. Its overall distribution was the least in the south of Jiangsu Province, slightly more in the center of Jiangsu Province, and the most in the north of Jiangsu Province, i.e., showing a trend of more in the north and less in the south. Regarding the ecological overload of cropland, in 2022, the south of Jiangsu Province showed an ecological deficit, while there were surpluses in the central and northern parts of Jiangsu Province. There were slight surpluses in the central Jiangsu region and the largest surpluses in the north Jiangsu region. The overall performance was a loss in the south and a surplus in the north. Regarding the ecological value compensation for cropland, the five cities in the southern part of Jiangsu Province had to pay a total of 67×108 yuan of ecological compensation for cropland in 2022. Suzhou’s central and northern regions could get 33.36×10⁸ yuan and 172.32×10⁸ yuan of cropland ecological compensation fees, respectively. Jiangsu Province as a whole could get 138.68×10⁸ yuan of ecological compensation fees for cropland. The total ecological value compensation of cropland was positive in most areas of Jiangsu Province, i.e., it was a state of ecological surplus, so Jiangsu Province should adopt a vertical and horizontal combination of ecological compensation for cropland. According to the calculations, the municipal intergovernmental financial transfers could cover 67×108 yuan in reimbursement costs, leaving a shortfall of 138.68×10⁸ yuan. This requires provincial governments to draw funds for ecological compensation of cropland from special funds, such as vertical fiscal budgets.
Recommendations
The realization of ecological value compensation for cropland mainly relies on intergovernmental financial transfers, including vertical and horizontal financial transfers. The former refers to the Union or the State as the main compensation body. In accordance with the principle of “the consumer pays”, a certain percentage of its budget, as well as of the taxes and fees paid by the public, such as cropland occupation tax, cropland reclamation fees, land transfer fees, and land reimbursement fees, is taken to form a special fund, which is then disbursed to the State, the provincial level, or the local and municipal levels. The latter refers to the transmission of compensation between different provinces or different municipalities within a province, with the local government of the ecological deficit area acting as the main body of compensation to the ecological surplus area. Horizontal ecological compensation mechanisms have been implemented in Shanghai, China [44], as well as in some countries such as Brazil and Germany [45]. After the compensation for the ecological value of cropland reaches the local government, its specific distribution can be modeled on the operation of China’s cropland fertility protection subsidy policy. That is, it is distributed to farmers through land consolidation and agricultural subsidies. Farmers are required to manage their real names. Municipal governments validate the subsidized area reported by farmers at the cascade level in the current year. Through the special account for social security benefits, the agricultural and rural departments deposit the subsidy funds into the social security cards of farmers in a lump sum. Finally, farmers can take their social security cards to financial institutions to receive the subsidy money [46]. In addition to direct compensation in monetary terms, multiple forms of compensation can coexist. For example, the city of Chengdu provides compensation funds through farmers’ pension subsidies [47]. Alternatively, compensation is provided through investment in public services such as rural education and healthcare institutions. Alternatively, compensation for industrial development can be provided to farmers, which, on the one hand, can provide them with technical support to improve the production level of their cropland. On the other hand, it can provide farmers with dividends from land shares. The above ecological value compensation methods for cropland not only contribute to the sustainable supply of cropland ecosystem services but also ease the relationship between cropland protection and economic development. That is, the investment in cropland environmental protection and ecological restoration can be increased through ecological compensation [48].
Limitations and Prospects
It is worth stating that this study still has some limitations, which include the following. Regarding the ecosystem service value of cropland, this study could not comprehensively obtain relevant data when measuring, and only wheat, rice, and soybean were selected as the main food crops. The value of ecological services measured on this basis may be small and subject to some error. Regarding the ecological carrying capacity of arable land, the equilibrium factor and yield factor of the ecological footprint of cropland utilized in this study were proposed by Liu et al. in 2010 [33]. This data may be subject to relevant changes, resulting in a measurement deviation. Regarding the ecological footprint of cropland, due to the lack of data on the per capita consumption of each consumption item in each city in the province, this study uses per capita production as a substitute. This method’s result may be as small as the food-input region’s ecological footprint. In contrast, the ecological footprint of a food-exporting region may be on the large side, which is unreasonable. Under this consideration, this study introduces a correction factor for food consumption with reference to Liu et al. [21]. However, there may still be some errors with the actual per capita consumption. In addition, this study only identifies payment and reimbursement areas and does not go into depth to determine the corresponding payment and reimbursement relationships between municipalities. Therefore, this study suggests that in order to reduce the research hindrance caused by data inaccessibility, future research could optimize and update the calculation method of the cropland ecological footprint as well as the balance factor and yield factor of the cropland ecological footprint and also further study the specific transmission of the cropland ecological value compensation payment.

